Real-Time Visualization for SMBs: Benefits
How SMBs use real-time dashboards to speed decisions, reduce manual work, detect issues early, and improve customer experience.
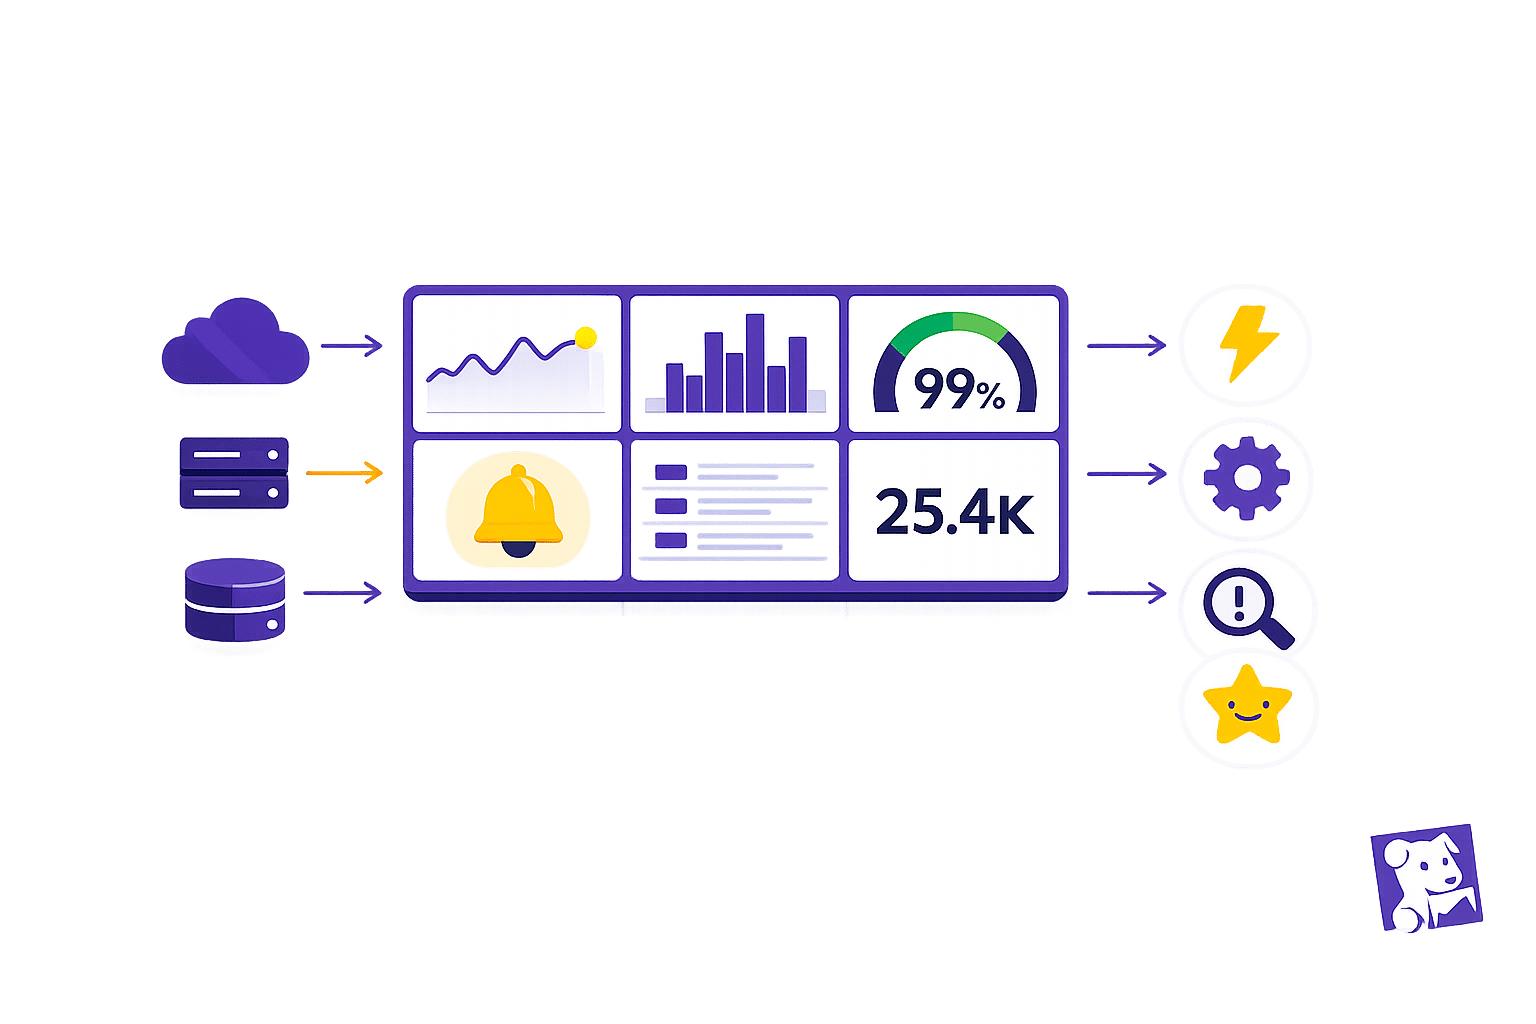
Real-time visualization helps small and medium-sized businesses (SMBs) make faster, data-driven decisions by providing live insights into operations and performance. Here's why it matters:
- Faster Issue Resolution: Traditional reporting delays can lead to missed opportunities and unresolved problems. Real-time dashboards enable SMBs to detect and address issues, like failed transactions or system bottlenecks, immediately.
- Simplified Data Management: Manual data processes consume up to 50% of SMB teams' time. Real-time tools reduce this burden, allowing teams to focus on growth and strategy.
- Improved System Monitoring: Static reports often hide critical issues. Real-time insights highlight anomalies in metrics like latency or customer behavior, helping SMBs respond proactively.
- Enhanced Decision-Making: With live dashboards, SMBs can link key metrics (e.g., sales, sign-ups) to system performance, enabling quick, informed decisions.
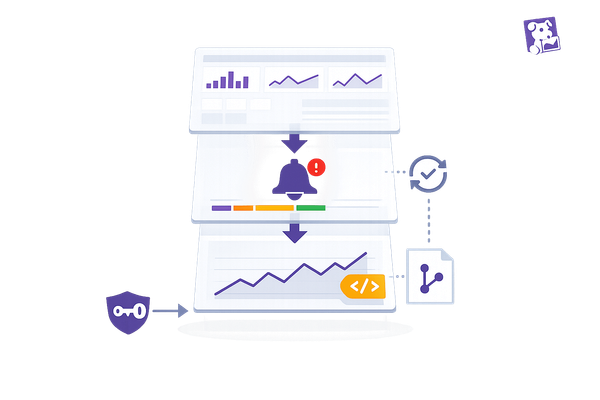
Datadog's real-time visualization tools consolidate data, automate anomaly detection, and provide user-friendly dashboards, making it easier for SMBs to monitor performance and improve customer experiences.
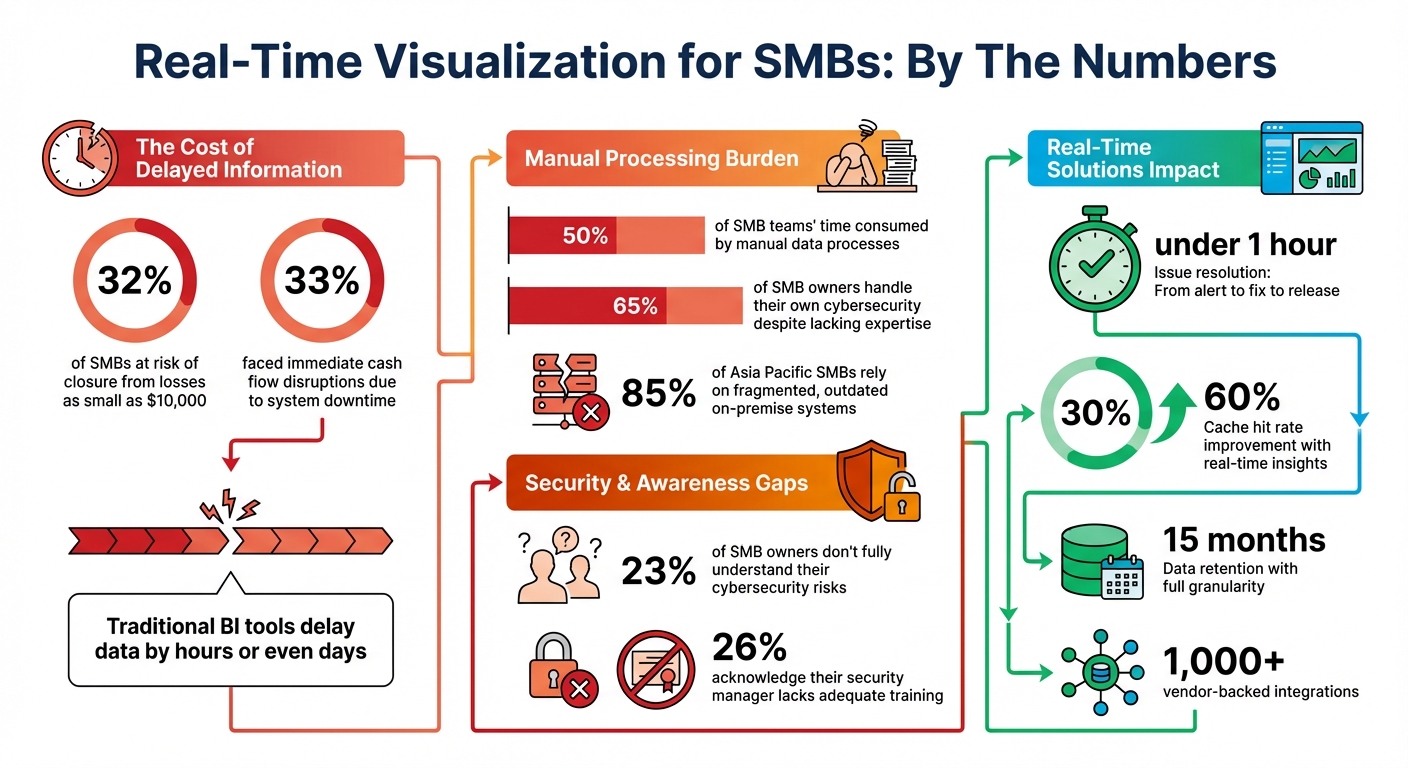
Real-Time Visualization Impact on SMB Operations: Key Statistics
How to Implement Dashboards for your SMB
Common Monitoring Problems for SMBs Without Real-Time Visualization
For small and medium-sized businesses (SMBs), operating without real-time insights can lead to serious challenges. Static reports and manual processes often leave companies struggling to keep up with the fast-paced demands of today's market. Here's why having immediate, real-time visibility matters so much.
Late Information and Missed Opportunities
Traditional business intelligence tools often rely on batch processing, which means data isn't available until hours or even days after an event occurs. This delay creates a critical blind spot. Problems like failed transactions or abandoned shopping carts may go unnoticed until customer complaints or financial reports reveal the issue. Static reports also fail to provide timely warnings about declining customer numbers or loyalty shifts. By the time these trends appear in a monthly report, it’s often too late to act.
The stakes are high: 32% of SMBs are at risk of closure from losses as small as $10,000. Additionally, 33% have faced immediate cash flow disruptions due to system downtime. Without real-time alerts, businesses are forced into reactive crisis management, missing opportunities to address issues before they escalate. This reactive approach not only hides potential problems but also increases the strain on already stretched teams.
Manual Data Processing Overwhelms Teams
One of the biggest hurdles for SMBs is the time spent reconciling data manually. Small IT and finance teams often dedicate as much as 50% of their time to this tedious task, leaving little room for strategic work. Matt McManus, CFO at Kainos, summed it up perfectly:
The team was spending half its time crunching numbers instead of advising the business.
This challenge is even more pronounced for SMBs where resources are tight. For instance, 65% of SMB owners handle their own cybersecurity, even when they lack the necessary expertise. Additionally, 85% of SMBs in Asia Pacific still rely on fragmented, outdated on-premise systems, creating data silos that demand constant manual effort to bridge.
When teams are bogged down crunching numbers, they lose valuable time that could be spent innovating, improving security, or tackling growth-focused projects. Real-time dashboards can lift this burden, allowing teams to shift their focus to high-impact analysis and decision-making.
Struggles with Detecting System Issues
Manual processes don’t just overwork teams - they also make it harder to spot critical system failures. Traditional reporting often emphasizes averages, like mean latency, which can obscure serious problems. For example, an average latency of 100 ms might sound fine, but it could be hiding that 1% of requests take over 5 seconds, creating a poor experience for a significant group of users.
This reliance on averages can lead to "alert fatigue." Small teams are bombarded with so many alerts that it becomes nearly impossible to separate urgent issues from false alarms. The result? SMBs often remain unaware of their vulnerabilities. In fact, 23% of SMB owners admit they don’t fully understand their cybersecurity risks, and 26% acknowledge that the person managing their security lacks adequate training. Without the ability to quickly connect business metrics to system health, teams are left scrambling to fix problems only after they’ve hurt customer trust and revenue.
How Datadog's Real-Time Visualization Solves SMB Monitoring Problems
Datadog addresses the monitoring challenges and scaling with Datadog for SMBs by providing real-time insights into business and system data. Instead of relying on outdated batch processing, it delivers instant visibility into infrastructure and application performance. This allows smaller teams to act quickly and efficiently. Here's how Datadog makes this possible.
Live Dashboards for Instant Information
Datadog's live dashboards let SMBs access crucial metrics in real time, without the hassle of managing complex data infrastructure. Thanks to its cloud-based design, teams can start visualizing metrics within moments of deployment. The dashboards adapt to any screen size and support a variety of widgets, such as heatmaps and log streams, ensuring seamless monitoring across devices.
Greg Shackles, VP of Technology at Olo, highlighted the impact of this unified visibility:
"We have our customer success engineers, our VP of Finance, our CEO, all using Datadog as a visualization tool for just how close we are to accomplishing some important goal as a company."
Combined Data from Multiple Sources
Datadog simplifies operations by consolidating data from over 1,000 vendor-backed integrations. Using unified tagging, teams can easily shift between business metrics like sign-ups or purchases, infrastructure performance, and application logs - all within a single platform. Metrics are stored for 15 months with full granularity, enabling historical trend analysis and deeper insights. For businesses with multiple units, account federation allows a parent account to gather data from child accounts into one comprehensive dashboard.
Early Problem Detection
Datadog's Watchdog AI employs machine learning to identify anomalies and potential issues before they escalate and affect critical applications. By automating root cause analysis, small teams can reduce their Mean Time to Recovery (MTTR) without needing additional staff. Features like Error Tracking organize large volumes of errors into manageable, actionable items, helping to combat alert fatigue. Real-time Change Tracking further enhances precision by correlating performance issues with specific code deployments, feature flags, or configuration changes, eliminating guesswork.
Main Benefits of Real-Time Visualization for SMBs
Building on how Datadog addresses common monitoring challenges for SMBs, these benefits highlight clear advantages in operational efficiency and decision-making.
Faster Decisions
Real-time visualization removes the lag associated with traditional business intelligence tools. Instead of waiting hours - or even days - for batch-processed data, SMBs can access insights within seconds. This instant access allows businesses to respond quickly to issues that could impact revenue. By linking key performance indicators (KPIs), like purchases or signups, with infrastructure health, decision-makers gain actionable insights at a glance.
Take Matt Perpick, an engineer at Datadog, as an example. He used real-time graphs to identify a bottleneck in the company’s metrics processing system. The data showed a spike in database rows and a low cache hit rate of 30%. Adjusting the cache expiry from 2.5 minutes to 10 minutes boosted the hit rate to 60%. As a result, the team went from identifying the issue to deploying a fix in under an hour. Perpick summed it up well:
"That's why we were able to go from an alert to a fix to a release in under an hour. Because we could see what was happening with the system."
This level of visibility enables SMBs to take swift, informed actions, giving them a competitive edge.
Streamlined Operations
Continuous monitoring simplifies operations by integrating business metrics and system performance under one platform using shared tags. For instance, SMBs can track backend metrics like inventory levels or abandoned carts in real time, eliminating the need for manual data collection. Machine learning capabilities further enhance this process by detecting anomalies and potential issues before they affect customer satisfaction or revenue.
Access to historical data also helps businesses identify patterns and trends, leading to smarter decision-making. By unifying teams - whether developers, operations, or customer support - on a single real-time dashboard, everyone stays aligned on goals and KPIs. This holistic view improves coordination and drives more efficient operations, ultimately enhancing the customer experience.
Enhanced Responsiveness and Customer Satisfaction
Real-time visibility allows SMBs to catch issues like failed check-ins or abandoned carts almost instantly, often resolving problems before customers are even aware. Real User Monitoring provides granular insights into user interactions, such as clicking "play" or adding items to a cart, helping businesses understand how user experience impacts outcomes.
This level of responsiveness has a direct impact on customer retention and revenue. Addressing technical issues quickly prevents them from escalating into customer complaints, preserving trust and satisfaction. For SMBs - 32% of which are at risk of closure from losses as small as $10,000 - this proactive approach to customer experience is a crucial advantage in staying competitive.
How SMBs Can Set Up and Use Datadog's Real-Time Dashboards
Datadog's real-time visualization tools can be a game-changer for SMBs, offering insights without the need for deep technical expertise. By starting with pre-built dashboards for platforms like AWS, Azure, or NGINX, SMBs can set up a reliable monitoring system quickly. These dashboards can then be cloned and customized to align with specific business needs, saving time while laying a solid foundation for tracking performance.
Tailoring Dashboards to Your Business
Customizing dashboards is where the magic happens. Choose widgets that fit your goals - like timeseries for spotting trends or heatmaps for identifying patterns. To make sense of raw data, apply tools like rollups, rates, or regressions to transform it into actionable metrics. Features like template variables and unified service tagging allow you to create a single, flexible dashboard that evolves alongside your business. This approach helps avoid unnecessary clutter as your operations expand.
Want to make your data even more meaningful? Add annotations to mark key events such as product launches, code deployments, or marketing campaigns. These notes provide context when analyzing performance changes, making it easier to connect the dots.
Once your dashboard is set up, the next step is configuring real-time alerts to ensure you can act quickly when needed.
Configuring Real-Time Alerts
Datadog's Monitors are the backbone of its alerting system, keeping tabs on metrics, logs, and integrations across your stack. SMBs can jumpstart this process by using monitor templates for commonly used services, setting clear warning and critical thresholds to prioritize responses effectively.
To make alerts actionable, integrate them with tools like email, Slack, Microsoft Teams, or PagerDuty. Using message variables such as {{host.name}} or {{value}} in alert descriptions gives your team immediate context, so they can address issues without logging into the platform. Notification rules help streamline alerts by directing them to the right people or channels based on severity or tags, cutting down on unnecessary noise. And with the Downtimes feature, you can silence alerts during planned maintenance, avoiding distractions from false alarms.
Expanding Visualization as You Grow
As your business scales, your monitoring needs will grow too. Features like Service Level Objectives (SLOs) can be added to dashboards to track performance against business goals and error budgets, ensuring teams stay focused on priorities. For more complex infrastructures, tools like the Software Catalog and Service Map provide a clear picture of how different systems and services interact, helping you manage dependencies effectively.
Need to share insights with others? Dashboards can be shared externally through secure embedded links or sent as automated reports, keeping stakeholders in the loop without requiring them to log in. For SMBs looking to save time, enabling Watchdog can add an extra layer of automation. This AI-powered tool detects anomalies and pinpoints root causes, eliminating the need to manually configure every threshold as your operations grow more complex.
Conclusion: How Real-Time Visualization Supports SMB Growth
Real-time visualization transforms how SMBs operate and grow. By eliminating the delays of traditional business intelligence tools, Datadog helps small teams catch problems impacting revenue before they snowball into customer complaints.
With unified dashboards, teams gain shared access to critical, up-to-the-minute data. This alignment ensures leaders across departments stay focused on priorities, whether it’s tracking orders, monitoring signups, or maintaining system health. It also breaks down the silos that often slow decisions and create inefficiencies.
As a fully hosted SaaS platform, Datadog takes the heavy lifting out of managing infrastructure. There’s no need to worry about operating, securing, or backing up proprietary data stores - freeing up your team to concentrate on growing the business instead of maintaining systems.
AI-driven features like Watchdog add another layer of efficiency by automating anomaly detection and incident response. This reduces manual troubleshooting, even as your infrastructure scales, allowing your team to focus on strategic initiatives.
FAQs
Which metrics should an SMB put on a real-time dashboard first?
Small and medium-sized businesses (SMBs) need to focus on metrics that give them a clear picture of their system's health, performance, and user experience. Key areas to monitor include uptime, error rates, response times, and resource utilization (such as CPU, memory, disk, and network usage). Adding application performance metrics like request throughput and latency can help spot issues early and enhance overall service quality. By keeping an eye on these essentials, businesses can quickly identify problems and manage their infrastructure more effectively.
How do I reduce alert noise while still catching real issues?
Cutting through the noise of constant alerts is crucial to focus on real issues. With Datadog's alert management tools, you can make notifications more meaningful and actionable. Here's how:
- Fine-tune thresholds: Adjust alert thresholds to better reflect what constitutes an actual issue.
- Enable anomaly detection: Let Datadog identify unusual patterns automatically, reducing false positives.
- Use composite monitors: Combine related alerts into a single notification to simplify tracking.
Additionally, you can:
- Set alert priorities: Label alerts by importance to ensure the most critical ones get immediate attention.
- Route alerts with tags: Use tags to direct notifications to the right teams or individuals.
- Automate responses: For recurring issues, set up automated actions to resolve them quickly.
Make it a habit to review and update your alert rules regularly. This helps ensure you're catching the critical problems without being overwhelmed by unnecessary notifications.
What’s the fastest way to get Datadog dashboards running with limited staff?
To set up Datadog dashboards quickly with a small team, take advantage of the platform's built-in features. Begin by clicking +New Dashboard and choosing a layout that fits your needs. Save time by using the drag-and-drop Dashboard builder and pre-built visualizations, which make the process straightforward. Additionally, participating in Datadog’s training sessions can help your team learn how to customize dashboards effectively, ensuring you can monitor key metrics with ease.