
5 Key Metrics to Track with Datadog
Learn which five key metrics to monitor in Datadog to enhance system performance, reliability, and cost management.
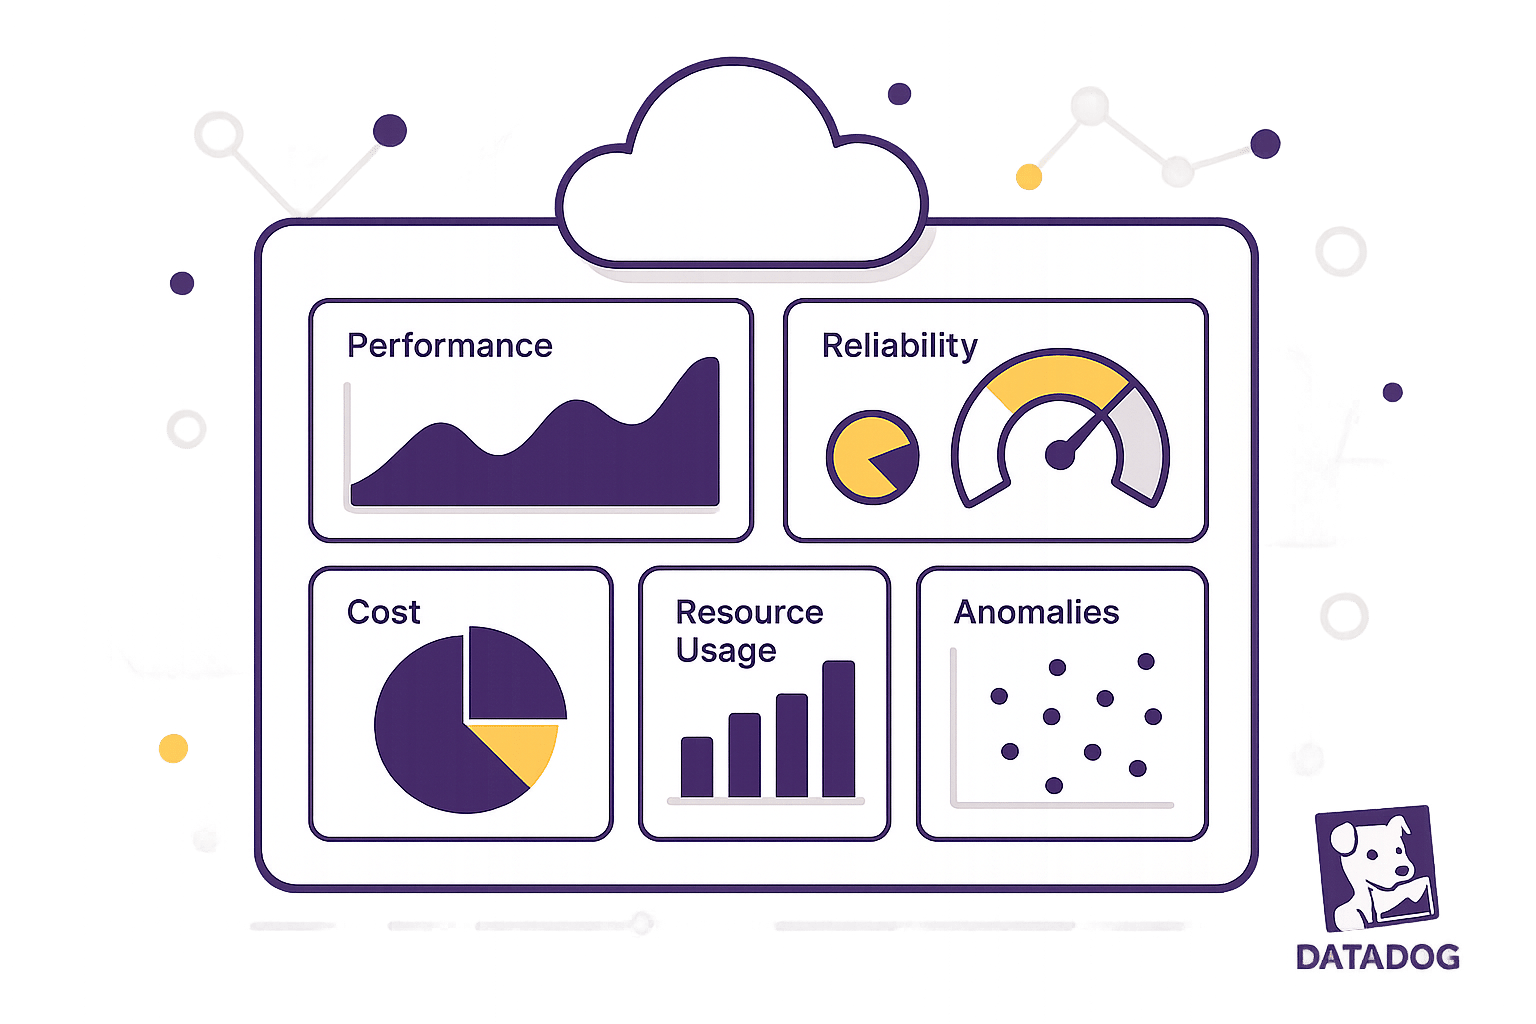
Monitoring the right metrics is essential for maintaining system performance and reliability. If you're using Datadog, here are the five most important metrics to track:
- Request Response Time: Measure how fast your application responds to user requests and identify bottlenecks.
- Request Success Rates: Track successful vs. failed requests to quickly catch system issues.
- System Load: Monitor CPU, memory, and disk usage to ensure your infrastructure is running smoothly.
- Network Traffic Volume: Analyze traffic patterns to optimize performance and manage costs.
- Group Resource Usage: Use tags to track resource consumption across teams or services for better cost control and performance.
Datadog - Using Metrics to Measure and Understand Your ...
Metric 1: Request Response Time
Monitoring response time is key to maintaining top-notch application performance. It helps you pinpoint and resolve delays before they disrupt your operations.
Tracking Response Time in Datadog
Datadog APM provides detailed insights into response times using advanced distributed tracing. It automatically tracks requests from your browser or mobile apps to backend services and databases, giving you a clear view of how your application performs.
Here’s how to monitor response times effectively with Datadog:
- Enable distributed tracing: Set up the Datadog Agent to collect trace data automatically - no need for code changes or system restarts.
- Set sampling controls: Adjust sampling settings at the host, service, and endpoint levels to balance visibility and cost.
- Build custom dashboards: Create visualizations to display response time metrics alongside infrastructure data for better analysis.
These steps help you quickly identify and address performance bottlenecks.
Chris Peraza, Cloud Engineer at Whatnot, highlights the advantage of this approach:
"Datadog APM enables our developers to see the entire path from our iOS and Android clients all the way down to services they have built."
Why Response Time Matters for Business
Slow response times can frustrate users and hurt revenue. By monitoring response times, you can catch and fix performance issues before they escalate. Peloton’s CTO Yony Feng shared an example of this in action:
"Within the first 30 to 45 days, we were able to quickly identify the top five endpoints that had performance issues and reduce response times by 80 to 90%."
Metric 2: Request Success Rates
Success rates provide a clear picture of your system's health by comparing successful requests to failed ones. Monitoring these rates helps identify potential problems before they affect users.
Setting Up Success Rate Alerts
You can configure success rate alerts in Datadog to catch problems early while avoiding unnecessary notifications. Here's how to set them up:
- Go to the Monitors section and click on New Monitor.
- Select Metric as the monitor type.
- Define your success rate formula:
- Use: (Successful Requests / Total Requests).
- Set thresholds for percentage drops and minimum request counts.
For effective monitoring, use these key parameters when configuring your alerts:
- Primary Alert: Trigger when the success rate drops below 98%.
- Volume Threshold: Ensure the system processes at least 100 requests within the evaluation period.
- Evaluation Period: Use rolling 5-minute windows for accuracy.
- Recovery Rules: Require consistent improvement for two consecutive evaluation periods before marking the issue as resolved.
Once an alert is triggered, dive deeper into the data to identify the root cause of the issue.
Connecting Success Rates to System Problems
Success rates often reflect specific system events or infrastructure changes. To diagnose problems effectively when rates drop, Datadog provides several tools for correlation:
-
Tag-Based Analysis
Use detailed tags in your monitoring data to spot patterns across different system components. This helps determine whether the issue is affecting a single service or multiple parts of your infrastructure. -
Dynamic Alerting
Adjust alert thresholds based on real-time conditions. For example, set stricter thresholds during peak usage times and more relaxed ones during maintenance or low-traffic periods. -
Event Correlation
Link success rate drops to system events by tracking error log spikes, deployment schedules, and infrastructure changes.
Datadog's correlation features make it easier to pinpoint the root cause of success rate drops. For example, you might find that a recent code deployment coincides with an increase in errors, or that resource limitations in a specific service are causing widespread failures.
Metric 3: System Load
Monitoring system load is a key way to assess infrastructure health and how resources are being used. By analyzing load patterns, you can spot performance issues and make better decisions about resource allocation.
Understanding System Load Patterns
Datadog's tools give you a clear view of metrics like CPU usage, memory, network throughput, and disk I/O. With customizable dashboards, you can monitor these in real time, helping you catch issues early. Plus, advanced anomaly detection can help you spot when things start to deviate from the norm.
Identifying Unusual Load Changes
Datadog uses machine learning to learn what "normal" looks like for your system. When metrics stray too far from these learned baselines, the platform sends alerts, helping you address problems before they escalate.
Tips for Effective Load Monitoring:
-
Set Dynamic Thresholds
Use historical data to define baseline thresholds and adjust alert settings to match normal usage patterns. -
Create Multi-Level Alerts
Set up tiered alerts to notify the right teams as system load increases. Make sure there's a clear plan for escalating different levels of alerts. -
Leverage Host Correlation
Group related services and monitor how they interact. This helps you see how load changes in one area might affect others.
For environments where static thresholds fall short, anomaly monitors are a great option to track unexpected load changes. They’re especially useful in systems with complex or changing usage patterns.
Metric 4: Network Traffic Volume
Monitoring network traffic is just as important as tracking response times and system load. It provides essential insights to keep your operations running smoothly. With Datadog, you can monitor network traffic effectively to improve performance and manage costs.
Measuring Network Traffic
Datadog offers detailed visibility into network traffic across multi-cloud, hybrid, and on-premises setups. It automatically detects and gathers data from all network devices, delivering insights into traffic trends.
Here’s how to monitor network traffic effectively:
- Enable flow monitoring: Capture Layer 3 traffic from containers, virtual machines, and serverless functions.
- Group by tags: Use tags like container ID, team, role, service, or availability zone to organize traffic data for better analysis.
- Create custom dashboards: Build visualizations to track key metrics such as bandwidth usage, packet loss, and latency.
"Datadog CNM gave us immediate visibility into all our Kubernetes cluster traffic. As soon as a new cluster is spun up, we can see if pods communicate as expected and if internal DNS is doing its job." - Miguel Mingorance, Systems Engineer at Delivery Hero
With clear traffic visualizations, you can use these insights to improve efficiency and control costs.
Managing Traffic Costs
Understanding traffic patterns can reveal ways to cut costs and boost performance. Datadog’s analytics tools make this easier by helping you:
- Monitor top traffic sources: Identify which applications, services, or teams are consuming the most bandwidth. This helps you spot unexpected usage and allocate resources more effectively.
- Set smart alerts: Configure alerts to catch unusual traffic behaviors, such as:
- Sudden data transfer spikes
- Unexpected connectivity drops
- Odd geographic traffic distributions
- Access to suspicious domains
"With Datadog CNM, we can quickly determine if our network is at fault for slow traffic or low connectivity before our applications are affected, so that insuring travel is a seamless experience for our customers." - Alex Kanevsky, Lead Architect at Generali Global Assistance
Traffic Analysis Best Practices
| Focus Area | Monitoring Strategy | Business Impact |
|---|---|---|
| Cost Control | Track top talkers and bandwidth trends | Reduce cloud expenses and improve resource use |
| Performance | Watch interface saturation and bottlenecks | Avoid slowdowns and service interruptions |
| Security | Analyze traffic patterns and suspicious domains | Safeguard against potential threats |
| Capacity Planning | Use historical data to forecast needs | Plan infrastructure upgrades effectively |
Metric 5: Group Resource Usage
Keep an eye on how different groups use resources to better manage infrastructure and control spending. Datadog's tagging system makes it easy to track and understand usage patterns across your organization.
Using Resource Group Tags
Start by setting up proper tags for your resources. Datadog automatically pulls in tags from cloud platforms and Kubernetes clusters. To get the most out of group resource tracking:
- Use the global
envtag to distinguish between environments like development, staging, and production. - Tag resources by data center location to quickly filter during incidents.
- Organize services by business function to allocate costs more accurately.
The Service Catalog can help document ownership and improve incident response. Below are some tag categories you can use to organize your resource groups:
| Tag Category | Purpose | Example Tags |
|---|---|---|
| Environment | Separate infrastructure stages | prod, dev, staging |
| Business Unit | Track department usage | marketing, sales, engineering |
| Cost Center | Monitor budget allocation | cc-1234, cc-5678 |
| Application | Group related services | payment-api, user-auth |
Resource Group Analysis
Once your resources are tagged, Datadog's Resource Catalog provides detailed insights to help you manage costs, enforce governance, and improve performance.
1. Cost Management
The Cost tab in the Resource Catalog shows total expenses and spending patterns:
- Monitor cost trends over time.
- Spot high-cost resources across cloud providers.
- Get actionable tips to reduce expenses.
2. Resource Governance
The Governance view lets you define and enforce tagging policies, ensuring:
- Quick detection of resources missing key tags.
- Faster incident investigations.
- Better planning for upgrades.
3. Performance Optimization
Analyzing resource metrics by group helps you:
- Compare usage across teams.
- Identify services that are underutilized.
- Plan capacity using historical data.
Set up primary tags to group key metrics. This approach provides a clear picture of resource usage, helping you make smarter decisions about infrastructure and optimization.
Conclusion: Improve System Performance with Datadog
By tracking key metrics, Datadog not only streamlines operations but also boosts cloud performance while cutting costs. AI-powered monitoring with Datadog has been shown to lower deployment failures by 50%.
Datadog simplifies monitoring by offering:
-
Centralized Visibility
With over 850 integrations, Datadog consolidates data across your entire technology stack, giving you real-time insights into your infrastructure. -
Proactive Issue Detection
Using AIOps, Datadog connects related events and highlights issues automatically. This reduces alert overload, speeds up response times, and minimizes downtime. -
Better Team Collaboration
Darío Simonassi, Architecture Manager at Mercado Libre, highlights its impact:"Before Datadog, most teams had no idea how changes in their applications might affect others. Now all of the teams have the insight they need to work better together, and it's made each team more accountable."
For small and medium-sized businesses, these tools pave the way for smarter infrastructure monitoring.
To get the most out of these metrics, focus on these steps:
- Set clear KPIs that align with your business goals.
- Create targeted alerts to avoid overwhelming your team with notifications.
- Keep dashboards updated to match your evolving infrastructure.
This approach ensures effective monitoring and quick reactions to issues. With 60% of developers reporting increased productivity thanks to AI-assisted monitoring, Datadog provides a powerful solution for improving system performance and operational efficiency.
FAQs
How does monitoring response times with Datadog enhance application performance and user experience?
Monitoring response times with Datadog helps you identify and fix performance bottlenecks that can slow down your application. By using Datadog's Application Performance Monitoring (APM), you gain detailed insights into how your code performs, including execution times and resource usage. This allows you to pinpoint inefficiencies and optimize your application for better performance.
Datadog also correlates response times with other telemetry data like logs and metrics, making it easier to detect root causes of issues. By resolving these problems quickly, you can improve resource efficiency, reduce downtime, and deliver a smoother, more reliable experience for your users.
How can I set up effective success rate alerts in Datadog to quickly detect system issues without receiving too many notifications?
To set up success rate alerts in Datadog effectively, start by defining a threshold that aligns with your system's performance goals. For example, if your target success rate is 99%, configure the alert to trigger when the rate falls below this value. This ensures you catch potential issues early.
Customize the alert's sensitivity to avoid excessive notifications. Use Datadog's anomaly detection and alert grouping features to focus on meaningful patterns rather than isolated incidents. Additionally, set different notification priorities based on the severity of the issue, so your team can respond appropriately without being overwhelmed.
Regularly review and adjust your alert configurations based on system changes or evolving business needs. This proactive approach helps maintain a balance between catching critical issues and minimizing alert fatigue.
How does Datadog's tagging system help optimize resource usage and manage costs effectively?
Datadog's tagging system allows you to organize and categorize your resources, making it easier to monitor and manage them efficiently. By assigning tags based on factors like environment, function, or team, you can filter and analyze data more effectively. This helps you identify trends, allocate costs accurately, and gain insights into how infrastructure changes impact spending.
Using tags, you can group resources in meaningful ways, which simplifies tracking usage patterns and controlling costs. This approach ensures better visibility into your systems and supports smarter decision-making for resource allocation and budget management.


