5 Steps To Configure Alert Dependencies
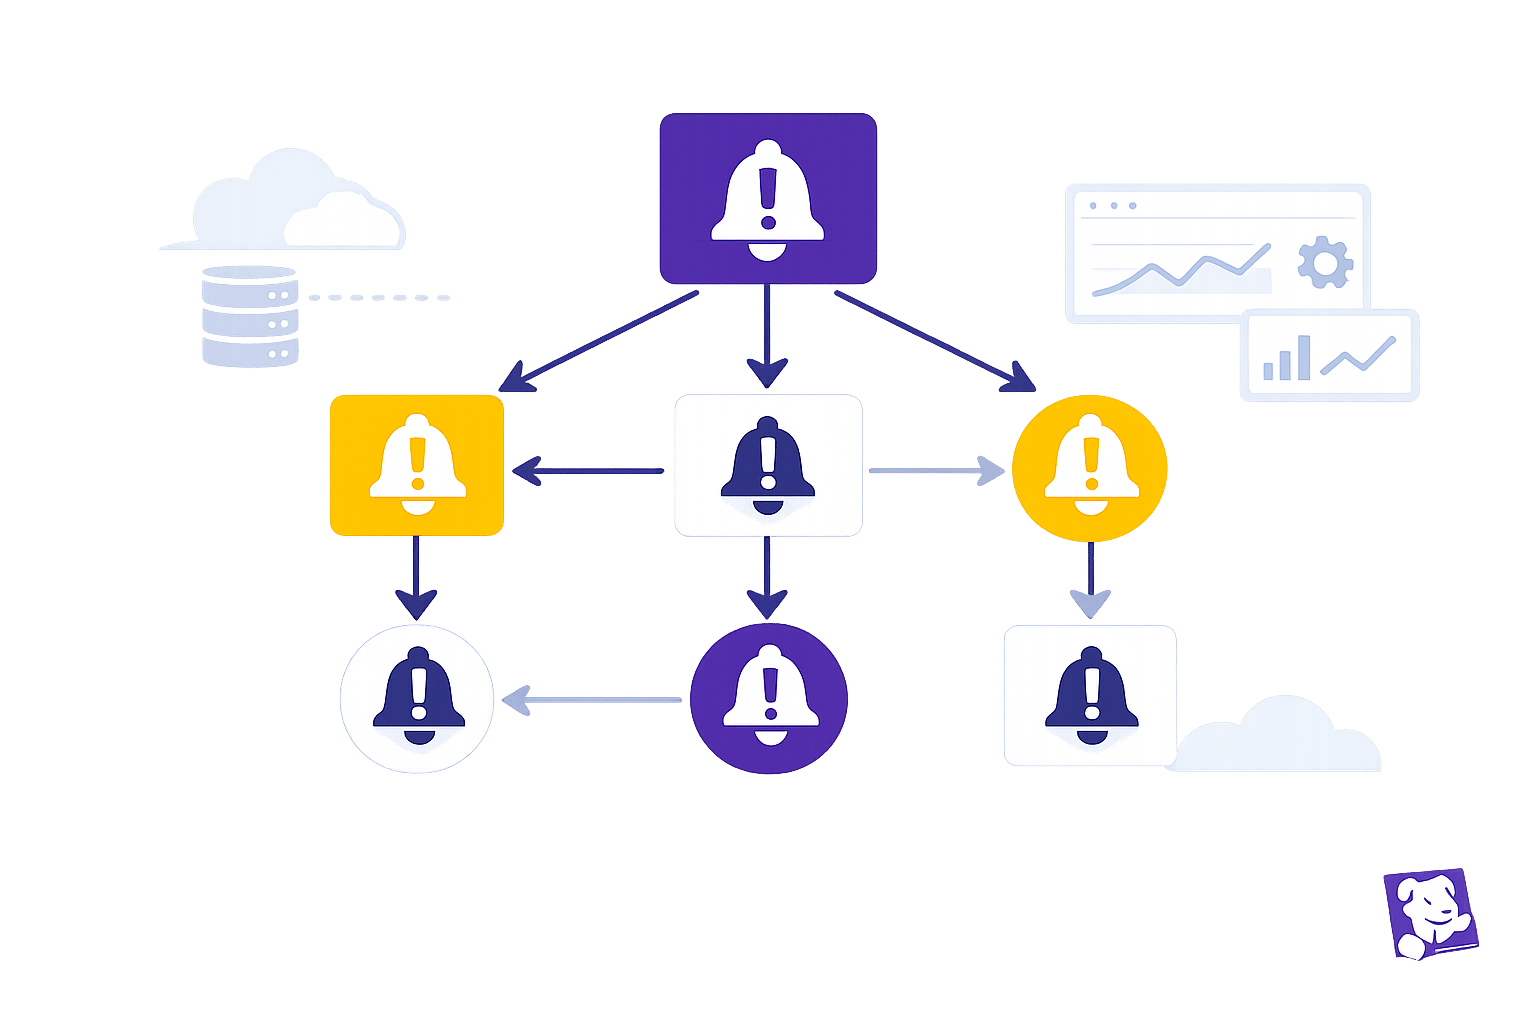
Set up parent-child alert dependencies to mute downstream alerts: identify monitors, add webhooks, call the Downtime API, test simulations, and maintain tags.
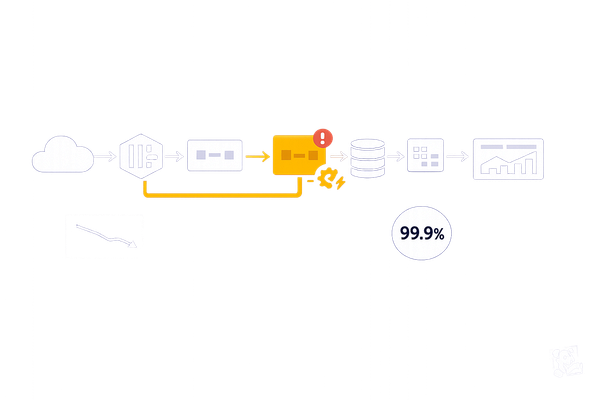
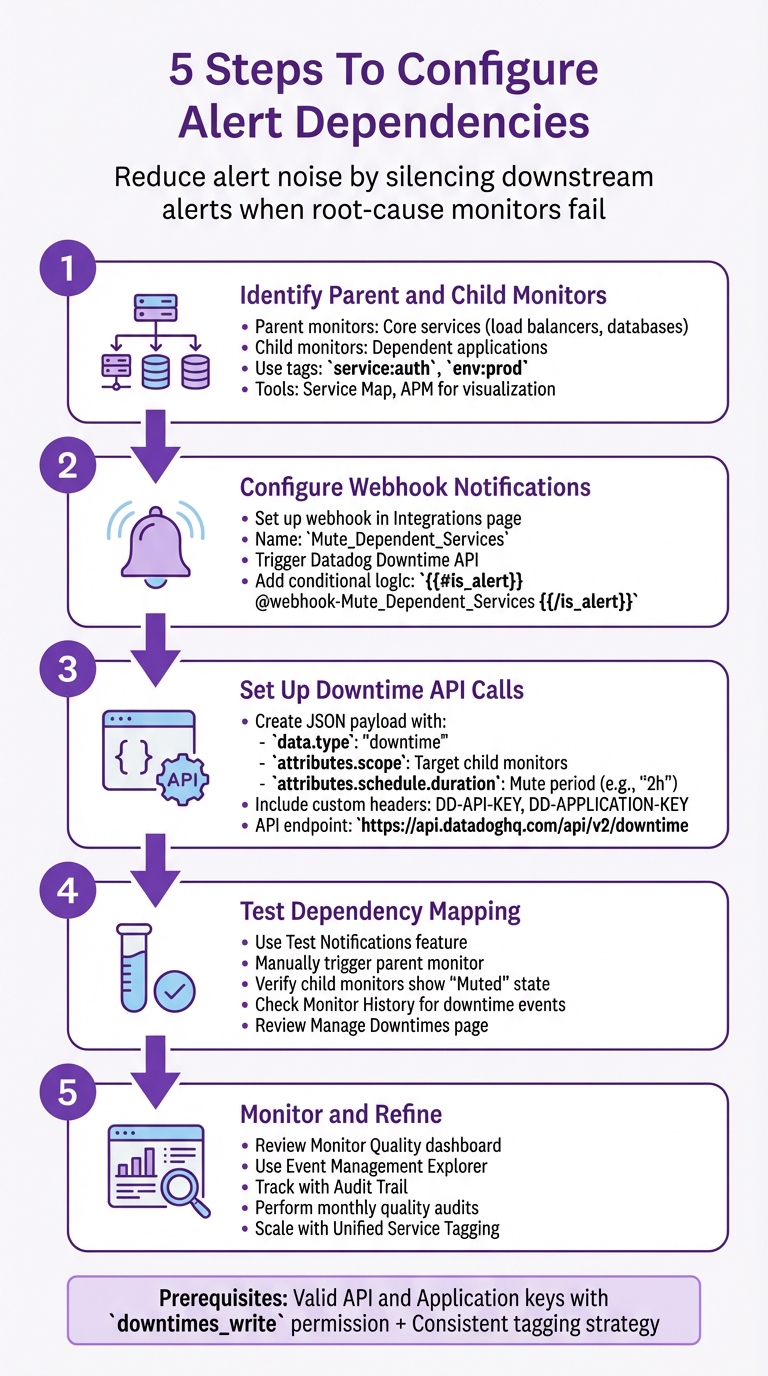
When your infrastructure fails, it can trigger a flood of alerts - overwhelming your team. Configuring alert dependencies in Datadog helps solve this by silencing downstream alerts when a root-cause monitor (parent) fails. This reduces noise, improves focus, and ensures clarity during incidents. Here's how to set it up:
- Identify Parent and Child Monitors: Map your architecture to define which monitors detect root issues (parent) and which track downstream effects (child). Use tags like
service:authorenv:prodfor clarity. - Set Up Webhook Notifications: Configure webhooks in parent monitors to trigger Datadog's Downtime API, muting child alerts during incidents.
- Structure Downtime API Payloads: Create precise JSON payloads to define which monitors to mute and for how long, using tags or monitor IDs.
- Test Your Setup: Simulate alerts to ensure dependencies work as expected. Check monitor history and downtime logs for errors or gaps.
- Monitor and Refine: Regularly review logs, update dependency rules, and ensure tags remain consistent as your infrastructure evolves.
5 Steps to Configure Alert Dependencies in Datadog
I07.1 Datadog Monitors 101: Smarter Alerts, Anomalies & Forecasting Made Easy
Prerequisites for Configuring Alert Dependencies
To successfully set up alert dependencies, you need to have active monitors and the correct API permissions in place. Without these, your dependency rules won't work as intended.
You'll require valid API and Application keys to authenticate webhook calls used for silencing child monitors. These keys must be tied to either a user or service account with the downtimes_write permission enabled. To confirm this, navigate to Organization Settings > Roles and check that your account has "Write" permissions under the Downtimes section. It's a good idea to use a Service Account for consistent operations, especially during role changes.
Additionally, your monitors should adhere to a consistent tagging strategy. Tags like service:auth or env:prod can help you scope downtime rules more effectively across multiple monitors. This tagging approach simplifies the process of defining parent-child relationships and ensures that your API calls are targeting the correct alerts.
Before proceeding, confirm that your monitors are active and your API permissions are correctly configured to avoid any setup issues.
Verify Active Monitors and Notifications
Head to the Manage Monitors page and use filters such as tags, status, or service to assign parent and child roles to your monitors. To ensure everything is functioning as expected, review the Monitor Status page, which provides status graphs and event history for your monitors.
Make sure that notification channels are properly configured and that the Webhook integration is installed. Without these, parent monitors won't be able to communicate with the API to mute child alerts. For additional verification, use the API's withDowntimes parameter set to true to check which monitors are currently suppressed by active downtime schedules.
Check Downtime API Permissions
Go to Organization Settings > Roles to verify that your role includes "Write" permissions for Downtimes or Monitors. The Application key used in webhook payloads must also have these permissions to prevent API call failures.
To confirm your API keys are working correctly, test them by scheduling a downtime. Keep in mind that while downtimes suppress notifications, they don't stop monitors from evaluating data or recording state changes in their history.
Step 1: Identify Parent and Child Monitors
Start by mapping your architecture to understand how your services depend on one another. Parent monitors should focus on core services like load balancers or databases, as these are central to multiple applications. Child monitors, on the other hand, should track dependent applications. For instance, if your authentication service relies on a PostgreSQL database, the database connectivity monitor would act as the parent, while the auth service response time monitor would serve as the child.
To simplify this process, tools like Datadog's Service Map or APM can help you visualize service-to-service relationships. These tools provide a clear view of data flow, reducing the risk of misconfigured dependencies. Additionally, make use of tags to explicitly define these relationships.
Using Query Tags for Dependencies
Tags play a crucial role in mapping dependencies. They allow you to group metrics and target specific sections of your infrastructure when setting up relationships. To keep things consistent, implement a standardized tagging system across all monitors. Use tags like service:<name>, env:<environment>, and team:<name> for clarity. For example, include an env tag such as prod or staging to ensure alerts in testing environments don’t interfere with production notifications.
Query tags make it easier to filter monitors by these standardized tags, ensuring all relevant child monitors are captured. You can use the monitor search UI to filter by service tags when setting up dependencies. With Unified Service Tagging, you can link monitors, traces, and logs across different layers, simplifying the identification of related alerts.
Organizing Alerts by Services
To better manage your monitors, structure them to match your application's hierarchy. Grouping alerts by the service they support makes it easier to spot parent-child relationships. Use the service tag consistently - it’s the key to grouping related alerts in complex setups.
When organizing by service, parent monitors should track shared resources, while child monitors should focus on specific applications that depend on those resources. This approach ensures a clear and manageable alerting structure.
Step 2: Configure Webhook Notifications on Parent Monitors
Once you've mapped your parent and child monitors, the next step is to set up webhooks on the parent monitors. These webhooks will trigger the Datadog Downtime API, ensuring that child alerts are muted whenever a parent monitor fails.
To use a webhook in a monitor, you’ll first need to configure it through the Webhooks integration in Datadog. Head to the Integrations page, search for Webhooks, and click New Webhook under the Configuration tab. Assign a clear and descriptive name to your webhook, such as Mute_Dependent_Services, so its purpose is easy to recognize later. Then, configure the webhook’s payload to include the necessary monitor context, ensuring that only the relevant alerts are impacted.
Adding Custom Webhook Payloads
To instruct the Downtime API to mute specific child monitors, you’ll need to set up a custom JSON payload. In the webhook configuration, enable the Use custom payload option and replace the default structure with valid JSON that incorporates Datadog variables.
For example, you can use variables like $HOSTNAME, $EVENT_TITLE, and $ALERT_STATUS to pass information from the parent monitor to the API. Be sure to include fields like "scope" or "tags" that align with the query tags of your child monitors, ensuring that only the appropriate alerts are muted. To trigger the webhook only for critical alerts, you can use conditional logic like this:
{{#is_alert}} @webhook-Mute_Dependent_Services {{/is_alert}}
Webhook URL and Configuration
The webhook URL is where your notifications will be sent. For managing alert dependencies, point the webhook to the Datadog Downtime API endpoint:
https://api.datadoghq.com/api/v2/downtime
Make sure the URL corresponds to your Datadog site region. For instance, use datadoghq.com for US1 or datadoghq.eu for EU1.
In the webhook configuration, enable custom headers and include the following:
- DD-API-KEY: Your Datadog API key
- DD-APPLICATION-KEY: Your Datadog application key
- Content-Type: Set to
application/json
Once the webhook is saved, reference it in the "Notify your team" section of your parent monitor using the @webhook- handle. Before finalizing, use the Test button to send a sample payload and confirm the webhook is working as expected.
Step 3: Set Up Downtime API Calls in Webhook Payloads
To send downtime requests to the Datadog API, structure your JSON payload according to the JSON API specification. The payload should include a "data" object with "type": "downtime" and an "attributes" object. This setup ensures Datadog knows which child monitors to mute and for how long.
The scope attribute is key here. It’s a required string that specifies which child monitors will be muted. You can define the scope using tags like "service:child-app" or specific monitor IDs such as "monitor_id:12345". Make sure your scope is precise to avoid muting monitors unintentionally. Use the exact query tags you established in Step 1 to keep things targeted.
Defining Scope and Duration
The "schedule" object within the "attributes" section determines the timing for muting child monitors. Use the "duration" field to specify how long the monitors should remain muted after the parent alert triggers. For instance, "1h" mutes for one hour, and "30m" mutes for 30 minutes. Setting a relative duration is safer than using a fixed end time, as it ensures the mute period adapts to when the parent alert occurs.
Here’s an example payload:
{
  "data": {
    "type": "downtime",
    "attributes": {
      "scope": "env:prod,service:core-api",
      "schedule": {
        "duration": "2h"
      },
      "message": "Muted by parent: {{monitor_name}}",
      "mute_first_recovery_notification": true
    }
  }
}
In this example:
- The scope targets production monitors tagged with
service:core-api. - Monitors are muted for two hours.
- Recovery notifications are disabled when the downtime ends.
- The
messagefield uses the Datadog placeholder{{monitor_name}}to automatically include the parent monitor’s name in the audit trail.
| Payload Field | Type | Description | Example |
|---|---|---|---|
data.type |
String | Must be "downtime" for API v2 |
"downtime" |
attributes.scope |
String | Specifies child monitors to mute | "env:prod,service:core-api" |
attributes.schedule |
Object | Contains mute timing details | {"duration": "2h"} |
attributes.message |
String | Adds a description for the downtime audit log | "Muted by parent: {{monitor_name}}" |
attributes.mute_first_recovery_notification |
Boolean | Prevents recovery alerts when downtime ends | true |
Once your payload is ready, it’s time to test it to ensure everything works as expected.
Testing Payload Structure
Start by validating your JSON with a linting tool to catch any syntax errors. Syntax mistakes will cause the downtime creation process to fail.
Next, test your payload using the Monitor UI. When testing, set a short duration like "1m" or "5m" to avoid accidentally muting monitors for too long. Use test-specific tags such as env:test or service:test-webhook to limit the scope to non-production resources.
After triggering the test, check the Monitor History tab. This will show when the webhook was triggered and provide details on any API errors. If your test is successful, you’ll see a new downtime entry in the Downtimes section with the exact scope and duration you configured in the payload.
Step 4: Test Dependency Mapping with Alert Simulations
Before a real incident occurs, it's essential to test your dependency setup. This ensures that when parent monitors trigger, they successfully mute child monitors, reducing unnecessary alert noise. Datadog provides built-in tools to help you perform these tests effectively.
Using Datadog's Test Features
Datadog's Test Notifications feature in the monitor editor allows you to simulate an alert without needing an actual metric breach. Simply click the "Test" button to send a sample alert. This triggers your webhook and verifies that the JSON payload is correctly sent to the Downtime API. It's a great way to catch syntax errors or configuration issues early.
For a more hands-on test, manually trigger your parent monitor by temporarily lowering its threshold. While the parent monitor is in an alert state, check the status page of the child monitor. It should display a "Muted" state, marked by a purple downtime indicator.
During this process, you should observe "Downtime started" and "Downtime ended" events that align with the parent alert's timing. However, if you see "Notification Failed" events, it likely indicates an issue with your webhook's payload structure or API permissions, which you'll need to fix.
Analyzing Monitor History
The History tab on a monitor's status page provides a detailed timeline of all state changes. Focus on the parent monitor's "Alert" period and compare it to the child monitor's timeline during the simulation. The child monitor should remain in a "Muted" state for the entire duration of the parent monitor's alert.
Ensure no notifications were sent from the child monitor during the mute period. If any alerts slipped through, it might mean the downtime scope in your webhook payload doesn't match the tags applied to your child monitor. Double-check for errors in tag names, such as using env:prod instead of environment:prod.
To further validate, visit the Manage Downtimes page. Confirm that the downtime was created with the correct scope and duration. If adjustments are needed, update the scope and duration fields in your webhook payload. This process ensures that your dependency mapping is functioning as intended and effectively silencing redundant alerts.
Step 5: Monitor and Refine Dependency Rules
Dependency rules aren't static - they're live and need constant attention. Service architectures change over time, so keeping these rules updated is crucial. Regular monitoring ensures that your dependencies reduce unnecessary noise without hiding critical alerts.
Reviewing Alert Logs
Once your tests are successful, reviewing logs should become a routine task to validate how well your dependencies are working. Start by using the Monitor Quality dashboard. This tool is great for spotting issues, as it tracks signal-to-noise ratios and flags monitors that generate too many notifications. If you notice a child monitor on this list even though it has a parent dependency set up, it could mean your downtime scope is too small, or your tags aren’t properly aligned.
The Event Management Explorer is another essential tool. It allows you to search and filter all triggered alerts and suppressed notifications in one place. Pay attention to patterns where child monitors are still sending alerts while their parent monitor is already in a CRITICAL state. This usually points to a gap in your suppression logic.
Also, keep an eye out for flapping alerts - these indicate thresholds that might be set too tightly or re-notification delays that need tweaking. Use the Audit Trail to track any configuration changes, like removed tags or altered webhook payloads, that might have disrupted your dependencies.
Scaling Dependency Rules for Growth
As your infrastructure grows, managing dependencies manually becomes a headache. That’s where Unified Service Tagging comes in handy. By applying consistent tags across all monitors, you can ensure new resources automatically adhere to existing dependency rules without extra effort.
Another time-saver is Monitor Templates, which allow you to enforce consistent dependency logic across all your monitors with a single update. This is especially helpful when scaling from a few services to a much larger setup.
Don’t overlook Watchdog Insights, a feature designed to catch anomalies in alert patterns. If a dependency rule is too broad and suppressing important alerts, or too narrow and missing key triggers, Watchdog can flag these issues before they become a problem. Performing monthly quality audits is a smart way to address configuration drift and ensure your dependencies still match your service relationships.
Conclusion and Best Practices
Setting up alert dependencies in Datadog can help cut down on unnecessary noise by silencing redundant alerts through parent-child relationships. By defining roles, configuring webhook notifications, and using the Downtime API, you can streamline your alert management process and align it with your overall monitoring strategy in Datadog.
Avoiding Over-Muting
A common pitfall with dependency rules is unintentionally silencing critical alerts. As Datadog experts advise:
"Shrinking an overly broad rule after alerts start spamming multiple teams is much harder than widening a precise rule."
To avoid this, start with a narrow scope by using tags like priority:P0 and env:prod. Once you're confident the routing logic is working as intended, you can gradually expand the scope. This approach ensures that high-priority alerts are directed to the right teams, while less urgent ones are handled through less disruptive channels. Clear ownership of each dependency rule is essential to prevent alerts from being overlooked as your infrastructure scales.
Grouping Monitors by Tags
A consistent tagging strategy is crucial for managing alert dependencies effectively. As noted by Datadog experts:
"A solid tagging strategy is the gateway to effective alert routing."
Use unified service tagging with tags like env, service, and version across all monitors. This allows you to create tag-based scopes (e.g., scope: "service:auth-api") instead of relying on hardcoded monitor IDs. By doing so, new monitors are automatically included in your dependency logic. Making tags such as team and service mandatory ensures notification rules are applied seamlessly as your infrastructure grows.
Integrating with SMB Workflows
Integrating alert dependency practices into your SMB workflows can enhance incident management efficiency. Transitioning from manual @notifications to centralized, tag-driven notification rules can reduce mean time to resolution (MTTR). By routing incidents directly to their owners instead of a general team, you minimize delays. Replace complex monitor message logic with centralized notification rules to reduce misconfigurations and simplify upkeep.
Start with high-level dependencies, such as load balancers or database clusters, before mapping out application-specific relationships. Always test your setup with simulations before deploying it to production. As your environment evolves, regular quality audits are key to catching configuration drift and ensuring your dependency rules align with actual service relationships.
FAQs
How can I make sure my API keys have the right permissions to set up alert dependencies in Datadog?
To make sure your API keys are correctly set up for managing alert dependencies in Datadog, follow these steps:
- Go to your Datadog account settings and open the API & Application Keys section.
- Confirm that the API key you want to use is active and hasn’t been revoked.
- Check that the Application key has the
monitor_writescope (and optionallymonitor_read). This scope is necessary for creating and managing alert dependencies. - Ensure the key is linked to a role with Manage Monitors permission, as roles define what actions the key can perform.
- Test the key by making a basic API call or setting up an alert dependency in the UI to verify it has the right permissions.
If the key lacks the required scopes or role, update the Application key or modify the assigned role to include the monitor_write permission. This will help you avoid permission issues during setup and management of alert dependencies.
What are the best practices for creating and maintaining a consistent tagging strategy in Datadog?
To keep your tagging strategy in Datadog consistent, start by establishing clear and enforceable rules. Stick to a simple, lowercase key-value format like env:prod, team:frontend, or service:web. Apply these tags consistently across all integrations, the Datadog Agent, and infrastructure-as-code pipelines. Avoid using spaces or special characters, and keep the number of tags per host manageable to ensure queries remain fast. Hierarchical keys, such as team:frontend and team:backend, can simplify grouping and filtering.
Automating tag assignment is another crucial step. Leverage Datadog’s integration settings, cloud-provider auto-tagging features, and tools like Terraform to assign tags during the provisioning process. Maintain a centralized “tag dictionary,” such as a version-controlled YAML file, to keep track of approved keys and values. Regular audits can help you identify inconsistencies or unused tags, keeping your system organized.
Incorporate tags into your monitoring workflows to get the most out of them. Use tags to scope alerts, build dashboards tailored to specific environments, and generate cost reports. A consistent tagging strategy not only enhances alert accuracy but also cuts down on noise, helping small and medium-sized businesses scale their operations and fine-tune their monitoring setup.
How can I verify that my alert dependency setup is working as expected?
Datadog's documentation offers instructions for setting up and configuring alert dependencies, but it doesn’t outline exact steps for testing these configurations. To verify that your setup functions as expected, try simulating alert conditions and observing how dependencies behave through your monitoring dashboards. If you’re uncertain about any part of the process, contacting Datadog support can help you confirm that everything is set up correctly. For more detailed instructions, check out the full Datadog documentation or get in touch with their support team for additional help.