A Beginner's Guide to Using Datadog Effectively
Learn how to effectively monitor your infrastructure and optimize performance using a comprehensive platform for alerts, dashboards, and resource management.
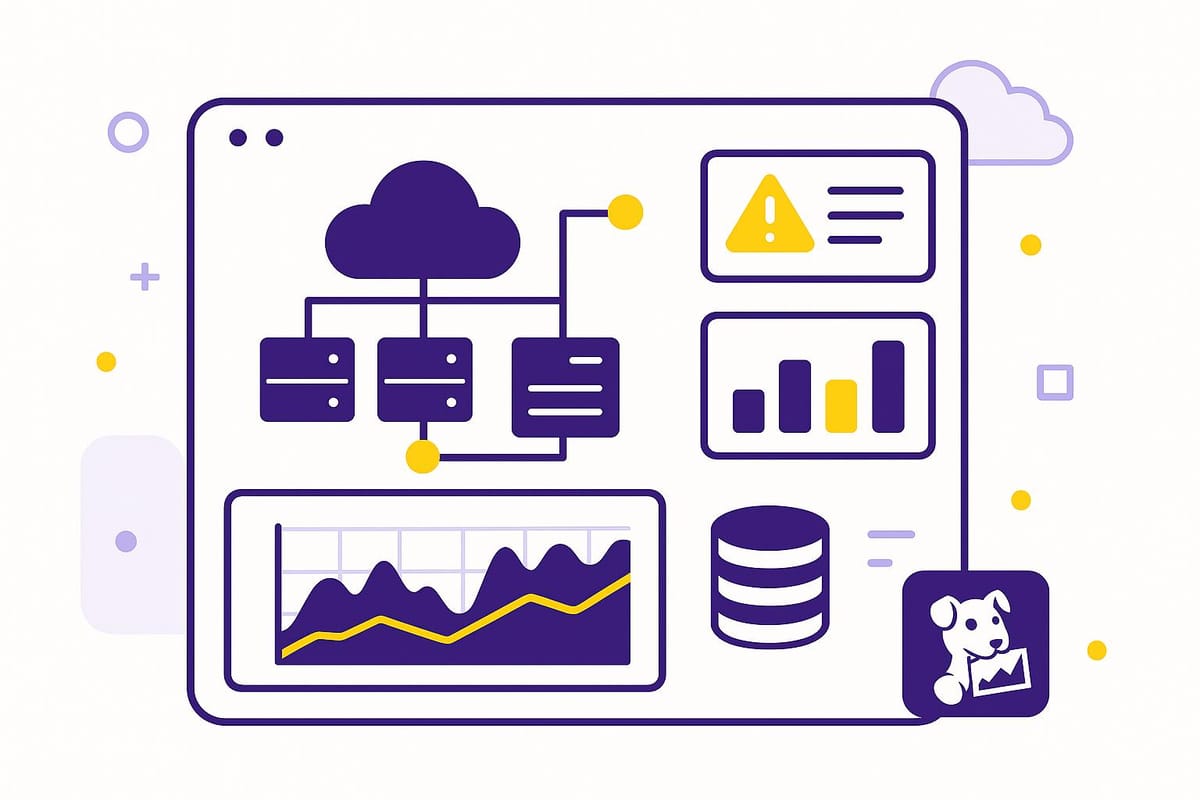
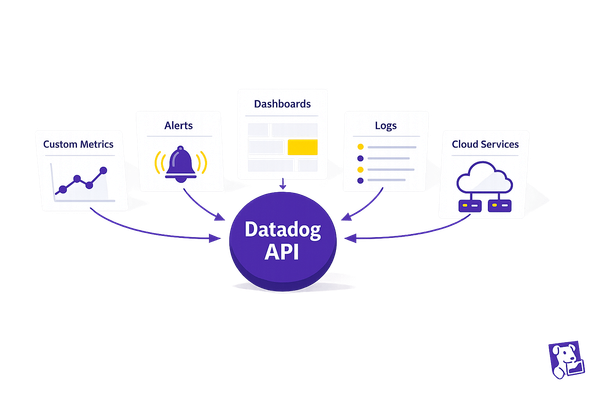
Datadog is your all-in-one platform for infrastructure monitoring, application performance tracking, log management, and security. Whether you're a small business or a large enterprise, it helps you detect and fix issues before they impact operations. Here's what you'll learn:
-
Why Datadog?
It integrates with major cloud providers (AWS, Azure, Google Cloud) and offers real-time dashboards, AI-driven analysis, and automated alerts. -
Key Benefits for SMBs:
- Track costs and resource usage.
- Replace multiple tools with one platform.
- Get instant alerts for critical issues.
-
How to Get Started:
- Sign up for a free trial.
- Install the Datadog Agent on your systems.
- Connect your cloud services for seamless monitoring.
-
Create Dashboards:
Build custom visualizations for CPU usage, memory, error rates, and more. -
Manage Alerts:
Set up efficient alerts to avoid unnecessary noise and focus on real issues. -
Optimize Performance:
Use Datadog's tools to analyze metrics, reduce downtime, and improve efficiency.
Datadog starts at $15 per host/month, with a 14-day free trial for up to five hosts. Ready to streamline your monitoring? Let’s dive in.
Datadog 101 Course | Datadog Tutorial for Beginners | SRE ...
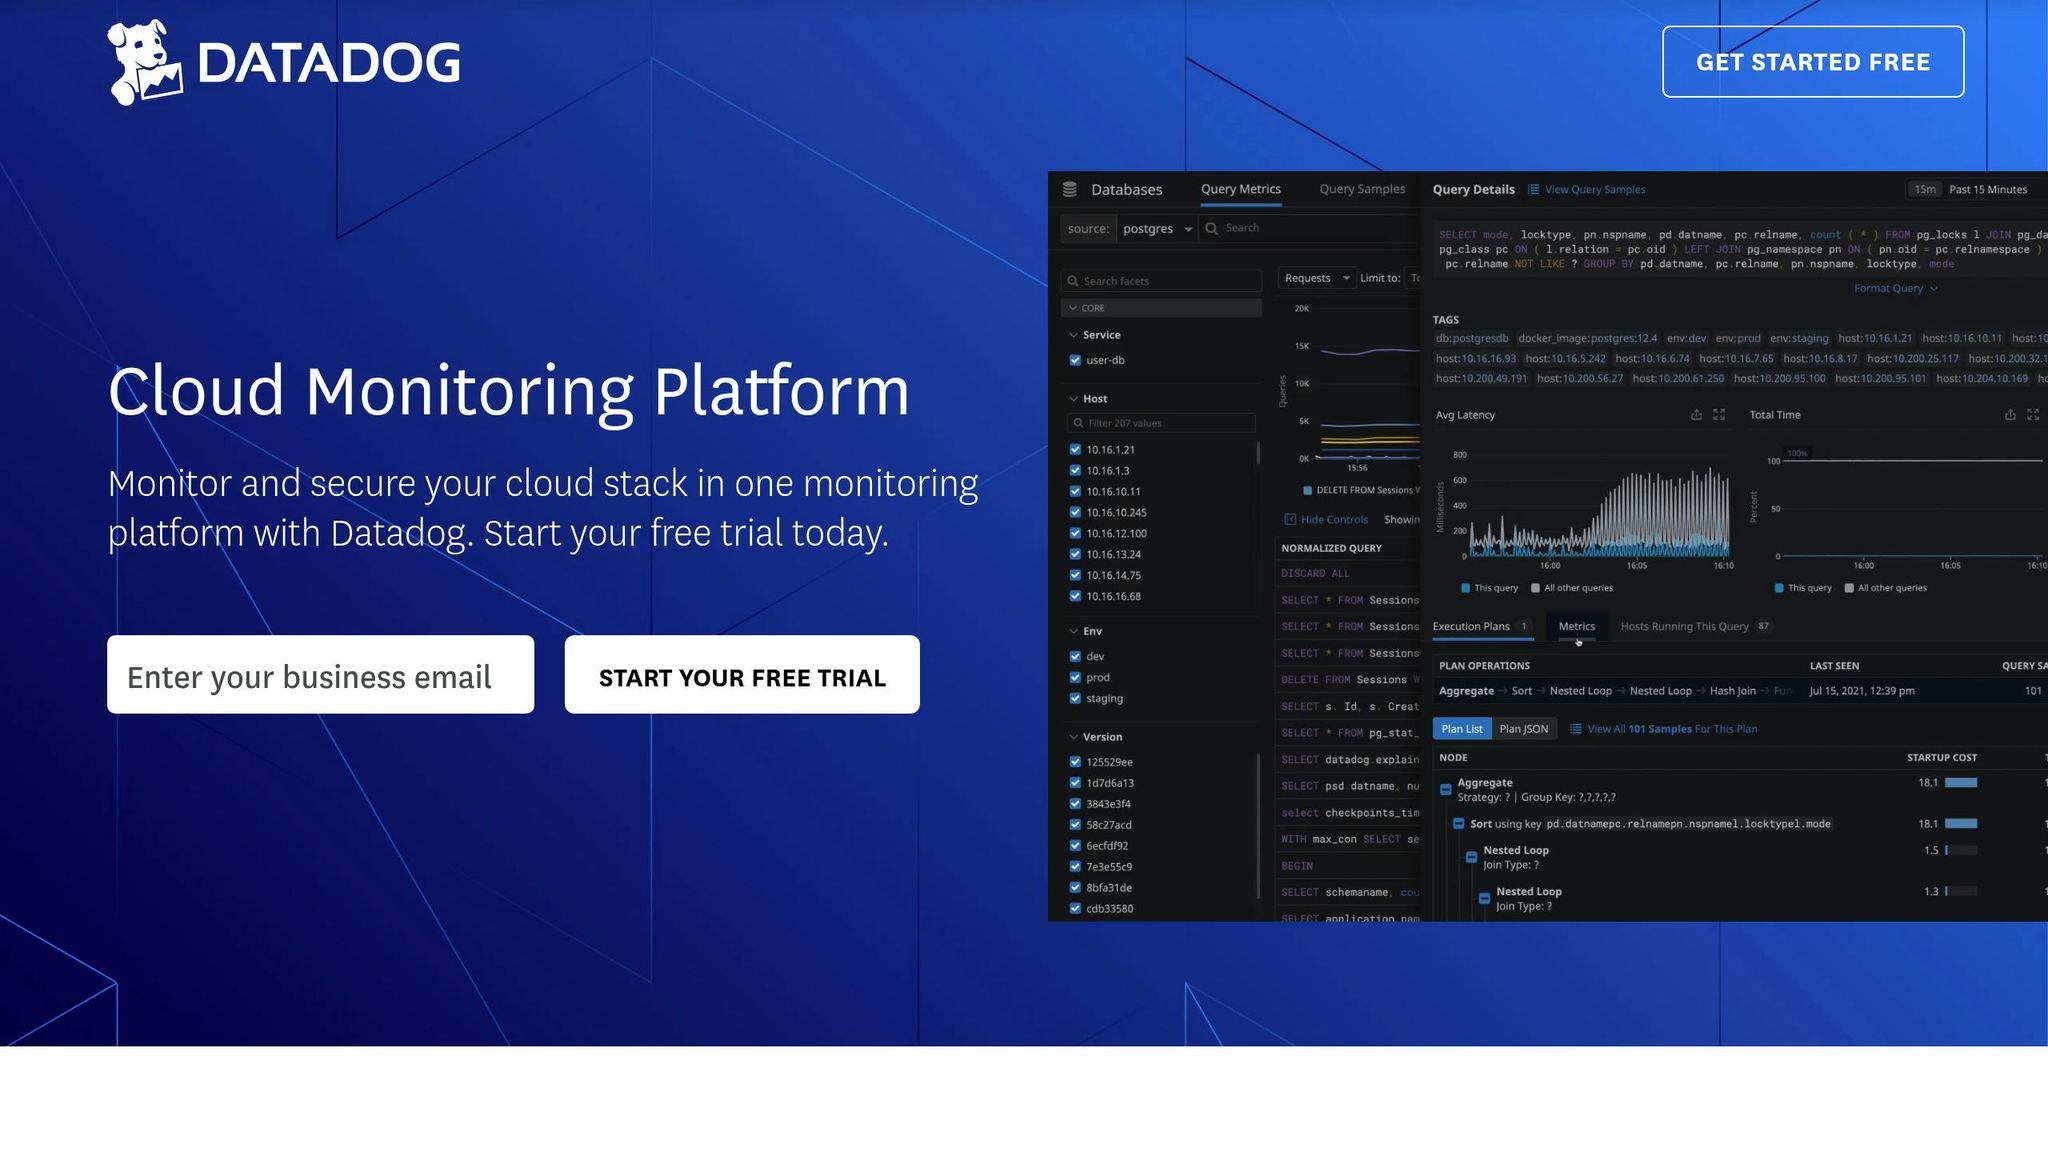
Setup Steps
Getting started with Datadog involves configuring your account and integrating it with your systems. Follow these steps to access and use all of Datadog's features.
Account Setup
Here’s how to set up your Datadog account:
- Go to Datadog's website and click the "Free Trial" button.
- Provide your business email and organization details.
- Under your username, find the "Keys" section. Here, you'll locate:
- API key: Used for authenticating agent installations.
- Application key: Needed for API access and integrations.
Agent Installation
The installation process depends on your platform but is simple to follow.
| Operating System | Installation Method | Features |
|---|---|---|
| Linux (Ubuntu/Debian) | APT (Package Manager) | System metrics, process monitoring |
| Windows | MSI Installer | Performance counters, event logs |
| macOS | Shell Script | Host metrics, container monitoring |
| Cloud Platforms | Provider-Specific Tools | Auto-scaling, cloud metrics |
For large-scale deployments, tools like Ansible or Chef can automate the process. These tools ensure consistent configurations and make updates easier across multiple systems. Once the Agent is installed, you can connect it to your cloud services for extended monitoring.
Cloud Service Setup
Linking your cloud services to Datadog allows you to monitor your entire infrastructure. Datadog supports major cloud providers and offers tailored integrations for each.
To set up cloud integration:
- Open the Integrations page in your Datadog dashboard.
- Choose your cloud provider and follow the authentication steps.
- Configure which metrics and logs to collect.
Make sure Datadog has the necessary permissions within your cloud environment. This ensures accurate data collection while maintaining security.
Dashboard Creation
Once integrations are set up, your data can be visualized through custom dashboards. These dashboards help monitor key metrics and inform decision-making. Here's how to create and structure them effectively.
Basic Dashboard Setup
Follow these steps to build your first monitoring dashboard:
- Navigate to Dashboards in the main menu and click New Dashboard.
- Choose a layout template that suits your monitoring goals.
- Click Add Widget to add widgets to your dashboard.
- Configure each widget to display specific metrics.
For monitoring essentials, consider starting with these key metrics:
| Widget Type | Metric to Monitor | Purpose |
|---|---|---|
| Time Series | CPU Usage | Monitor processor utilization trends |
| Gauge | Memory Utilization | Check current RAM consumption |
| Query Value | Error Rate | Keep an eye on the percentage of failed requests |
| Graph | Request Latency | Analyze response time patterns |
| Number | Throughput | Track the number of requests processed per second |
Dashboard Organization Tips
A well-organized dashboard improves readability and usability. Here are some tips:
- Group Related Metrics: Keep widgets for similar metrics (e.g., infrastructure vs. application) together for better clarity.
- Consistent Color Scheme: Use uniform colors - red for errors, yellow for warnings, green for healthy states - to make it easier to interpret data at a glance.
- Limit Widgets: Avoid overcrowding your dashboard; only include widgets that provide actionable insights.
Cost Tracking Dashboards
Studies show that over 65% of containers use less than half of their requested resources. This highlights room for cost savings through better resource management.
Key Cost Metrics to Monitor:
1. Resource Efficiency
Monitor CPU utilization trends. For example, between 2023 and 2024, the median CPU utilization for Datadog customers running Kubernetes workloads dropped from 16.33% to 15.9%. Regular monitoring can help identify underused resources.
2. Workload Optimization
Use the Workload panel to detect and adjust over-provisioned resources, ensuring they are right-sized.
3. Cluster Performance
The Cluster Scaling overview helps track node scaling and efficiency, maintaining performance while controlling costs.
To create a cost-focused dashboard, include:
- Trends in resource utilization
- Costs of idle resources
- Metrics for workload efficiency
- Scaling events and their financial impact
This approach helps businesses, especially SMBs, better manage resources and reduce unnecessary expenses with Datadog.
Alert Management
Once your dashboards are in place, the next step is to ensure alerts are managed efficiently.
Monitor Setup
Start by setting up a monitor to keep an eye on key metrics.
Go to Monitors > New Monitor, choose the 'Metric' type, select system.cpu.user, and define an alert threshold (e.g., 80% CPU usage).
Set the conditions for triggering alerts:
- Evaluation window: How long the condition must persist before triggering.
- Alert threshold: The point at which a notification is sent.
- Recovery threshold: The level signaling the issue is resolved.
Craft clear and actionable alert messages that include:
- A short description of the problem.
- The potential impact on operations.
- Suggested steps to address the issue.
- Links to relevant documentation or resources.
Alert Delivery Options
Match alert channels to the urgency of the situation. For critical alerts, use multiple channels like phone calls, emails, and Slack to ensure immediate attention. For less urgent alerts, a single channel may suffice. This tiered approach helps prioritize responses effectively.
Reducing Alert Noise
Too many alerts - especially irrelevant ones - can overwhelm teams and make it harder to spot real problems.
Here’s how to cut down on unnecessary alerts:
-
Dynamic Thresholds
Use historical data to set thresholds that adjust automatically. You can also differentiate thresholds for peak hours and off-hours. -
Group Related Alerts
Combine similar alerts to avoid a flood of notifications. Group them by service, tag, or environment to make them easier to manage. -
Smart Downtimes
Schedule maintenance windows to mute alerts automatically during planned work. Tools like Datadog can also silence alerts when resources are shut down.
For example, one company reduced 4,000 alerts from a single network error into just one notification, speeding up the resolution process.
Regularly review alert patterns to improve your strategy and keep your system running smoothly.
Performance Analysis
Metric Analysis
Track key performance indicators across your infrastructure, applications, and user experience to assess system health. Monitor query performance on hosts to evaluate execution frequency and timing. Datadog retains these metrics at full granularity for three months, providing a detailed historical view.
For database performance, leverage Database Monitoring (DBM) Recommendations to identify critical issues. The system automatically ranks findings by severity, allowing you to prioritize high-impact problems. Focus on:
- Query execution patterns
- Resource usage trends
- Response time fluctuations
- System bottlenecks
These metrics reveal performance gaps that, when addressed, can improve system efficiency. Use these insights to guide targeted optimizations.
System Improvements
Turn performance data into actionable changes. Peloton's approach is a great example - they reduced response times by 80-90% by focusing on their top five problematic endpoints.
Here’s how you can achieve similar results:
1. Identify Resource Bottlenecks
Analyze the relationship between normalized queries and host metrics to locate the root cause of issues. This could point to database queries, application code, or infrastructure constraints.
2. Optimize Query Performance
Examine query execution plans and add indexes where needed. For instance, if a long-running query consumes a large share of execution time, Datadog flags it as high-severity, making it easier to prioritize fixes.
3. Monitor Application Performance
"Datadog APM enables our developers to see the entire path from our iOS and Android clients all the way down to services they have built".
Regular System Reviews
To maintain performance, establish a routine review process. As Zach McCormick, Engineering Manager at Braze, explains:
"When debugging performance problems across billions of emails and push notifications, we need access to all live tracing data. Datadog's tracing tools have been invaluable for troubleshooting".
Implement a structured review schedule:
- Daily: Monitor critical metrics and address active alerts.
- Weekly: Review trends and respond to new patterns.
- Monthly: Conduct system-wide evaluations and apply optimizations.
Set up automated alerts for key query metrics. Use clear visualizations and SLOs to measure progress and support ongoing improvements.
Usage Tips
Tags and Automation
Tagging helps keep your data organized. Datadog automatically pulls tags from platforms like AWS and Kubernetes, making it easier to identify hosts and services.
Here are some helpful tagging practices:
- Environment Separation: Use the
envtag to differentiate between development, staging, and production environments for easier filtering. - Geographic Organization: Tag data centers (e.g.,
datacenter: us1.prod,datacenter: us2.prod) to simplify regional monitoring. - Service Classification: Add business-related tags to group services by function or team ownership, making alert routing more efficient.
Good tagging practices improve collaboration and ensure clarity across teams.
Team Communication
Datadog Teams makes it easier for teams to collaborate by providing clear visibility into who owns what resources. This eliminates confusion about responsibilities.
To improve teamwork:
- Resource Organization: Use Datadog Teams to assign ownership of services in the Service Catalog.
- Alert Routing: Set up tags to direct notifications to the right people or teams, such as:
notification: ops-slackoncall: database-teamescalation: security-leads
"Datadog Teams enables individual teams to quickly access and focus on precisely the data they need by facilitating scoped visibility".
Clear communication paired with proper documentation ensures teams can act quickly and effectively.
Documentation Methods
Documenting your Datadog setup is key to standardizing monitoring processes. The Service Catalog acts as a central hub for service-related information.
What to document:
- Service Definitions: Outline each service's purpose, scope, owning team, key metrics, alert thresholds, and response steps.
- Team Resources: Keep contacts, repository links, and runbooks in a shared knowledge base.
Summary
Main Points
Datadog brings together system monitoring and performance optimization in one platform. Here's how to get started:
- Track CPU and memory usage to identify underutilized resources and lower expenses.
- Build real-time dashboards to keep an eye on server health.
- Set up conditional, multi-point alerts to minimize alert fatigue.
These foundational practices pave the way for more advanced strategies.
Future Steps
Take your optimization efforts further with these methods:
Cost Management Tips:
- Use AWS Private Link to slash AWS egress fees by as much as 90%.
- Store historical data affordably with Flex Logs at just $0.05 per million events.
- Add exclusion filters to skip indexing logs you don’t need.
Boosting Performance:
- Broaden your monitoring scope by adding APM (Application Performance Monitoring) and RUM (Real User Monitoring) services.
- Incorporate OpenTelemetry for adaptable instrumentation.
- Tap into Datadog's 850+ integrations to automate metric collection.
FAQs
How does Datadog work with cloud providers like AWS and GCP, and what are the key benefits of these integrations?
Datadog seamlessly integrates with leading cloud providers such as Amazon Web Services (AWS) and Google Cloud Platform (GCP) to help you monitor and optimize your infrastructure and applications. These integrations allow you to collect and analyze metrics, logs, and events directly from cloud services, providing a unified view of your systems.
For AWS, Datadog uses a CloudFormation template to set up an IAM role and policy for secure data collection. This integration includes pre-built dashboards for AWS services and supports deeper insights by deploying the Datadog Agent on EC2 instances or containers.
With GCP, Datadog connects via service accounts to gather metrics from Google Compute Engine (GCE) and other GCP services. It automatically tags resources and provides real-time visibility into your cloud environment, simplifying performance monitoring and troubleshooting.
These integrations help you centralize monitoring across platforms, reduce troubleshooting time, and make data-driven decisions to optimize performance.
How can I set up effective alerts in Datadog to minimize noise while ensuring critical issues are addressed quickly?
To set up effective alerts in Datadog, focus on minimizing unnecessary notifications while ensuring critical issues are addressed promptly. Here are some key tips:
- Alert on symptoms, not causes: Design alerts to monitor user-facing issues, like slow response times, instead of potential root causes. This ensures you catch real problems that impact performance.
- Adjust evaluation windows: Increase the evaluation window to analyze more data points, reducing false positives and unnecessary alerts.
- Set recovery thresholds: Use recovery thresholds to confirm issues are resolved, avoiding repetitive "flappy" alerts.
- Group notifications: Consolidate alerts by grouping them by service or environment to reduce redundant notifications and streamline workflows.
- Write clear messages: Use concise, descriptive titles and messages that help teams quickly understand the issue and take action.
By following these practices, you can create a more efficient alerting system that keeps your team focused on what matters most.
How can small and medium-sized businesses use Datadog to optimize resources and reduce costs?
Small and medium-sized businesses can optimize resources and reduce costs with Datadog by following a few key strategies:
- Filter unnecessary data: Minimize the volume of logs sent to Datadog by excluding non-critical logs and reducing log verbosity.
- Adjust retention policies: Set log retention periods based on compliance and business needs to avoid storing data longer than necessary.
- Optimize custom metrics: Carefully manage custom metrics and use tags and filters to streamline monitoring.
- Leverage built-in tools: Use Datadog's anomaly detection and alerting features to focus on meaningful insights and reduce noise.
By implementing these strategies, businesses can better control costs while gaining valuable insights to improve system performance.

