Anomaly Detection in Datadog: Setup Guide
Learn how to set up and optimize anomaly detection in Datadog to reduce false alerts and enhance response times for your SMB.
Anomaly detection in Datadog helps identify unusual patterns in your infrastructure metrics using machine learning, reducing false alerts and improving response times. This guide explains how to set up and fine-tune anomaly detection for small and medium-sized businesses (SMBs). Here's what you'll learn:
- Why anomaly detection matters: Quickly detect unusual trends without relying on fixed thresholds.
- Steps to get started: Set up your Datadog account, install the Agent, and ensure proper tagging for better insights.
- Key setup tips:
- Collect at least 3-6 cycles of historical data for accuracy.
- Choose the right algorithm: Basic, Agile, or Robust, based on your metrics.
- Configure detection parameters like bounds, alert windows, and thresholds.
- Improve alerts: Use tags for targeted notifications, integrate with tools like Slack or PagerDuty, and reduce false positives by refining thresholds and reviewing historical alerts.
How-to: Build sophisticated alerts with Datadog machine learning
Setting Up Your Environment for Anomaly Detection
To get started with anomaly detection, it’s crucial to configure your Datadog environment properly and ensure sufficient data collection. This setup helps your monitors accurately identify real anomalies and reduces the chances of false alerts. The first steps include setting up your account and installing the Datadog Agent to begin gathering data.
Datadog Account and Agent Installation
Before diving into anomaly detection, you need an active Datadog account and the Datadog Agent installed across your infrastructure. The Agent is responsible for collecting metrics from your hosts, containers, and applications.
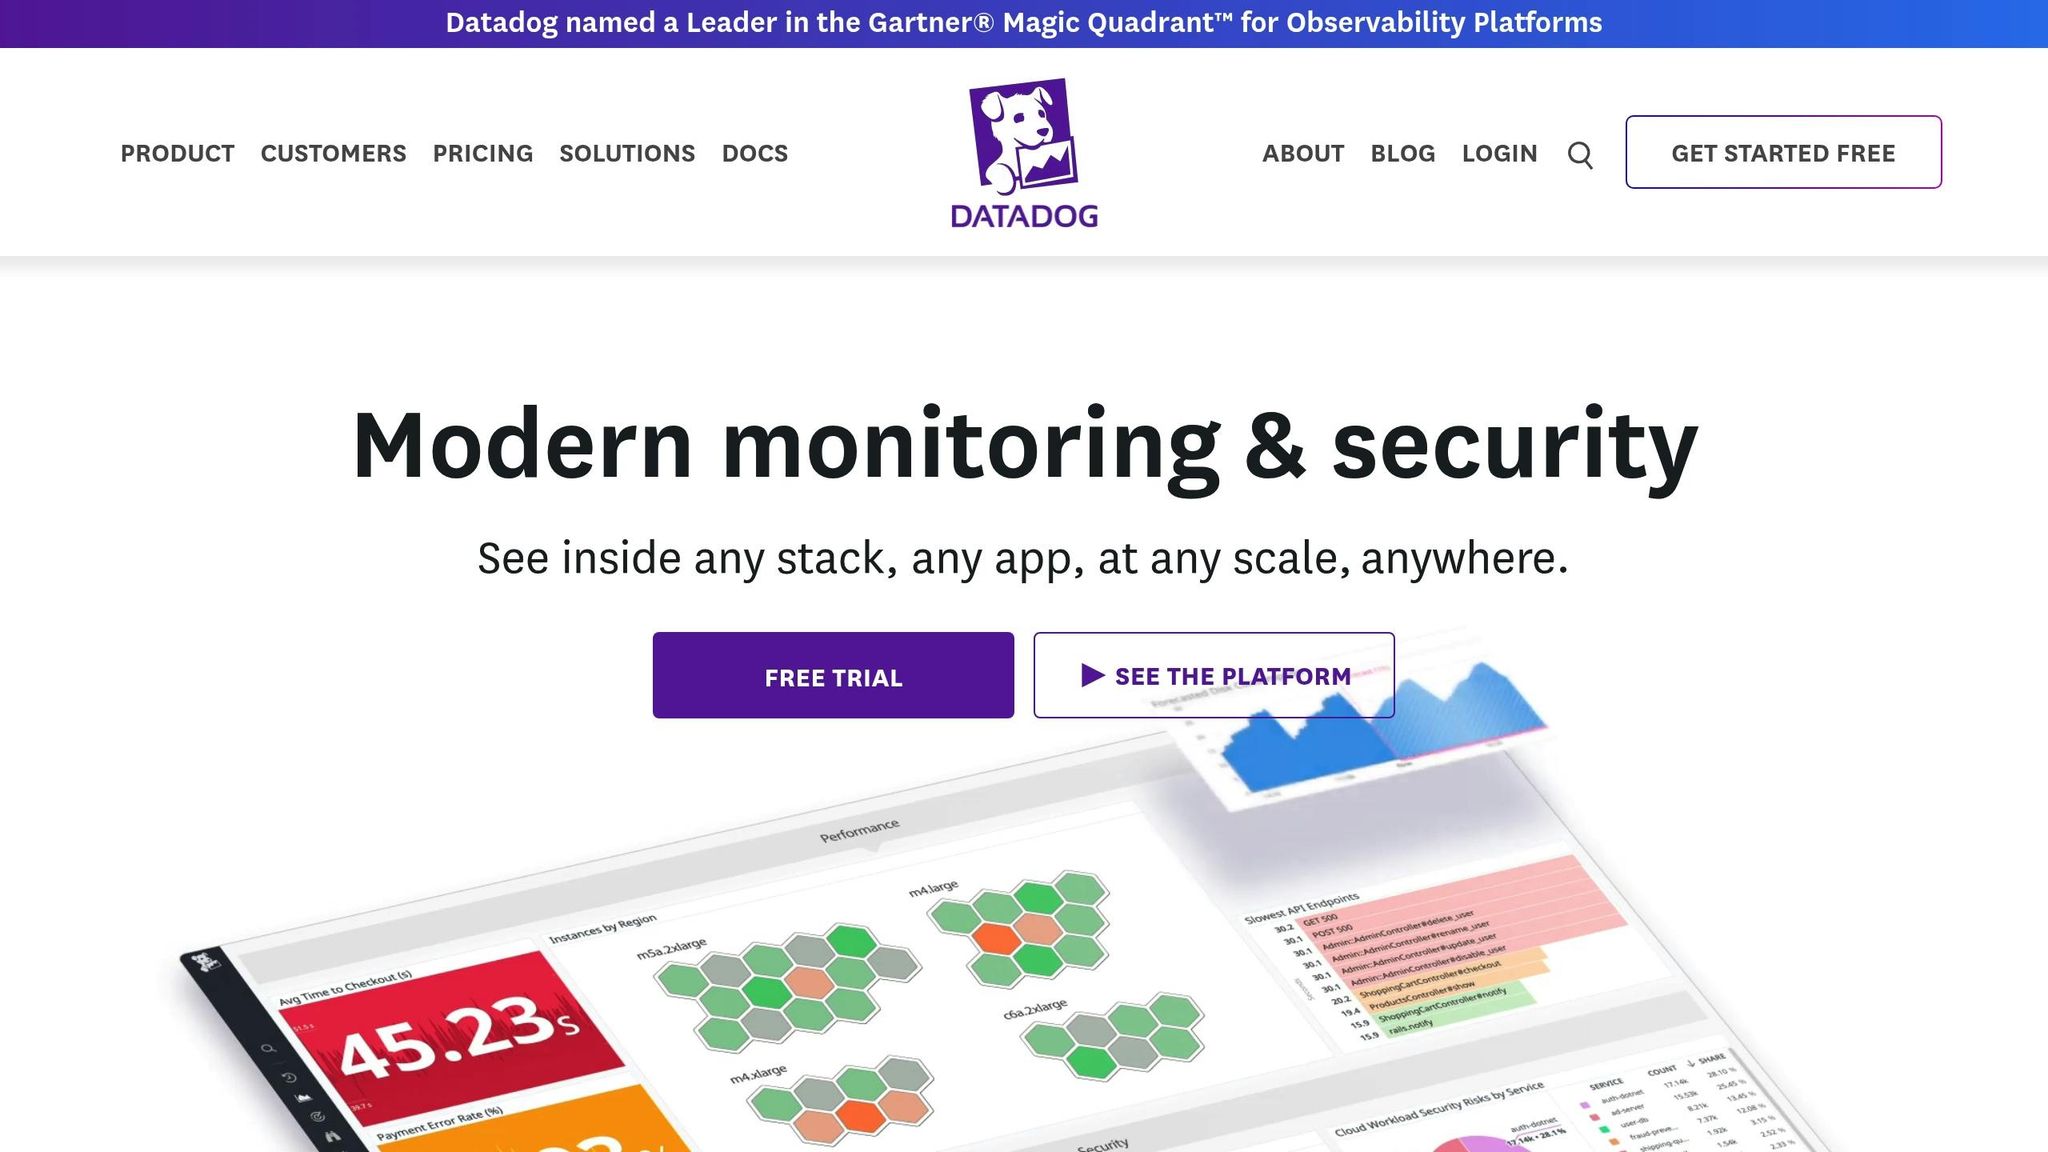
To create your Datadog account, visit datadoghq.com and click "GET STARTED FREE." Register your organization and activate your subscription. Once logged in, navigate to the "Keys" section under your user profile to retrieve your API and Application keys - these are essential for configuring the Agent and enabling programmatic interactions.
Installing the Agent depends on your platform, and Datadog provides detailed instructions in its documentation. After deploying the Agent on your servers, verify the installation by running datadog-agent status. This command confirms that the Agent is collecting data and successfully communicating with Datadog’s servers, whether your infrastructure is on-premises or in the cloud.
To manage access, use Datadog’s role-based access control (RBAC). Assign roles based on the principle of least privilege, ensuring team members can create and manage monitors without unnecessary administrative permissions. Once roles are in place, tagging becomes essential for organizing your data effectively.
Tags are key to organizing metrics for precise anomaly detection. By tagging data based on services, environments, or business units, you can create highly targeted monitors. Organizations that implement thorough tagging strategies report a 30% improvement in visibility into application performance, making it easier to detect and address anomalies.
Collecting Enough Historical Data
Anomaly detection relies heavily on historical data to establish baselines and differentiate between normal patterns and actual anomalies. Without enough historical context, monitors may produce inconsistent results or trigger excessive false alerts .
For metrics with seasonal trends - like daily traffic spikes or weekly usage cycles - collect at least three to six full cycles of data. For example, aim for at least three weeks of data to cover weekly patterns, and up to six cycles for the best results .
“If the metric experiences seasonality, the algorithm needs enough historical data to learn what’s normal and establish a baseline.”
- Datadog Documentation
Additionally, ensure your alerting window includes at least five data points to avoid false alerts caused by outliers . For metrics with sparse data points, such as counts, avoid setting overly short alerting windows that might not capture enough information for accurate analysis.
If you’re working with limited historical data, Datadog’s Basic algorithm is a solid choice. This algorithm is designed to adapt quickly to changing patterns, making it particularly useful for small or medium-sized businesses launching new services or expanding their monitoring.
Creating Anomaly Detection Monitors
To set up your first anomaly detection monitor, you'll need to pick a metric, select an algorithm, and configure the detection parameters.
Selecting Metrics and Algorithms
Head over to Datadog's monitoring interface and start by creating a new anomaly detection monitor. Choose "Anomaly Detection" as your method and select the specific metric you want to track.
When picking a metric, focus on those with predictable patterns, like response times or error rates, and steer clear of metrics that tend to be erratic. Once you've chosen your metric, Datadog will automatically recommend an algorithm that suits your data. If needed, you can tweak this suggestion under "Advanced Options" to better align with your unique needs.
Datadog provides three main algorithms to handle different types of data patterns:
- Basic Algorithm: Best for metrics without strong seasonal trends. It adapts quickly to changes, making it a solid choice for newer services or applications where historical data is limited.
- Agile Algorithm: Designed for metrics with daily or weekly seasonality, this algorithm is quick to detect anomalies but can be sensitive to short-term fluctuations. It's a good fit for metrics like website traffic or user logins that follow regular daily patterns.
- Robust Algorithm: Ideal for metrics with strong seasonal trends, this algorithm is less affected by temporary spikes or dips. It's particularly useful for established applications with consistent usage patterns, as it reduces false alerts.
Once you've chosen your algorithm, move on to fine-tuning the detection settings.
Setting Detection Parameters
Now, configure the detection parameters to ensure your monitor works effectively:
- Bounds and Deviation: Define whether to alert for values above, below, or both outside the expected range. Set a deviation threshold to determine when alerts are triggered. Higher thresholds reduce noise, while lower thresholds capture more subtle issues.
- Alert Window: Specify the minimum number of consecutive anomalous data points required to trigger an alert. A window of at least five data points can help avoid reacting to short-term outliers.
- Recovery Window: Set the number of consecutive normal data points needed for the monitor to return to a non-alert state. This prevents rapid toggling between alert and normal states when metrics hover near the threshold.
- Seasonality Settings: For algorithms that support it, you can define daily or weekly patterns. Use weekly seasonality for metrics that differ between weekdays and weekends, or daily seasonality for metrics with consistent hourly trends.
When adjusting these parameters, think about the specific context of your business. For example, a critical payment processing system might need more sensitive settings (lower deviation thresholds), while a development environment could tolerate higher thresholds to avoid excessive alerts.
Once everything is configured, you’re ready to finalize the monitor setup.
Saving and Activating Monitor Settings
The last step is to integrate your monitor into your alerting workflow.
- Monitor Name and Description: Choose a name that clearly identifies the metric and its importance. For instance, "Payment API Response Time Anomaly" provides immediate clarity. Add a description to outline normal ranges and explain the potential impact of detected anomalies.
- Tags and Metadata: Use consistent tags to organize your monitors and streamline alert routing. For example, tags like
service:payment-api,environment:production, andteam:backendcan help ensure alerts reach the right teams quickly. - Monitor Priority: Assign priorities to indicate the urgency of alerts. Higher priorities should go to metrics critical to business operations, while lower priorities can be reserved for informational or less critical monitors.
After reviewing your settings, save the monitor to activate it. Once active, it will start analyzing metric data based on your configurations and send alerts when anomalies are identified. The monitor will then appear in your list with a status indicator showing its current state.
Datadog Documentation.
Tuning Anomaly Detection for SMB Requirements
Small and midsize businesses (SMBs) need monitoring systems that strike the right balance - catching actual problems while avoiding the chaos of constant, unnecessary alerts.
Adjusting Sensitivity and Thresholds
Finding the right sensitivity is key. If it's set too high, you'll get bombarded with false alarms. Too low, and you risk missing real issues. To get this balance right:
- Use targeted detection rules: Create specific, granular queries and test them using Datadog's Log Explorer. This helps you focus on what truly matters.
- Fine-tune threshold detection: Adjust queries based on vital attributes like geolocation or HTTP status codes to zero in on critical services.
- Suppress known safe activities: If your team regularly runs performance tests during certain times, set up suppression lists to silence alerts during those windows. This cuts down on unnecessary noise.
- Handle sparse metrics smartly: Broaden the alerting window and adjust intervals to gather enough data points. This ensures a stable baseline, reducing false positives caused by insufficient data.
- Leverage suppression options: Use features like the "Never trigger signals for" option to exclude alerts from safe identifiers, such as specific IP addresses or user IDs.
Once you've tuned these settings, make it a habit to revisit them periodically. Metrics and patterns change, and your detection system should evolve with them.
Regular Review and Updates
Keeping your anomaly detection system sharp requires regular check-ins. Here's what to focus on during these reviews:
- Evaluate query metrics: Ensure the metrics you're monitoring still align with your environment. Look for predictable patterns, such as daily or weekly cycles, and confirm you have at least five data points within your alerting window - especially important for sparse metrics.
- Check seasonal accuracy: For metrics that vary with seasons, ensure you have enough historical data to maintain accuracy.
- Monitor and adjust thresholds: Track false positives and tweak thresholds to minimize unnecessary alerts.
- Start simple for new services: When dealing with new systems with limited data, use the Basic algorithm initially and refine as more data becomes available.
- Reassess tolerance levels: Adjust deviation thresholds to match your business's capacity for handling alerts and its tolerance for anomalies.
The frequency of these reviews should match the pace of your business growth and system changes. Regular updates ensure your anomaly detection remains effective and ready to handle evolving challenges.
Setting Up Notifications and Workflows
Once your monitors are configured, the next step is making sure alert notifications and workflows are set up to tackle anomalies quickly. Timely alerts paired with efficient workflows can make all the difference in responding effectively.
Setting Up Notification Channels
Datadog offers several notification channels, and the best choice depends on your team's needs and the urgency of issues. For less critical alerts, email notifications provide detailed context and are easy to manage. If you're dealing with time-sensitive problems, Slack integration is a great option for instant visibility.
To set up email notifications, go to your monitor's configuration settings and add group email addresses in the notification section. This makes scaling your team easier as you grow. For Slack, connect your Datadog account to your workspace through the integrations page. Once linked, you can direct alerts to specific Slack channels. For example, you might create channels like #alerts-critical for urgent matters, #alerts-performance for performance-related issues, and #alerts-info for general updates.
For teams requiring guaranteed response times, PagerDuty integration is a must. With PagerDuty, you can configure escalation policies to ensure on-call engineers are paged if alerts go unacknowledged. This is especially important for critical monitors where downtime could impact revenue or customer satisfaction.
If you need custom integrations, webhook notifications are a flexible option. Webhooks include all the necessary alert data, making it easy to integrate with ticketing systems or trigger automated responses. To refine the delivery process, use tags and metadata for more precise alert routing.
Using Tags and Metadata for Alert Routing
Tags can turn a flood of alerts into an organized, actionable system. Use tags to route alerts based on service ownership, environment, or severity. For example, production issues can be routed to the right on-call team, while development alerts go to the appropriate engineers.
Adding custom metadata can provide even more context. Tags like customer:enterprise or region:us-east can immediately highlight which customers or areas are affected, helping teams prioritize their response. You can also use template variables in notification messages to pull in tag values dynamically. This way, instead of a generic message like "Database anomaly detected", your alert might specify, "Production MySQL database anomaly detected in us-east region affecting enterprise customers."
Adding Anomaly Detection to Incident Management
Integrating notifications with incident management tools helps your team transition smoothly from identifying an issue to resolving it. For critical anomalies, configure monitors to automatically create incidents in Datadog's incident management system. Include runbook links, metric timelines, and infrastructure details in the incident to streamline the resolution process.
If you have a status page, integrate it with your anomaly detection system. Automatically updating the status page during major incidents can reduce support ticket volumes and reassure customers that you're addressing the issue.
Post-incident reviews are much easier when you preserve anomaly data. Datadog’s incident timeline automatically logs anomaly triggers, helping teams analyze root causes and improve future detection settings. Regular reviews of resolved incidents - like monthly check-ins - can highlight patterns and lead to adjustments in your monitoring approach.
To ensure nothing gets overlooked, set up escalation workflows. For example, critical production issues might escalate to the CTO if unresolved after 30 minutes, while performance issues could alert the operations manager after two hours.
Start with simple workflows, like email and Slack notifications, and gradually build more advanced routing and automation as your team and monitoring needs grow.
For more tips on customizing notifications and workflows for small and medium-sized businesses, check out Scaling with Datadog for SMBs.
Troubleshooting and Improving Detection
Effective anomaly detection requires ongoing refinement based on how it performs in practice. Below, we’ll look at common challenges and strategies for continuous improvement.
Common Issues and Solutions
False positives are one of the most frequent challenges. These occur when alerts are triggered by normal variations in behavior, creating unnecessary noise and leading to alert fatigue. In fact, research shows that 42% of IT teams experience alert fatigue. To reduce this, consider increasing your alert evaluation window. This allows the system to analyze more data points, ensuring alerts are only triggered when deviations persist rather than reacting to brief fluctuations.
If your monitors aren’t triggering when they should, insufficient historical data might be the culprit. For metrics with seasonal patterns, make sure you have at least three complete cycles of historical data. For example, if your metric follows a weekly trend, use at least three weeks of data to improve detection accuracy.
Sparse data can also distort alerts. For metrics that produce data infrequently, try increasing both the interval and alerting window. This helps capture enough data for a reliable analysis.
Flappy alerts, which flip between healthy and unhealthy states, can disrupt operations. These often happen when metrics hover near thresholds or experience temporary spikes. Adding recovery thresholds can confirm an issue has been resolved before clearing the alert. Additionally, grouping related alerts by service or cluster can reduce redundancy and streamline notifications.
"As your environment changes, new trends can quickly make your existing monitoring less accurate. At the same time, building alerts after every new incident can turn a straightforward strategy into a convoluted one. Treating monitoring as a one-time or reactive effort can both result in alert fatigue." - Datadog
Choosing the right algorithm is also critical. Use the Basic algorithm for metrics with clear, predictable trends. The Agile algorithm works better for metrics that require quick adaptation, while the Robust algorithm is ideal for those with occasional outliers that shouldn’t trigger alerts. If it’s hard for a person to predict a metric’s trend, anomaly detection will likely struggle as well.
Reviewing Historical Alerts
Once immediate issues are addressed, reviewing historical alerts can further improve detection accuracy. Regular log reviews have been shown to enable incident detection 50% faster. Scheduling monthly review sessions can help identify which alerts are useful and which contribute to unnecessary noise.
Datadog’s Monitor Notifications Overview dashboard is a great tool for this process. It shows trends in alert frequency and lets you compare current performance with historical data. Look for predictable alerts that follow consistent patterns and flappy alerts that frequently change states - these are prime candidates for threshold adjustments or algorithm tweaks.
Pay close attention to alerts triggered during planned maintenance or expected traffic spikes. By scheduling downtimes for these events, you can silence unnecessary alerts and ensure your team stays focused on actual issues.
Analyzing false positives can also reveal valuable insights. For example, a marketing campaign or recent code deployment might have shifted typical behavior patterns. Use this information to adjust sensitivity settings or introduce conditional variables that account for specific situations.
Organizations that regularly review alerts see a 25% improvement in system reliability. Documenting findings from each review and tracking changes over time can help build a knowledge base that benefits your entire team.
Long-Term Improvement for SMB Growth
Beyond immediate fixes, long-term adjustments ensure anomaly detection evolves alongside your business. Companies using anomaly detection tools can cut their mean time to detect (MTTD) by up to 50%, provided the system adapts to changing needs.
Quarterly assessments of your monitoring strategy can keep alerts aligned with business priorities. Include developers, operations staff, and other stakeholders in these reviews to ensure metrics reflect the most critical health indicators. As you scale or add services, evaluate whether your current metrics still meet your needs.
Predictive anomaly detection algorithms can identify up to 90% of potential failures before they occur. Tools like Datadog’s Watchdog use AI to flag anomalies across your infrastructure. These insights can then be turned into custom monitors tailored to your setup.
"To prevent and minimize alert fatigue, it is important to continuously review and update your monitoring strategy, specifically targeting unnecessary or unhelpful alerts." - Datadog
The cloud-based anomaly detection market is expected to grow from $1.4 billion in 2020 to $4.5 billion by 2025, highlighting the increasing importance of these tools. Training your team on advanced features and staying informed about new capabilities can help you stay ahead.
Adopting a mindset of continuous improvement is key. When incidents occur despite your monitoring, investigate why the anomaly detection system missed them. Use these insights to refine alert configurations or add new monitors as needed.
Track key metrics, such as alert-to-incident ratios, average response times, and the percentage of actionable alerts, to measure the effectiveness of your improvements. These metrics can also help justify further investments in your monitoring strategy.
Conclusion
Implementing anomaly detection with Datadog can revolutionize how SMBs manage their infrastructure, shifting from merely reacting to problems to actively preventing them. By following the steps in this guide - such as gathering sufficient historical data and fine-tuning sensitivity settings - you can create a monitoring system that catches issues early, before they lead to costly downtime.
The financial benefits are hard to ignore. Businesses that adopt anomaly detection tools often experience a 300% return on investment and cut their mean time to detect issues by up to 50%. For SMBs, where every dollar counts, these improvements mean better customer experiences and less operational strain.
While Datadog’s machine learning algorithms handle much of the heavy lifting, your involvement remains crucial. Regularly reviewing alert patterns, adjusting thresholds to match changing business needs, and utilizing features like Watchdog can ensure your monitoring stays effective. The growing demand for anomaly detection tools - projected to rise from $2.3 billion in 2020 to $5.9 billion by 2025 - highlights how essential these tools have become. Beyond financial savings, they simplify and enhance your monitoring efforts.
Switching to cloud-based deployments can also lower your total cost of ownership by up to 30% compared to traditional on-premise setups. Datadog’s integrated platform provides a flexible and scalable foundation, designed to grow alongside your business.
To ensure long-term success, treat anomaly detection as a dynamic system that evolves with your infrastructure. Regularly refining monitors and notification workflows will help you stay ahead of challenges as your SMB scales. This commitment to improving your monitoring processes will pay off as your operations become more complex.
With Datadog, SMBs can achieve up to 30% improvements in operational efficiency, while gaining the tools needed to support sustainable growth. For detailed setup instructions, refer to the guide above.
Looking for more expert advice? Check out Scaling with Datadog for SMBs for additional tips and insights.
FAQs
How does Datadog's anomaly detection help SMBs minimize false alerts and respond faster to issues?
Datadog's anomaly detection is a game-changer for small and medium-sized businesses. By analyzing historical data, it identifies patterns of normal system behavior, making it easier to spot deviations that actually matter. The result? Fewer false alerts - so your team can focus on real issues instead of being bombarded with unnecessary notifications.
This tool doesn’t just stop at identifying anomalies. It allows you to catch potential problems early, giving your team the chance to respond quickly and prevent minor hiccups from turning into major disruptions. For growing businesses, this means less downtime and smoother operations - key factors in maintaining momentum and meeting goals.
What should I consider when selecting an anomaly detection algorithm in Datadog?
When choosing an anomaly detection algorithm in Datadog, it’s crucial to consider the behavior of your data, including any recurring patterns like daily or weekly fluctuations. Some algorithms work well with periodic data, while others are better suited for irregular or unpredictable trends. Matching the algorithm to your data’s characteristics is key.
Pay close attention to configuring thresholds to minimize false positives. A good starting point is using typical bounds, such as 2 or 3, and then fine-tuning them based on how your data behaves over time. Also, evaluate whether the algorithm can handle the scale and speed of your data, whether that means processing real-time streams or analyzing batch data. Taking these factors into account will help ensure accurate and reliable anomaly detection in your Datadog setup.
How can I use tags and metadata in Datadog to improve alert routing and notifications?
Tags and metadata in Datadog play a crucial role in keeping alert management organized and efficient. By using consistent, purposeful tags - like team, priority, or environment - you can quickly filter and direct alerts to the right teams or individuals. This approach speeds up response times and cuts down on unnecessary noise.
For even better results, stick to clear naming conventions and take advantage of features like tag inheritance. This ensures notification rules are applied automatically, making your alert workflows smoother and easier to manage. Thoughtful tagging not only sharpens alert routing but also helps prevent alert fatigue, enabling your team to concentrate on the most important issues.