Avoiding Common Datadog Mistakes for SMBs
Learn how small and medium-sized businesses can effectively set up Datadog by avoiding common mistakes and optimizing monitoring strategies.
Setting up Datadog effectively can save small and medium-sized businesses time, money, and headaches. But common mistakes - like misconfigured agents, excessive alert noise, or poor log management - can disrupt monitoring and inflate costs. Here's a quick summary to help you avoid these pitfalls:
- Agent Setup: Ensure the Datadog agent is active, has enough resources, and can communicate through the right ports.
- Integration Issues: Rotate API keys regularly, configure proxies correctly, and use health checks to validate integrations.
- Alert Overload: Group notifications, set recovery thresholds, and use evaluation windows to reduce false positives.
- Log Management: Filter out unnecessary logs, categorize them by importance, and manage retention to control costs.
- Security Settings: Use role-based access control (RBAC), multi-factor authentication (MFA), and compliance tools to protect your data.
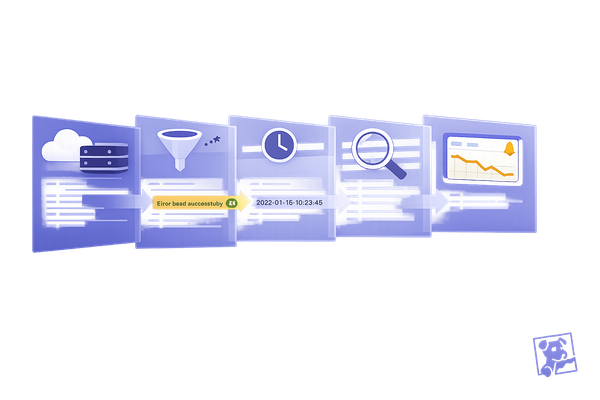
Datadog Log Alert & Analytics | watchdog
Common Setup Mistakes
Setting up Datadog correctly is crucial for ensuring accurate and reliable monitoring. Many small and medium-sized businesses (SMBs) face configuration challenges that can lead to gaps in monitoring and data collection.
Agent Setup Problems
The Datadog agent is the backbone of metrics and log collection. When it's not set up properly, you may encounter monitoring issues. Here are some common problems and how to address them:
| Issue | Impact | Solution |
|---|---|---|
| Agent Status | Missing or delayed metrics | Use sudo service datadog-agent status to confirm the agent is active. |
| Resource Limits | Incomplete data collection | Check disk space and memory usage regularly to avoid resource shortages. |
| Connectivity | Failed data transmission | Ensure ports 443 and 8125 are open for the agent to communicate. |
To keep the agent running smoothly, review the logs in /var/log/datadog for any errors. Double-check the configuration file at /etc/datadog-agent/datadog.yaml to confirm all settings are correct. Additionally, ensure that all integrations are properly configured to maintain full visibility across your systems.
Integration Setup Errors
Errors in integration setup, particularly with API keys and proxy settings, can compromise the accuracy of your data and alerts. A valid API key is essential for authenticating data and securing monitoring.
Here are some best practices for integration setup:
-
API Key Management
Regularly rotate API keys and limit access to trusted users only. Add your API key in the configuration file like this:api_key: YOUR_API_KEY -
Proxy Configuration
If you're using a proxy, update the agent configuration with the correct server address, port numbers, and credentials. -
Integration Health Checks
Use Datadog tools like "Agent Check Status" and "Agent Flare" to troubleshoot and validate your integrations. These tools can help you catch and fix issues before they disrupt monitoring.
Regularly reviewing your configuration is essential for maintaining accurate and complete data. By addressing these common setup mistakes early, SMBs can ensure reliable monitoring and get the most out of their Datadog setup.
Right-Sizing Your Monitoring
Effective monitoring is all about finding the sweet spot: covering your system thoroughly while keeping alerts manageable. Too many alerts can overwhelm your team, while too few can lead to missed issues.
Reducing Alert Noise
Here are some ways to cut down on unnecessary alerts:
| Strategy | Purpose | How It Works |
|---|---|---|
| Notification Grouping | Combine similar alerts | Merge related alerts into a single notification |
| Event Correlation | Simplify incident handling | Treat connected alerts as one event |
| Recovery Thresholds | Avoid repetitive alerts | Add checks to confirm an issue is resolved before clearing it |
| Evaluation Windows | Increase alert accuracy | Use more data points before triggering alerts |
For example, one organization experienced 4,000 alerts in just 30 minutes due to a network issue. Using Datadog's Event Management, they consolidated all these alerts into a single notification.
Addressing Coverage Gaps
To ensure your system is fully monitored, consider these methods:
- Dependency Mapping: Use Datadog APM's distributed tracing to visualize how components interact. This helps identify where failures might occur and ensures no blind spots.
- Service Health Monitoring: Set up service checks for critical systems. These checks only trigger alerts after consecutive failures, reducing the chances of false alarms.
These steps help maintain a well-rounded monitoring setup while keeping unnecessary alerts in check.
Setting the Right Monitoring Scope
A balanced monitoring strategy takes into account both your system's needs and your team's capacity. Focus on these key areas:
- Automated Remediation: Set up automated fixes for common issues, plan maintenance windows to suppress alerts during downtime, and use exponential backoff in network settings to avoid duplicate alerts.
- Maintenance Windows:
- Schedule downtimes for planned updates.
- Suppress alerts during these periods to prevent unnecessary noise.
- Network Configuration:
- Use exponential backoff to avoid overwhelming bandwidth.
- Prevent duplicate alerts during system recovery to keep monitoring stable.
Use Datadog's Monitor Notifications Overview dashboard to review your alerting strategy. This tool helps you identify noisy alerts and track patterns over time.
Must-Use Datadog Tools
Once your monitoring setup is in place, take advantage of key Datadog tools to gain better visibility and control. Many small and medium-sized businesses miss out on important features that can make monitoring much more effective.
Building Better Dashboards
Well-structured dashboards make it easier to detect and resolve issues quickly. Here's how you can organize them:
| Dashboard Type | Best Use Case | Key Features |
|---|---|---|
| Screenboards | Visual presentations | Custom layouts with images and logs |
| Timeboards | Troubleshooting | Correlation within a single timeframe |
| Host Maps | Infrastructure overview | High-level system visualization |
"The clean, easy to use interface allows anyone on our development team to create a Datadog dashboard, start sending metrics from their program, and really understand in fine-grain detail what that program is doing."
– Calvin French-Owen, CTO & Co-Founder, Segment
Group widgets to keep related metrics together. This not only simplifies bulk editing but also ensures your dashboards remain clean and adaptable to any screen size. Key visualizations to incorporate include:
- Timeseries graphs to track how metrics change over time
- Heat maps for grouping metrics on a large scale
- Top Lists to identify system outliers quickly
- Alert Graphs to keep an eye on critical thresholds
Once your dashboards are set, the next step is optimizing log management to balance data collection and costs.
Log Management Basics
Managing logs effectively means capturing the data you need without overspending. Here are some best practices:
-
Set Up Log Retention Buckets
Organize logs based on their importance and retention requirements. Datadog offers 100 built-in indexes, which you can use to categorize logs like:- Critical system events for longer retention
- Debug logs for shorter retention
- Application health checks for minimal retention
-
Implement Smart Filtering
Fine-tune your log management to:- Extract key metrics from logs for long-term analysis
- Exclude low-value logs, such as routine health checks
- Use Flex Logs for high-volume, low-priority data at a lower cost
"Datadog Log Management has changed the way we approach log ingestion and usage, allowing multiple teams to sustainably manage very large volumes of logs."
– Aaron Mitti, Chief Software Architect at GE Transportation, a Wabtec Company
Connecting Your Systems
Integrating your systems ensures you can correlate logs, metrics, and traces within Datadog's unified platform. Use features like APM distributed tracing, automatic service discovery, and bi-directional integrations to maintain a complete view of your environment.
"Datadog has been instrumental in reducing our time to incident resolution. Datadog exposes a great deal of valuable data about our services and environments, to the right stakeholders, at all points of our software development life cycle."
– Jeff Webb, Engineering Manager, Rose Rocket
Better Alert Setup
Once your agents and integrations are properly configured, the next step is setting up alerts effectively. A well-designed alert system helps avoid missed issues and reduces unnecessary notifications that lead to alert fatigue.
Setting Alert Limits
Define clear thresholds to minimize false positives and focus on real issues.
| Alert Component | Recommended Setting | Purpose |
|---|---|---|
| Evaluation Window | 10-15 minutes | Reduces false positives from temporary spikes |
| Recovery Threshold | 2-3 data points | Confirms issue resolution before changing status |
| Notification Grouping | By service/cluster | Consolidates related alerts for easier management |
For non-critical metrics, use longer evaluation windows to ensure alerts represent actual trends. Once thresholds are set, categorize alerts based on their business impact.
Alert Priority Levels
Fine-tune noisy alerts and use filters to route notifications effectively. Here's a simple priority system:
- Critical Priority: Infrastructure failures or full service outages.
- High Priority: Performance issues or capacity concerns.
- Medium Priority: Warnings or emerging trends that need monitoring.
- Low Priority: Routine checks or informational updates.
Adjust these priorities as needed to ensure the right teams focus on the most important issues.
Regular Alert Reviews
Plan quarterly reviews of your alert settings to improve performance and keep configurations up to date. Here's how:
-
Review Alert Activity
Look for frequently triggered alerts, especially those with predictable patterns or "flappy" behavior that toggles statuses too often. -
Refine Alert Thresholds
Take advantage of Datadog's tools:- Use composite monitors for complex conditions.
- Enable anomaly detection for dynamic thresholds.
- Mute alerts automatically during maintenance windows.
-
Update Alert Routing
Adjust notification routes based on team feedback and how they respond to alerts. Refine filter rules to ensure alerts reach the right people with the right context.
During planned system updates or deployments, schedule maintenance windows to temporarily silence alerts while still keeping an eye on real issues. Regular reviews and updates will ensure your alerts stay relevant and actionable.
Security and Compliance Setup
Setting up Datadog with the right security settings is crucial to safeguarding data and ensuring compliance.
Security Monitoring
Datadog's integrated security monitoring helps identify and respond to threats effectively. Misconfigured settings can leave businesses exposed, but these key components can help mitigate risks:
| Component | Purpose | Key Configuration |
|---|---|---|
| Cloud SIEM | Detect threats in real time | Enable over 850 integrations |
| Workload Protection | Kernel-level threat analysis | Configure File Integrity Monitoring |
| Detection Rules | Automate threat monitoring | Align with the MITRE ATT&CK™ framework |
In addition to detecting threats, managing user access effectively is a cornerstone of secure monitoring.
"Using Cloud Security Management was like having a member of the InfoSec team embedded within our engineering team. They could easily see the number of misconfigured resources in a single view".
Access Control Setup
Strengthen your security posture by implementing these access control measures:
- Role-Based Access Control (RBAC): Assign roles and permissions based on job responsibilities and data sensitivity.
- Multi-Factor Authentication (MFA): Require MFA for accessing sensitive data or administrative functions.
- Single Sign-On (SSO) Integration: Connect your identity provider using SAML for centralized authentication management.
These access controls not only enhance security but also help in meeting regulatory requirements.
"Datadog gives me confidence that we know where our entire organization sits from a security standpoint, as well as a simple way to show senior leadership measurable improvements to our security posture that result from our collective efforts".
Meeting Standards
To achieve compliance, consider the following measures:
HIPAA Compliance Setup
Enable HIPAA-compliant log management with features like a 6-year retention period, automatic detection of PHI through the Sensitive Data Scanner, and comprehensive audit logging.
General Security Standards
- Maintain SOC 2 Type II compliance
- Follow ISO 27001 security controls
- Document all security practices in the CSA STAR registry
"Datadog reduces the mean time to respond from hours down to minutes! Out-of-the-box detection rules help get from 0 to operations quickly".
Success stories highlight the benefits of a strong security setup. For instance, Poshmark significantly reduced account takeover incidents, saving millions in potential losses. Similarly, Zulily enhanced its PCI compliance through Datadog's File Integrity Monitoring.
Conclusion
Main Points
To get the most out of Datadog, focus on these key configuration areas. As Samuel Kollát puts it:
"Every dollar you spend should contribute value to your organization"
| Focus Area | Common Mistake | Best Practice |
|---|---|---|
| Cost Management | Excess log volume | Filter out unnecessary logs and apply retention policies |
| Alert Configuration | Too many alerts | Leverage Doctor Droid to analyze patterns and prioritize effectively |
| Resource Optimization | Overuse of high-cardinality metrics | Standardize tags and limit high-cardinality metrics usage |
Use these insights to fine-tune your setup regularly.
Next Steps
Take action with these strategies to keep improving your Datadog setup:
Cost Management and Monitoring
- Conduct monthly cost reviews and adjust monitoring settings to lower per-host expenses.
- Turn off containerized agent logs to save on data transfer costs.
- Set up spike alerts to manage costs proactively.
Resource Planning
- Review committed volumes every quarter to align with actual usage.
- For container monitoring, compare prepaid options ($1 per container monthly) with on-demand pricing ($0.002 per container hourly) to find the best fit for your needs.
FAQs
What are the best ways for small and medium-sized businesses to avoid common mistakes and optimize their Datadog setup?
To help SMBs get the most out of Datadog while avoiding common pitfalls, focus on these key strategies:
- Filter unnecessary logs: Minimize costs by excluding non-essential logs and adjusting log verbosity to only capture critical data.
- Optimize log retention: Tailor log retention policies to your business needs, keeping non-critical logs for shorter periods to save on storage.
- Manage custom metrics: Avoid excessive use of high-cardinality tags (e.g., user IDs) and instead use standardized tags to reduce complexity and cost.
- Set clear alerts: Create targeted alerts to monitor key systems and applications, avoiding alert fatigue while staying proactive.
- Configure resources wisely: Ensure Datadog agents are properly set up, with resource limits in place to prevent overuse or crashes.
By implementing these steps, SMBs can streamline their monitoring processes, reduce costs, and make the most of Datadog’s powerful features.
How can SMBs reduce alert noise and avoid alert fatigue in Datadog?
Reducing alert noise and preventing alert fatigue in Datadog involves implementing strategies that ensure your monitoring system stays effective without becoming overwhelming. Start by grouping notifications and correlating events to reduce redundant alerts. Scheduling downtimes for planned maintenance or low-priority time periods can also help focus attention on critical issues.
Additionally, refine your alert settings by adjusting thresholds, using anomaly or outlier detection, and applying conditional variables to create more meaningful alerts. Consider composite alerts to account for the state of multiple monitors, and use functions like rates, moving averages, or time-shift differentials to smooth out fluctuations. These practices can help SMBs maintain a balanced and productive monitoring environment.
How can effective log management in Datadog help SMBs save money and improve system monitoring?
Effective log management in Datadog can help SMBs save money by allowing you to categorize logs into different retention policies, ensuring you only store data that’s truly valuable. By setting quotas and monitoring usage, you can better control costs and avoid overspending on unnecessary storage.
It also enhances monitoring efficiency by letting you exclude unimportant logs from indexing, so you can focus on the critical data needed for real-time troubleshooting and performance analysis. This ensures your team spends less time sifting through irrelevant information and more time addressing key issues.

