Best Practices for Datadog Webhooks
Learn essential practices for setting up and securing Datadog webhooks to enhance alert management and incident response for SMBs.
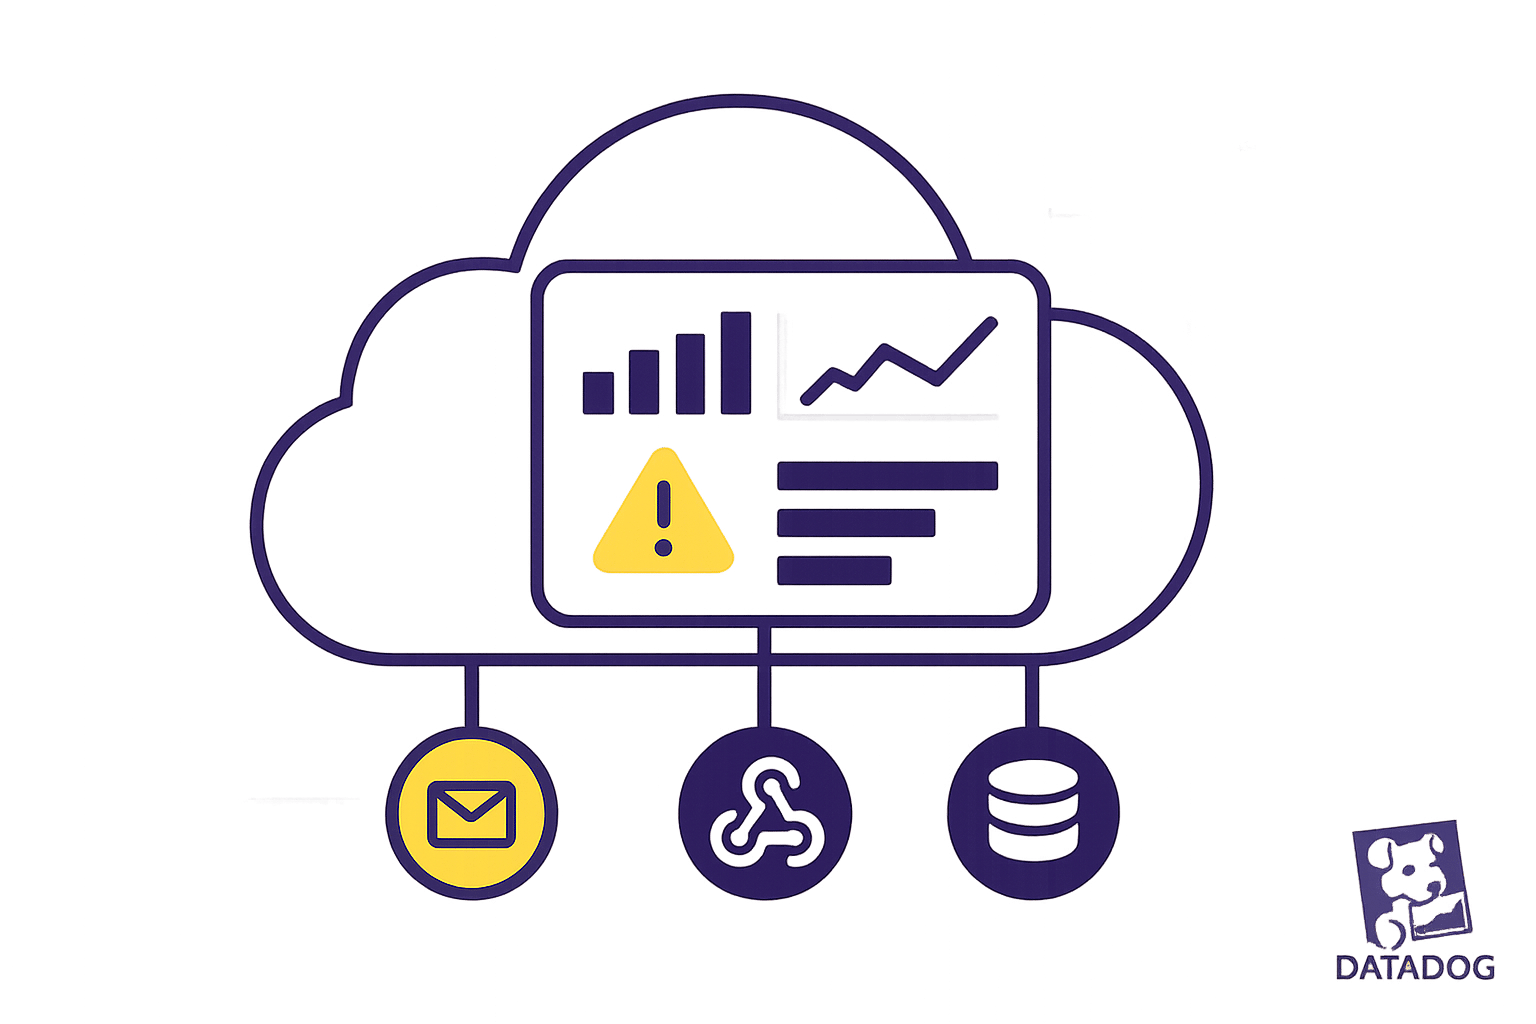
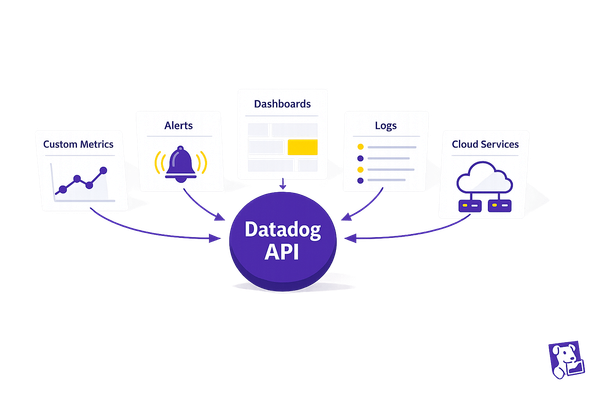
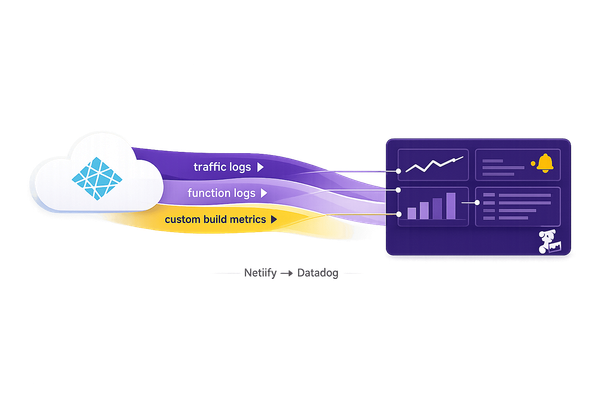
Datadog webhooks let you send alerts automatically to external systems when issues arise, like high CPU usage or failed APIs. For small and medium-sized businesses (SMBs), they’re invaluable for faster incident response and integrating with tools like Slack, Twilio, or custom apps. But to make them reliable and secure, you’ll need to follow key steps:
- Set up efficiently: Use clear names, secure HTTPS endpoints, and test configurations before deploying.
- Customize payloads: Tailor alert data using Datadog’s templates (e.g.,
$EVENT_TITLE,$LINK) to match your tools’ needs. - Ensure reliability: Use background processing, acknowledge requests quickly, and implement retry logic with exponential backoff.
- Secure communications: Validate webhook signatures, use HTTPS, and rotate shared secrets regularly.
- Monitor performance: Track success rates, log activities, and refine configurations based on metrics.
Datadog monitoring and auto remediation
Setting Up Datadog Webhooks for SMBs
Datadog's alerting features are crucial for effective incident management, especially for small and medium-sized businesses (SMBs). Properly configuring webhooks ensures your alerts reach the right systems and teams. Here's how to set up and customize webhooks within Datadog.
How to Configure Webhooks in Datadog
To get started, go to the Integrations section in Datadog, find the Webhooks tile, and click "Install" to create a new webhook. Use clear and descriptive names for each webhook (e.g., "production-alerts-slack") so that your team can easily understand their purpose as your setup grows more complex.
The endpoint URL is the destination where Datadog will send your alert data. This must be a secure, publicly accessible HTTPS endpoint capable of handling POST requests. For services like Slack, you can use the webhook URLs they provide. If you're connecting to a custom application, make sure the endpoint can process incoming HTTP requests and handle JSON payloads.
Testing is a key step before deploying your webhooks. Datadog includes a test feature that sends sample data to your endpoint, allowing you to confirm everything works as expected. This helps avoid silent failures during critical incidents.
Additionally, ensure you include the necessary authentication headers - such as API keys or bearer tokens - when configuring your webhook in Datadog.
How to Customize Payloads for Your Integration
Once your webhook is set up, you can customize the payloads to better suit the needs of your receiving systems. While Datadog's default payloads include detailed alert information, tailoring them ensures the data is relevant and formatted appropriately for your integrations. Datadog's templating engine makes this possible by using template variables to dynamically include alert-specific details like $EVENT_TITLE, $HOSTNAME, and $METRIC.
For example, adding $LINK to your payload provides direct access to relevant dashboards, while $SNAPSHOT can include visual snapshots of the issue in your notifications. This level of customization can significantly speed up response times.
When working with SMS notifications, make sure the payload adheres to your provider's format requirements. For other platforms, like incident management tools, you might need to map Datadog's severity levels (e.g., "critical") to your system's priorities (e.g., "P1" incidents).
Consider going beyond basic alert information by including suggested actions or next steps. For instance, a database connection alert could include links to connection pool dashboards and runbooks, while a disk space warning might include cleanup scripts or instructions for expanding storage.
You can also adjust payloads based on alert priority. For high-priority issues, include detailed information, direct contact methods, and actionable next steps. Lower-priority alerts can be less detailed and routed to different channels. Here's a quick reference:
| Priority Level | Response Time | Example Triggers |
|---|---|---|
| High | Immediate (24/7) | Service outages, security breaches |
| Moderate | Business hours | Performance issues, storage at 80% |
| Low | Next business day | Non-critical warnings, trend analysis |
Mobile app integration is another valuable tool for SMBs. By including links to the Datadog mobile app in your webhook payloads, team members can quickly investigate and acknowledge alerts from anywhere. This is especially useful for smaller teams where individuals often juggle multiple roles and may not always be at their desks.
Finally, refine your payloads over time based on real-world incident responses. Adjust the level of detail, format, and included actions to make sure your alerts remain effective and actionable.
Making Webhooks Reliable
Reliable webhooks are essential to avoid prolonged outages. Here's how you can set up a solid webhook handling system that performs dependably, even when issues arise.
How to Acknowledge Webhook Requests
Failing to properly acknowledge webhook requests can lead to duplicate alerts. When Datadog sends a webhook to your endpoint, it expects an immediate HTTP 200 OK response. If this confirmation isn't received, Datadog assumes the delivery failed and will retry, potentially overwhelming your system with repeated alerts.
To prevent this, always respond with a 200 OK status before processing the webhook data. Doing so ensures that duplicate alerts and unnecessary retry loops are avoided. Additionally, log key information like the timestamp, alert ID, and payload right away for auditing and troubleshooting purposes.
One common mistake smaller businesses make is processing webhook data synchronously before sending the acknowledgment. If processing takes too long, your endpoint might time out, causing Datadog to think the webhook failed. Instead, acknowledge receipt immediately and queue the data for background processing.
Using Background Processing for Better Performance
After acknowledgment, offloading tasks to a background process is key to maintaining speed and reliability. This method separates the receipt of the webhook from the actual alert-handling logic, allowing your endpoint to respond quickly while processing happens asynchronously.
This approach not only improves reliability but can also enhance incident resolution times. For example, background processing has been shown to reduce incident resolution delays by up to 30%. By decoupling these tasks, your system can handle multiple simultaneous alerts without creating bottlenecks.
To implement this, set up a job queue. The endpoint can immediately acknowledge requests and then process the alert data in the background. You can also assign different priorities to tasks - critical alerts can be handled right away, while less urgent notifications might be processed during regular business hours.
Regularly testing your webhook endpoints under load is another important step. It helps you identify and address performance issues before they escalate.
Setting Up Retry Logic for Failed Requests
Even with rapid processing, network issues or maintenance can still cause webhook delivery failures. To ensure alerts are delivered, you need a smart retry strategy.
Exponential backoff is a reliable approach for retries. Start with a short delay, such as 30 seconds, and double the wait time for each subsequent attempt. This strategy reduces the risk of overwhelming your systems while ensuring persistent delivery.
Adding jitter to retry intervals can further improve reliability. Without jitter, multiple failed webhooks might retry at the exact same time, potentially causing traffic spikes. A small random delay - say, 10 to 30 seconds - can naturally spread out the retry load.
Limit the number of retry attempts to avoid infinite loops. For smaller businesses, 5 to 7 retries over 24 to 48 hours is a reasonable range. If the webhook still fails after these attempts, move it to a Dead Letter Queue for manual review and troubleshooting.
| Retry Attempt | Base Delay | With Jitter Range | Cumulative Delay |
|---|---|---|---|
| 1st | 30 seconds | 30–60 seconds | ~1 minute |
| 2nd | 1 minute | 1–2 minutes | ~3 minutes |
| 3rd | 2 minutes | 2–4 minutes | ~7 minutes |
| 4th | 4 minutes | 4–8 minutes | ~15 minutes |
| 5th | 8 minutes | 8–16 minutes | ~30 minutes |
Log every retry attempt to analyze patterns and refine your strategy. Track which endpoints fail most often, the error codes returned, and the duration of outages. This data can help you improve retry intervals and spot recurring issues.
Finally, undeliverable webhooks should be stored in a Dead Letter Queue. This allows you to manually investigate persistent failures, replay important alerts once issues are resolved, and maintain a complete audit trail of webhook activity.
Securing Datadog Webhook Communications
Protecting webhook endpoints is critical to prevent unauthorized access and maintain data integrity. Without adequate security, malicious actors could send fake alerts or exploit sensitive operational data.
How to Validate Webhook Signatures
Since Datadog doesn’t offer native webhook signature verification, you’ll need to create your own methods for validating incoming requests.
One simple approach is to use basic HTTP authentication by modifying your endpoint URL. However, for a more secure solution, consider implementing a custom signature validation system. This involves generating a unique signature for each webhook request using a secret key shared exclusively between your system and Datadog. Validate every incoming request against this signature before processing any data to ensure it originates from a trusted source.
Using HTTPS and IP Restrictions
Always use HTTPS to secure webhook communications. This ensures that data transmitted between Datadog and your endpoint is encrypted. Make sure your endpoints are configured with up-to-date SSL/TLS certificates for this purpose.
Additionally, implement strong secret management practices to further safeguard your webhook communications. Restrict access by whitelisting specific IP addresses or ranges associated with Datadog to block unauthorized requests.
Managing Shared Secrets and Credentials
Once encrypted channels are in place, maintaining the security of shared secrets and credentials becomes essential. Rotate secrets regularly - every few months or immediately after a security incident - to minimize the risk of exposure.
Avoid embedding secrets directly in your code or configuration files. Instead, use dedicated secret management tools or securely configured environment variables. Apply fine-grained access controls to ensure that only authorized team members can access webhook credentials. Store secret keys in secure locations, separate from application code and logs. Use strong hash functions like SHA-256, and opt for dynamic secrets whenever possible to reduce the risks tied to credential reuse.
Establish organization-wide policies requiring strong password complexity and approved encryption algorithms. Conduct regular audits of secret access to maintain accountability. Always transmit secrets over TLS-encrypted channels - never in plaintext - and implement tamper-resistant audit logging to track all secret-related activities, including requests, approvals, usage, expirations, and updates.
Processing Alert Data with Webhooks
Turn raw alert data into actionable insights by effectively mapping and standardizing alert details.
Mapping Datadog Alerts to External Systems
To process alerts successfully, it's crucial to create consistent mappings between Datadog's alert structure and the format your external tools expect. Each system has its own requirements, and mismatched field names or improperly formatted data can lead to alerts being ignored or misprocessed.
Start by identifying the key fields your external systems require. Most incident management tools need details like the alert title, severity level, timestamp, and affected resource. Datadog provides a wealth of alert data, but you’ll need to extract and transform the relevant pieces to match the needs of each destination system.
Datadog’s template variables, such as {{host.name}} or {{service.name}}, can automatically populate alert details based on the resource that triggered the alert. This eliminates the need for multiple monitors and ensures consistent formatting, which speeds up and improves the reliability of incident response.
"A Multi Alert monitor triggers individual notifications for each entity in a monitor that meets the alert threshold." - Datadog Documentation
Dynamic alert routing using tags is another powerful tool. When new resources are added, tags ensure they inherit proper mappings automatically. For example, you can configure notification policies to route alerts based on severity, source, or tags. Critical production alerts might go straight to PagerDuty, while lower-priority warnings from development environments could be sent to Slack channels. This approach ensures the right teams get the right alerts without being inundated with unnecessary notifications.
Once you’ve mapped alerts accurately, focus on standardizing their payloads to ensure they’re processed consistently by external systems.
Standardizing Payloads for Better Processing
After mapping alerts, standardizing the payload is essential for consistent and error-free processing. Raw webhook payloads often include extra metadata that isn’t needed. Simplify these payloads to include only the essentials, such as alert status, affected resources, metric values, and timestamps.
To make this work seamlessly across systems, design your webhook processing around uniform event types and payload structures. Create a schema that all systems can interpret, regardless of the original Datadog alert type. For instance, you might normalize severity levels (e.g., converting Datadog's "warn" to "medium" in your system) or standardize timestamp formats to match your tools' requirements.
When processing alerts, ensure all related data writes happen as a single transaction. For example, if processing an alert involves creating incident tickets, assigning teams, and setting escalation schedules, treat these as atomic operations. This prevents partial updates that could leave your systems in an inconsistent state.
To avoid duplicate incidents, design your webhook processing to be idempotent. Datadog may resend the same alert multiple times due to network retries or other issues. Your logic should detect and handle duplicates, ensuring you don’t create multiple incidents or send redundant notifications.
A healthcare provider highlighted in a case study from Scaling with Datadog for SMBs showed the benefits of optimizing alert processing. By implementing snooze rules, they cut nightly pager alerts from 12 to just 2. Combined with their Slack-Datadog API integration, they achieved a 35% reduction in Mean Time to Resolution (MTTR).
Thoroughly test your payload processing against various scenarios, including different alert types, edge cases, and malformed data. This ensures your system can handle unexpected situations, such as missing or incorrectly formatted fields, without breaking.
Finally, set up robust logging and monitoring for your webhook processing pipeline. Track metrics like processing times, failure rates, and data transformation accuracy. These insights help you spot bottlenecks and ensure your alert processing remains reliable as your infrastructure scales.
Monitoring and Improving Webhook Performance
Keeping a close eye on webhook performance is crucial to avoid bottlenecks and failures. As your infrastructure evolves, continuous monitoring ensures your systems stay reliable and responsive. This builds on earlier discussions about secure configurations and dependable processing, emphasizing the importance of proactive alerting.
Tracking Webhook Delivery Success
Monitoring how well your webhooks are delivered can help you spot potential issues before they affect your operations. By defining clear metrics, you can track every step of your webhook pipeline and address problems quickly.
Custom DogStatsD metrics are a great way to measure delivery success rates, response times, and error types. These metrics allow you to set up alerts for unusual spikes or delays. Focus on key indicators like:
- Delivery success percentage
- Response times
- Retry attempts
- Failure types
For instance, an engineering team used DogStatsD to classify webhook errors into categories like "Retryable" and "Immediate Alert" to streamline their response process.
Datadog monitors can further enhance your alerting capabilities. For example, you can configure thresholds to trigger alerts when error rates increase or when response times surpass acceptable limits.
Logging and Auditing Webhook Activity
Detailed logging creates an audit trail that’s invaluable for troubleshooting and compliance. Unlike standard application logs, webhook audit logs should be treated as secure, unalterable records that document all webhook-related events.
"Audit logs are immutable records that describe a system's changes over time. Each event and attempt that occurs should be captured in a log stating what happened, the time it occurred and the users that were involved." - James Walker
Audit logs should capture critical details, such as configuration changes, data modifications, and failed authentication attempts. This level of detail is essential for investigating security incidents and reconstructing events.
Centralized log management makes it easier to search, filter, and analyze webhook activity. Use filters like user email, API Key ID, or HTTP method (e.g., POST, GET, DELETE) to quickly locate specific events during troubleshooting.
To protect sensitive information, restrict access to audit logs to authorized personnel and consider encrypting any data that includes personally identifiable information or other confidential details. Since audit logs are often retained for extended periods - sometimes indefinitely - they must be managed with compliance in mind.
Given the sheer volume of log data some organizations generate (terabytes per day), it’s important to focus detailed logging efforts on critical webhook endpoints and high-priority events. This approach balances thoroughness with resource efficiency.
Updating Configurations Over Time
Good logging practices also help you refine your webhook configurations over time. Webhooks aren’t a "set-it-and-forget-it" system. Regular reviews and updates are essential to keep them running smoothly as your infrastructure and business needs change.
Schedule quarterly reviews with key teams to ensure monitoring strategies and thresholds align with current requirements. During these reviews, analyze metrics like delivery success rates, response times, and error patterns to identify areas for improvement. Adjusting alert settings during these sessions can also reduce alert fatigue, helping teams focus on what matters most.
Organized tagging strategies can significantly improve efficiency. For example, organizations that implement effective tagging report a 40% boost in operational performance. Similarly, well-crafted dashboards can enhance situational awareness by 50%, while custom dashboards can cut incident response times by 40%.
As your system grows, proactive alert systems are essential for avoiding major downtime incidents. When adding new services or modifying existing ones, make sure to update your webhook configurations. This includes revising payload formats, tweaking retry logic, and modifying routing rules to accommodate new integration needs. Keeping your configurations up to date ensures your webhooks remain reliable and adaptable.
Key Takeaways
When it comes to Datadog webhooks for SMBs, three main principles stand out: reliability, security, and continuous improvement. These elements create the backbone of a webhook system that can grow alongside your business.
Reliability depends on solid retry mechanisms. Leverage Datadog's built-in retries and exponential backoff to handle failed requests effectively. Adding manual redelivery options and background processing ensures your endpoints remain responsive.
Security is critical. Use HMAC to validate webhook signatures and verify trusted origins. Secure communication through HTTPS and implement IP restrictions to safeguard your system. Rotate shared secrets regularly and reject invalid requests immediately to maintain secure operations.
Continuous monitoring shifts your approach from reactive to proactive. By tracking delivery rates, response times, and error patterns with DogStatsD metrics, you can address issues before they escalate. Keep immutable audit logs for deeper insights and to streamline problem resolution.
For SMBs, treating webhooks as dynamic systems is key. Regular reviews, effective tagging, and updated dashboards ensure your infrastructure stays aligned with operational goals. With this approach, webhooks evolve into an integral part of your monitoring strategy, helping you respond to incidents faster and manage alerts more efficiently across your tech stack.
These takeaways highlight a comprehensive strategy for improving alert management using Datadog webhooks.
FAQs
What are the best ways to secure my Datadog webhooks and prevent unauthorized access?
To keep your Datadog webhooks secure and prevent unauthorized access, follow these important steps:
- Verify requests with HMAC signatures: Use HMAC signatures to check the integrity of incoming requests and confirm they originate from trusted sources.
- Restrict access with policies: Set up access control policies to limit who can view or modify your webhooks.
- Protect your API credentials: Store your API credentials securely and use Datadog’s security tools to monitor for any unusual activity.
These steps can help you strengthen the security of your webhook endpoints and reduce the risk of unauthorized access.
How can I customize webhook payloads in Datadog to work effectively with different integration platforms?
To tweak webhook payloads in Datadog, you can use the custom payload feature within your webhook settings. This lets you craft payloads in JSON format, giving you the flexibility to match the data structure to the needs of different platforms.
By tailoring the payload content, you can ensure smooth integration, make incident management more efficient, and simplify alert handling across multiple tools. Be sure to include only the most important details in your payload to keep things clear and efficient.
What are the best practices for handling webhook delivery failures in Datadog to ensure reliable alert notifications?
When dealing with webhook delivery failures in Datadog, using exponential backoff for retries is a smart strategy. This method gradually increases the delay between retry attempts after each failure, with a maximum delay typically set between 8 and 12 minutes. It’s a practical way to handle temporary issues without putting excessive strain on the receiving system.
On top of that, keep an eye on webhook error rates by setting up monitoring and automated alerts. This allows you to quickly spot and resolve persistent problems. Together, these methods help maintain dependable alert notifications, even when hiccups occur.

