Best Practices for Datadog Workload Forecasting
Explore effective strategies for workload forecasting using advanced data analysis and machine learning to optimize resource management and reduce costs.
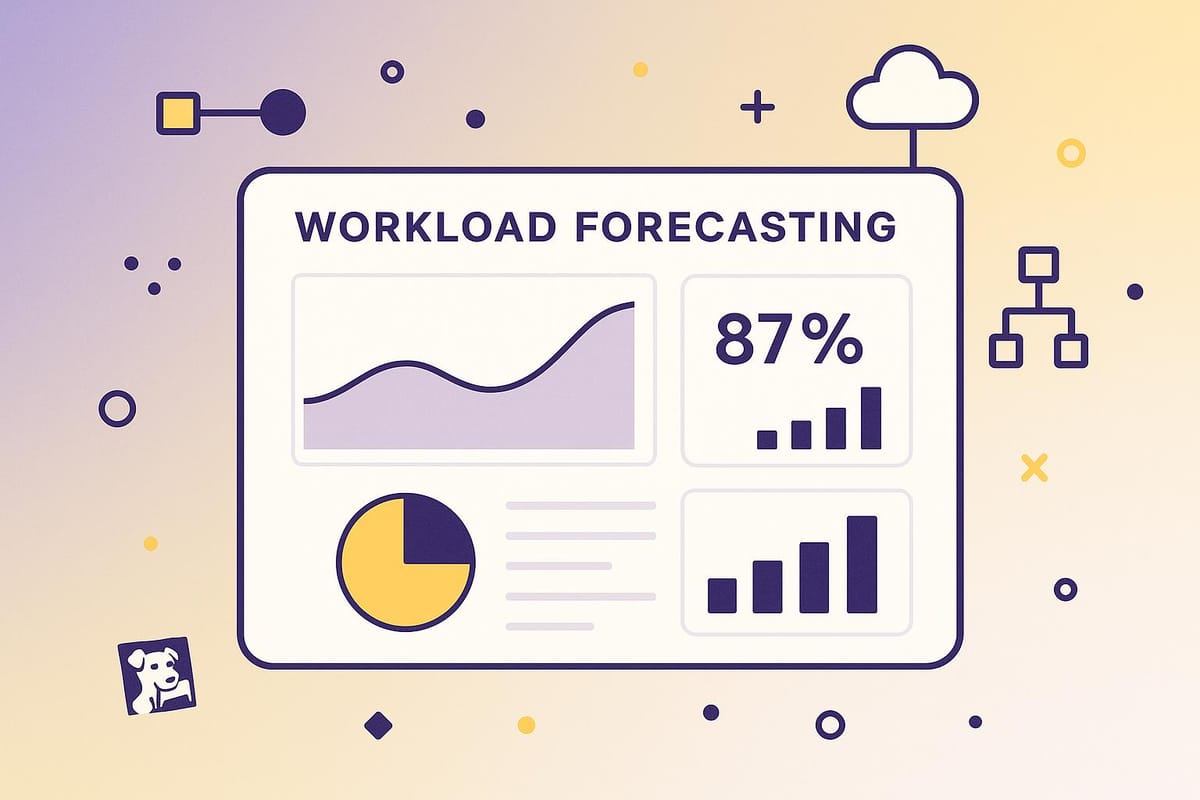
Efficient workload forecasting can save your business money, prevent burnout, and improve productivity. For small and medium-sized businesses (SMBs), Datadog offers tools to predict work demands using machine learning and historical data. Here’s what you need to know:
- Why it matters: Poor forecasting leads to overstaffing (wasted costs) or understaffing (burnout, lost opportunities).
- How Datadog helps: Leverages trillions of data points to analyze trends, detect anomalies, and predict future workloads.
- Key principles:
- Use historical data to find trends.
- Recognize patterns with Datadog’s machine learning.
- Factor in external events like holidays or market conditions.
- Tools to set up:
- Track critical metrics (CPU, memory, network).
- Configure alerts and anomaly detection.
- Use predictive autoscaling to match resources with demand.
Datadog simplifies forecasting with dashboards, integrations, and AI-driven insights, helping SMBs scale efficiently while managing costs. Start by monitoring key metrics and continuously refine your forecasts for better accuracy.
How Datadog is Transforming Time Series Forecasting with Toto | Ray Summit 2024
Core Principles of Workload Forecasting
Workload forecasting relies on three key principles that help businesses make informed, data-driven decisions. By understanding these principles, small and medium-sized businesses (SMBs) can move beyond guesswork and improve how they allocate resources and plan for capacity.
Analyzing Historical Data and Trends
Historical data is the backbone of effective workload forecasting. In fact, companies that use advanced forecasting techniques see a 23% boost in productivity and cut labor costs by 17%. By identifying recurring trends and fluctuations, businesses can establish reliable baselines for planning.
SMBs should gather detailed historical data, including workload metrics, performance benchmarks, and other relevant business indicators. Look for patterns such as seasonal trends, recurring spikes, or gradual shifts in baseline activity. These insights help businesses anticipate future demands.
A key tool in this process is time series analysis, which examines workload changes over time - whether weekly, monthly, or yearly. Many workloads follow predictable cycles, like higher activity on certain days of the week. Instead of focusing solely on averages, dig deeper into peak periods and unusual fluctuations. For example, identify what caused a sudden spike or drop and note any operational changes during those times. Tools like Datadog’s pattern recognition can refine these insights for even greater accuracy.
Using Datadog Metrics for Pattern Recognition
Datadog excels at turning raw data into actionable insights through its advanced pattern recognition capabilities. Its forecasting algorithms, trained on trillions of data points from hundreds of thousands of servers daily, can uncover patterns that might go unnoticed with manual analysis.
What sets Datadog apart is its ability to adapt. Its machine learning algorithms continuously adjust to changing metrics, ensuring that forecasts remain accurate as your business evolves. For example, Datadog automatically accounts for recurring patterns like daily or weekly fluctuations. This means your forecasts stay aligned with the natural rhythms of your operations.
Datadog also distinguishes itself by dynamically adjusting baselines. Unlike static methods, its algorithms analyze recent trends and adapt predictions as your business grows or changes. This ensures your forecasts remain relevant, even as your workload patterns shift.
Through Datadog’s dashboards, SMBs can combine historical trends with forward-looking insights. By correlating low-level technical metrics with broader business outcomes, businesses can pinpoint which metrics are the most predictive. This makes monitoring and forecasting efforts more precise and impactful.
Including External Factors
While internal data is critical, external influences also play a major role in shaping workload forecasts. Research shows that organizations using AI-powered forecasting tools achieve 31% higher accuracy compared to traditional methods, largely due to their ability to integrate external data sources.
External factors might include market conditions, industry trends, and broader economic indicators. For SMBs, this could mean accounting for holiday shopping seasons, regulatory changes, or industry-specific events like conferences or fiscal year-end cycles. For instance, a retail business needs to prepare for holiday surges, while a B2B service provider might adjust for industry events.
By combining internal data with external market indicators, businesses can improve forecast accuracy. The first step is identifying which external factors have the most significant impact on your workload. Monitor industry reports, economic trends, and other relevant data sources to find correlations with your business patterns.
The challenge lies in filtering out noise - factors that don’t meaningfully impact your operations. Start with the most obvious influences, such as seasonal patterns or known industry events, and gradually add more as you validate their importance.
| Forecasting Component | Key Focus Areas | Datadog Capabilities |
|---|---|---|
| Historical Analysis | Identifying trends, seasonal patterns | Time series analysis, automated pattern detection |
| Pattern Recognition | Correlating metrics, spotting anomalies | Machine learning, dashboard insights |
| External Factors | Market trends, economic shifts | Data integration, multi-source correlation |
Regularly updating your forecasting models is essential for maintaining accuracy. As you collect more data and compare predictions against actual outcomes, your understanding of both internal and external factors will improve. This ongoing refinement enables SMBs to use Datadog for precise forecasting, paving the way for better scaling and resource planning.
Configuring Datadog for Better Forecasting
Set up Datadog to transform raw data into actionable insights that help you anticipate capacity needs and address potential issues before they escalate.
Choosing the Right Metrics
To get the most out of Datadog, focus on tracking key metrics like CPU usage, memory consumption, network throughput, and disk I/O. Here's why these are essential:
- CPU usage: Measures how much processing power your system is using.
- Memory consumption: Shows how efficiently your system utilizes RAM.
- Network throughput: Highlights data transfer patterns, which can reflect user activity.
- Disk I/O: Acts as an early warning for performance bottlenecks, especially in database-heavy applications.
For a deeper understanding of user experience and system performance, include application-specific metrics like response times, error rates, and transaction volumes.
Datadog’s integrations simplify the process by consolidating monitoring data across systems, making it easier to focus on metrics that truly matter. Once you’ve identified the core metrics, configure targeted alerts to ensure you can manage capacity effectively and proactively.
Setting Up Alerts and Thresholds
Datadog uses monitors to track changes across your infrastructure, applications, or services. These monitors trigger alerts when a specific metric crosses a predefined threshold, ensuring your team can respond quickly to potential issues.
Here’s how to set up effective alerts:
- Define thresholds: For example, to monitor disk space, use the
system.disk.in_usemetric and configure an alert to trigger when disk usage exceeds 70%. - Use dynamic alerts: These adjust in real time to accommodate fluctuating conditions.
- Combine monitors: Group multiple monitors into composite alerts to reduce unnecessary notifications.
- Tag-based alerts: Use template variables and tags to customize alerts for different environments or server groups.
- Notification policies: Route alerts to the right teams for faster resolution.
For more advanced monitoring, go beyond fixed thresholds by enabling anomaly detection.
Using Datadog's Anomaly Detection
Datadog’s anomaly detection algorithms are designed to catch irregular patterns - like spikes in latency or unexpected error rates - that might not be flagged by standard threshold-based alerts.
By configuring anomaly detection, you can monitor for deviations that signal emerging issues or shifts in workload demands. Datadog’s AI-driven insights can help you identify root causes, such as sudden traffic surges or service performance drops.
The platform offers three algorithms tailored to different metric types - whether they’re volatile, seasonal, or stable. These tools help you detect issues early and improve forecasting accuracy, ensuring your systems are ready to handle evolving workloads.
Connecting Forecasts with Scaling Plans
Turning accurate forecasts into actionable strategies is key to maintaining a responsive infrastructure while keeping costs under control. With Datadog, you can translate workload predictions into scaling plans that adapt to demand changes seamlessly. Automating workflows ensures your system stays ahead of fluctuations.
Setting Up Predictive Autoscaling
Datadog's Kubernetes Autoscaling takes the guesswork out of resource management by automatically adjusting infrastructure based on both historical data and future demand predictions. Start by configuring horizontal autoscaling to scale the number of nodes and vertical autoscaling to adjust resources within existing nodes. By analyzing past resource usage, Datadog identifies patterns and anticipates future capacity needs.
Set up autoscaling triggers using critical metrics like CPU usage, memory, and response times, while steering clear of data that doesn’t accurately reflect demand. To strike a balance between performance and cost, define minimum and maximum scaling thresholds. For applications with predictable traffic surges, scheduled scaling can be configured to handle these peaks efficiently.
When designing your applications, consider microservices architecture and statelessness, as these make scaling more manageable. NoSQL and read-only databases often scale horizontally more effectively than traditional relational databases. Datadog’s autoscaling also features gradual adjustments and safeguards to minimize performance dips during scaling events. For significant resource changes, enabling human-in-the-loop approvals can provide an extra layer of control.
Once your autoscaling is in place, ensure it aligns with your cost management goals to maintain a balance between performance and expenses.
Managing Cost and Performance Trade-offs
Datadog’s usage-based pricing model can lead to rising costs as you scale, making cost management a priority - especially for SMBs. Charges are based on infrastructure monitoring per host, trace analysis per trace, and log management per ingested log. Leverage Datadog’s cost attribution tools to track expenses across teams and pinpoint resource-heavy workloads. This insight helps you evaluate whether the performance of these workloads justifies their cost.
Focus on workloads that are consistently over-provisioned, as identified through historical data. These are prime candidates for cost savings without sacrificing performance. Gradually reduce resources for these workloads while keeping a close eye on their performance metrics.
For applications with predictable traffic patterns, cyclical scaling can help. Configure autoscaling schedules to reduce resources during off-peak times and ramp up before demand increases. Start with basic monitoring for your most critical servers and applications, and then expand to features like log monitoring and custom alerts as your needs grow. This step-by-step approach keeps costs manageable while building a robust monitoring framework.
Use Datadog dashboards to monitor usage, including metrics ingestion, trace analysis, and log volumes. Set up alerts to notify you when usage approaches budget limits, helping you avoid unexpected charges. Additionally, Datadog’s Watchdog AI can automatically detect performance or security issues, cutting down on manual monitoring efforts and ensuring timely responses to potential problems.
Improving Forecasting Accuracy Over Time
Forecasting needs to adapt as workload patterns shift. Continuous refinement works hand-in-hand with Datadog's dynamic monitoring tools, which assess forecast performance and fine-tune predictions to keep up with changing demands.
Measuring Forecast Accuracy
One of the key ways to evaluate the reliability of forecasts is by using Mean Absolute Percentage Error (MAPE). This metric reflects the average prediction error. For example, a MAPE of 20% means the forecast deviates from actual results by an average of 20% over time. By tracking MAPE across different time frames and workload categories, you can identify weak spots in your forecasts and set industry-specific thresholds for acceptable accuracy.
In addition to MAPE, monitoring data drift metrics is essential. These metrics help detect changes in input distributions, while prediction drift metrics track variations in model outputs. Backtesting - comparing forecasts with actual outcomes - further enhances reliability. For models like recommendation systems, techniques such as Jensen–Shannon divergence can identify data drift by comparing recent input data to the original training dataset. To ensure input consistency, implement data validation tests and monitor for schema changes.
These strategies provide actionable insights to fine-tune your forecasting models effectively.
Adjusting Models Based on Results
Once you’ve measured forecast performance, it’s time to adjust your models for better accuracy. If metrics like MAPE or data drift reveal misalignment, update your models accordingly. Datadog’s forecasting algorithms use machine learning to analyze recent trends and recalibrate predictions as metrics shift.
For a deeper understanding of model performance, compare MAPE with other metrics like Mean Absolute Error (MAE) or Root Mean Square Error (RMSE). Persistent inaccuracies may signal the need to rethink your forecasting approach or explore alternative modeling methods to close the gap between predictions and actual results.
Integrating forecasts into Datadog dashboards adds another layer of utility. This allows you to merge historical data with future projections, creating a comprehensive view. Forecast alerts can notify your team of potential issues before they escalate, enabling quick, proactive responses. Additionally, Datadog’s centralized platform combines log management, event data, custom metrics, and alerts in one place. This unified view makes it easier to spot patterns across models and uncover areas for improvement in your machine learning workflows.
Conclusion: Getting the Most from Datadog for SMBs
Datadog combines monitoring, performance tracking, and predictive analytics into one streamlined platform, making cloud resource management much simpler. By unifying these tools, it reduces the need for juggling multiple systems and cuts down on operational headaches.
The financial benefits are clear. In 2024, Finout leveraged Datadog to uncover cost-saving opportunities, achieving a 30% reduction in expenses. Meanwhile, Resume Points used the platform to track spending across various cloud providers, slashing their cloud costs by 20%. These examples highlight how effective forecasting not only prevents downtime but also makes a noticeable difference to your bottom line.
Datadog’s Watchdog anomaly detection uses AI to spot patterns and predict seasonal trends, automating much of the forecasting process. With over 850 integrations available, the platform adapts to your needs - whether you're monitoring a simple website or managing a complex, multi-cloud setup. This level of intelligence helps businesses scale efficiently while keeping costs in check, creating a solid foundation for growth.
The key to success lies in focusing on the right metrics and setting up proactive alerts. Start with Infrastructure Monitoring Pro at $15 per host/month, and expand to include APM and log management as your needs evolve. Regularly update your models based on real performance data to ensure your forecasts remain accurate and actionable.
For SMBs looking to move past reactive problem-solving, Datadog offers the tools to make smarter, data-driven decisions. It’s a powerful ally in building infrastructure that supports growth while staying cost-efficient.
FAQs
How does Datadog use machine learning to improve workload forecasting for SMBs?
Datadog uses machine learning to take workload forecasting to the next level. By sifting through massive amounts of historical data and spotting patterns, it delivers highly precise predictions about future performance. This helps small and medium-sized businesses (SMBs) tackle potential problems before they disrupt operations.
A key feature making this possible is Datadog's Time Series Optimized Transformer (Toto) model. Built specifically for high-frequency time series data, this model excels at identifying anomalies, seasonal trends, and usage patterns. The result? Reliable forecasts that help businesses scale efficiently and keep systems running smoothly. With these predictive insights, Datadog equips companies to stay ahead in fast-changing cloud environments.
What external factors should small and medium-sized businesses (SMBs) consider for accurate workload forecasting with Datadog?
When leveraging Datadog for workload forecasting, small and medium-sized businesses (SMBs) should pay close attention to historical usage trends, seasonal fluctuations, and anticipated business growth. These elements are key to predicting changes in demand and ensuring resources are allocated effectively.
It’s also important to keep an eye on user traffic patterns, particularly during holidays, special promotions, or major events - times when unexpected surges can occur. By incorporating these variables into your planning, you’ll be better equipped to manage capacity, avoid overprovisioning, and control costs, all while ensuring your system continues to perform smoothly.
How can small and medium-sized businesses (SMBs) balance cost and performance when using Datadog's predictive autoscaling features?
To manage costs effectively while maintaining performance with Datadog's predictive autoscaling, small and medium-sized businesses (SMBs) should focus on a few smart strategies.
Define autoscaling policies that match real-time needs. Instead of depending on historical averages, set policies that respond to live workload demands. This way, resources are scaled up or down only when necessary, helping you avoid overspending while still handling peak performance periods.
Use Datadog's monitoring tools to track live metrics. Keeping an eye on real-time performance data and trends allows you to adjust scaling thresholds and resource allocation as needed. Regularly reviewing this information ensures you're only paying for the resources your business actively uses, striking the right balance between cost efficiency and performance.

