
Best Practices for Optimizing Workflow Data in Datadog
Learn how to optimize workflow data in Datadog to enhance system performance, manage costs, and streamline incident management effectively.
Optimizing workflow data in Datadog can save you money, improve system performance, and make incident management easier. Here’s what you need to know:
- Organize with Tags: Use clear, simple tags to categorize data. Avoid high-cardinality tags like user IDs or version numbers to reduce costs.
- Control Data Volume: Filter out unnecessary logs, sample high-volume data, and focus on collecting only critical metrics.
- Use Datadog Tools: Features like Observability Pipelines, log filtering, and usage dashboards help manage data efficiently.
- Improve Alerts and Dashboards: Prioritize actionable alerts to reduce noise, and design dashboards that highlight key metrics for faster decision-making.
- Reduce Costs: Regularly review usage, adjust logging levels, and avoid over-collecting data. This can save 15–25% monthly.
These steps help SMBs manage Datadog effectively without needing advanced technical skills. Keep refining your setup to align with your business needs.
L05.3 - Logging Without Limits: Advanced Cost Optimization Techniques in Datadog
How Workflow Data Volume Affects Datadog Performance
Uncontrolled workflow data can seriously impact performance and delay incident response times. When data grows without limits, it leads to performance bottlenecks that hinder your team's ability to manage incidents and maintain system reliability. Here's a closer look at how Datadog handles various data types and the challenges that come with them.
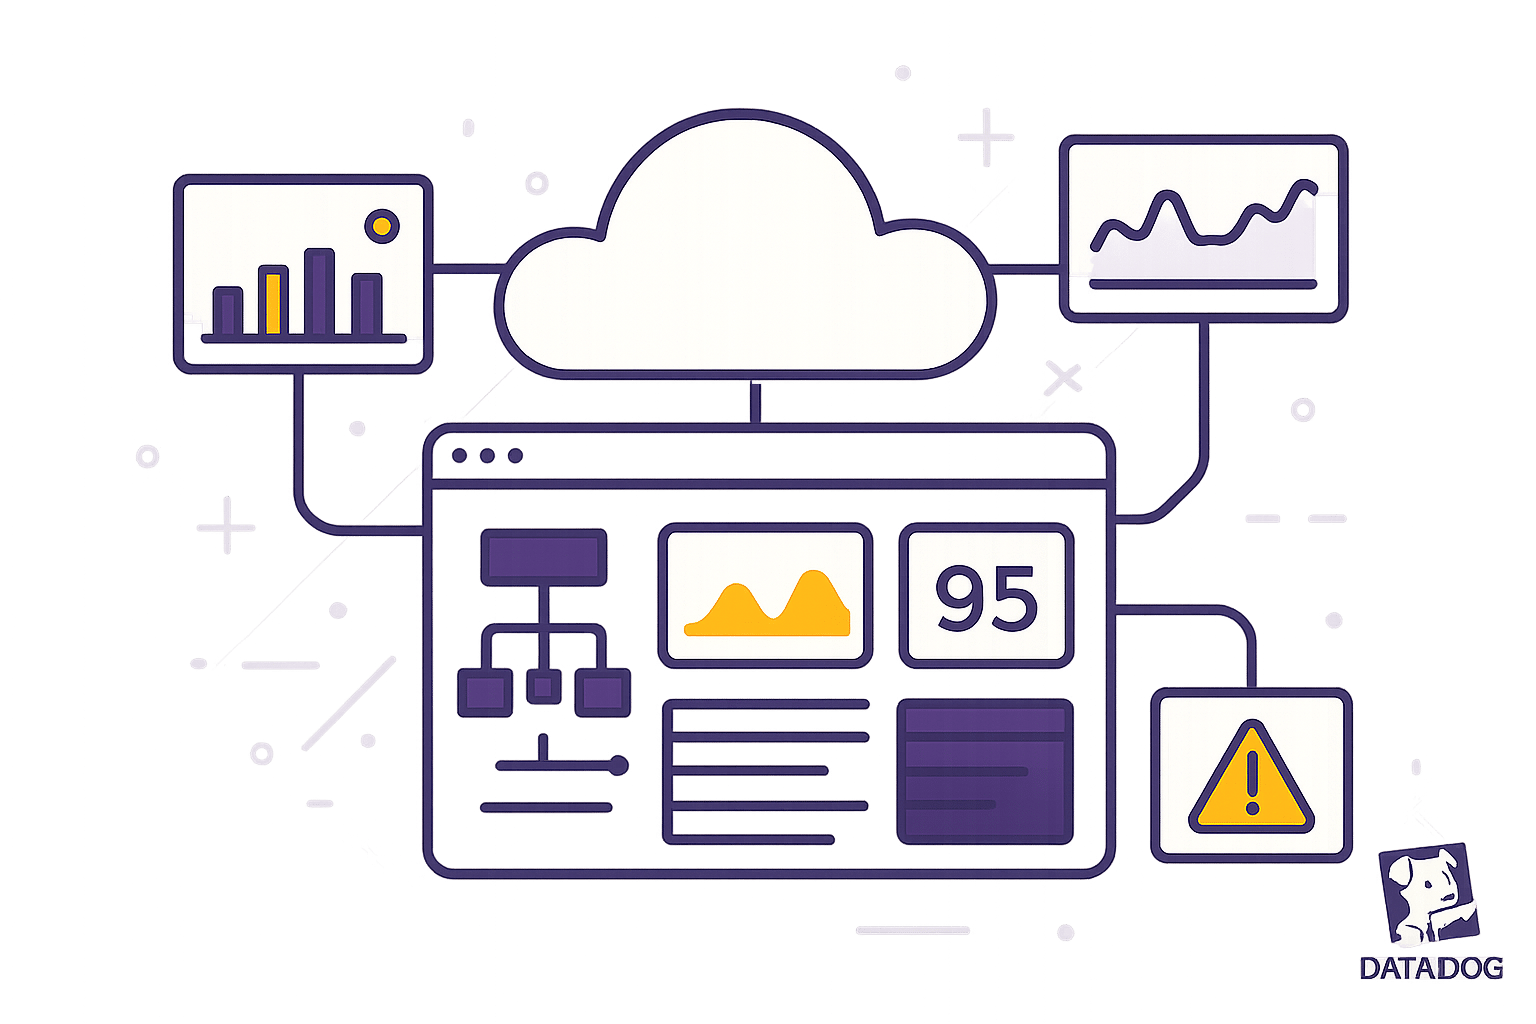
How Workflow Data Works in Datadog
Datadog processes three main types of data: metrics, logs, and traces - each with unique volume and cost considerations. For instance:
- Unsampled traces can generate up to five times more volume than logs.
- Sampled traces produce about twice the volume of logs.
- Metrics and traces are billed per host, while logs are priced at $0.10/GB for ingestion. Retention costs range from $1.06/GB for three days to $2.50/GB for 30 days of storage.
Data Volume Challenges for SMBs
For small and medium-sized businesses (SMBs), excessive data volume can amplify both cost and performance issues. Logs, in particular, can grow rapidly - sometimes increasing by 200–300% year-over-year - putting a strain on budgets. Low-value logs, like redundant error messages or verbose debugging details, not only drive up storage expenses but also slow down investigations.
High-cardinality tags pose another problem. Each unique tag combination inflates metric volumes, which can lead to noticeable performance degradation. For example, overly complex queries can slow down dashboard load times, delaying access to critical insights during incidents. This is especially challenging for SMBs, where data scientists reportedly spend 50%-80% of their time just preparing data.
One payment service team faced this issue firsthand. Their log volume skyrocketed due to redundant error messages, excessive debugging logs, and unnecessary user logs. By grouping identical errors, adjusting log levels, sampling data, and filtering out nonessential logs, the team managed to cut their log volume by 50%.
Datadog's Built-in Optimization Features
Datadog provides several tools to help manage and optimize data volumes effectively:
- Datadog Observability Pipelines: This feature pre-processes logs before sending them to higher-cost destinations, reducing overall data volume and improving the value of the logs.
- Log Filtering and Sampling: The platform offers built-in tools to filter and sample logs, generate metrics from logs, and set rule-based quotas. These measures prevent sudden data surges from impacting budgets or performance.
- Usage Attribution and Dashboards: Datadog includes tools like Usage Attribution and an estimated usage dashboard for Log Management. These provide detailed insights into logging costs, helping identify the sources driving up data volume.
- Flexible Indexing Options: Users can choose between Standard Indexing, archiving, or Flex Indexing based on specific use cases. This flexibility ensures storage costs align with how different log types are used. Additionally, features like Logging Without Limits™ and Flex Logs allow organizations to control storage costs without sacrificing fast query performance.
Best Practices for Managing Workflow Data Volume
Keeping data volume in check is crucial for managing costs and maintaining performance in tools like Datadog. By implementing smart tagging, strategic data collection, and preemptive filtering within pipelines, small and medium-sized businesses (SMBs) can strike a balance between cutting costs and capturing essential insights from their infrastructure and applications.
Using Tags to Organize Data Effectively
Tags are the foundation of data organization. These key:value pairs or simple values provide essential context to your application performance data and infrastructure metrics. Datadog makes this process easier by automatically importing tags from platforms like AWS and Kubernetes, which supply basic tags and labels without requiring manual setup. For example, AWS and Kubernetes tags can instantly categorize data by environment or application.
Beyond these automatic tags, you can add custom ones using the Datadog Agent's configuration file (datadog.yaml) or other integration files. Adding tags that reflect your environment, services, and business-specific needs can streamline data organization, making it easier to scale operations and make informed decisions. With well-structured data, subsequent collection and optimization efforts become far more efficient.
Optimizing Metric and Log Collection
Efficient data collection is a game-changer for reducing costs and improving system performance. Since Datadog Log Management costs $0.10 per GB ingested, it’s essential to focus on collecting only the most valuable data. Begin by applying retention filters to weed out low-priority logs, like heartbeats or debug messages, before indexing them. Exclusion filters can block non-essential logs from development and testing environments, while log sampling can help manage high-volume services. Typically, only 10–30% of logs (like Error, Warning, or Critical logs) are critical, while the rest are less significant. For older or less-important logs, consider moving them to more budget-friendly storage options like Amazon S3 or OpenSearch to save on retention costs.
When it comes to metrics, controlling high-cardinality tags is a must to avoid unexpected cost spikes. Reducing the number of unique tag combinations, consolidating redundant metrics, and auditing unused metrics are effective ways to keep things streamlined. You can also pre-aggregate high-frequency metrics at the source and use rollups to retain only essential summaries for longer periods. Other cost-saving strategies include shutting down non-production workloads during off-hours, consolidating workloads with similar usage patterns, and fine-tuning Kubernetes deployments by adjusting pod density and limiting metric collection to critical namespaces. These steps ensure you're only paying for what truly matters.
Leveraging Datadog Observability Pipelines
Datadog Observability Pipelines offer a centralized way to manage data ingestion, giving you the tools to refine, enrich, and tag telemetry data before it enters the platform. This pre-processing step helps reduce data volume while improving quality and security. For instance, pipeline filtering can remove irrelevant data before ingestion, and sampling can lower the volume of high-cardinality data without compromising statistical accuracy. Redaction features allow you to strip sensitive information, ensuring compliance with privacy regulations. Additionally, generating metrics from logs provides aggregated insights without needing to store verbose data.
Sampling is particularly useful for managing high-cardinality data, while setting quotas can prevent cost surges during unexpected spikes or system anomalies. Observability Pipelines integrate seamlessly with sources like the Datadog Agent, Amazon S3, and Kafka. They also include processors - such as filters, samplers, and remappers - that can route data to the most cost-effective storage solutions.
Improving Workflow Performance with Datadog
Once you've streamlined your data and optimized its collection, the next step is turning those insights into actionable strategies. Effective workflow performance goes beyond just gathering data - it's about using that information to address potential issues before they disrupt your customers.
Smart Alerting and Anomaly Detection
Managing alerts can get tricky as systems grow, especially for small and medium-sized businesses. One common mistake is setting up alerts that frequently toggle between states without indicating real problems. For instance, an alert for disk usage exceeding 90% might constantly switch between ALERT and OK due to temporary spikes from automated backups or large file transfers. These fluctuations, while noticeable, often aren't critical.
To avoid this, prioritize your alerts based on their urgency:
- High-priority alerts (like service outages or security breaches) demand immediate attention, no matter the time of day.
- Moderate-priority alerts (such as performance slowdowns or storage nearing capacity) can wait until regular business hours.
- Low-priority alerts (like non-critical warnings or trend updates) can be reviewed the next business day.
| Priority Level | Response Time | Example Triggers |
|---|---|---|
| High | Immediate (24/7) | Service outages, security breaches |
| Moderate | Business hours | Performance issues, storage at 80% |
| Low | Next business day | Non-critical warnings, trend analysis |
Grouping related notifications and using conditional variables to route alerts to the right teams can significantly cut down on redundant notifications. Datadog also reduces noise by automatically muting alerts for terminated resources (like autoscaled instances on Azure, AWS, or Google Cloud) and allowing scheduled downtimes during planned maintenance windows.
This approach ensures your alerts are meaningful and actionable, setting the stage for better insights through dashboards.
Creating Better Dashboards and Visualizations
Dashboards are your window into system health, turning raw data into visual narratives that guide decisions. The right visualizations make spotting problems faster and easier.
Start by using flexible templates to create dynamic dashboards. Instead of building separate dashboards for every environment or service, use template variables to filter data dynamically. This allows you to switch between production, staging, or other environments with ease.
Organize your data for clarity. Avoid cramming too much information into one view. Instead, group related metrics into categories like "Application Performance", "Infrastructure Health", or "Business Metrics" to make dashboards more readable and helpful during incident response.
Choose the right visualization for the job:
- Line graphs: Great for tracking single metrics over time.
- Stacked graphs: Useful for showing totals and individual contributions.
- Bar charts: Ideal for counts or sparse data.
- Heat maps: Perfect for visualizing single metrics across multiple groups.
For executive reporting and storytelling, use Screenboards with contextual imagery. Timeboards, on the other hand, are better suited for troubleshooting and deep dives into specific data points.
Focus on metrics that directly impact business outcomes, like throughput (requests per second), success rates (percentage of successful transactions), error rates, and latency (API response times). Avoid vanity metrics that don't drive meaningful action.
By keeping your dashboards actionable and clear, you can seamlessly integrate them into your development workflows for continuous improvement.
Connecting Datadog with Development Workflows
Integrating Datadog into your CI/CD pipelines creates a feedback loop that enhances both system performance and developer efficiency. With Datadog's CI/CD Pipeline Visibility, teams can monitor and fine-tune pipeline performance. Features like flame graphs let you visualize pipeline executions, with each job displayed as a span. You can also filter logs tagged with status:error to quickly identify problem areas.
Proactive monitoring becomes easier when you track job durations over time and compare them to benchmarks for your default branch. This helps you identify and address performance regressions early. By linking performance issues to commits, error logs, and infrastructure data, developers gain the context they need to fix problems quickly.
A dedicated dashboard highlighting key CI/CD components and common failure points can simplify troubleshooting. Running basic "dial tone" checks to verify infrastructure health and setting up monitors for potential configuration issues - like missing parameters that could cause endpoint errors - can catch problems before they escalate.
Historical tracking also lets you measure the impact of optimizations, such as parallelizing jobs or reducing queue times. Commit-centric dashboards and automatic GitHub comments improve transparency around deployment quality and system health. Advanced tools like Intelligent Test Runner, Quality Gates, and Static Analysis further streamline testing, reducing manual effort while maintaining high reliability.
Cost Management and Data Efficiency for SMBs
Managing costs effectively isn’t just about controlling spending - it’s also about improving how your systems operate. For small and medium-sized businesses (SMBs), Datadog’s monitoring tools can get pricey fast if you’re not careful. Log volumes, for instance, tend to grow by 200–300% annually for most organizations unless actively managed. That’s why keeping a close eye on costs is so important.
Let’s break it down. Datadog’s pricing structure includes several components: Infrastructure Monitoring at $15 per host each month (billed annually), APM at $31 per host per month, Log Management at $0.10 per GB ingested, and other usage-based custom metrics. Businesses that establish formal monitoring governance often save 30–40%. That’s a big difference, showing how crucial it is to have structured cost management practices in place from the start.
Avoiding High-Cardinality Tags
Once you understand Datadog’s pricing, the next step is tackling cost drivers like high-cardinality tags. These tags can quietly inflate your bill. Why? Each unique combination of tags creates a separate metric series, which can cause costs to skyrocket. For example, tagging metrics with specific version numbers like version:2.5.7234 generates far more metric series than using broader tags like version:2.
To keep costs under control, limit high-cardinality dimensions such as IDs, timestamps, and specific version numbers. Instead of tracking something as granular as per-user latency, consider grouping data by broader categories like per-region latency. Similarly, avoid tagging metrics with user IDs or session tokens - instead, group users by subscription level or geographic location. To prevent tag sprawl, create allowlists for approved tags and establish clear guidelines about which dimensions are truly necessary for troubleshooting. Regular audits to remove unused tags can also help you stay on top of metric cardinality.
Datadog’s Metrics without Limits feature is another tool to cut costs. It allows you to collect all metrics but index only the tags you actually need for analysis. Many customers using this feature have reduced custom metric usage by up to 70% without sacrificing visibility.
Regular Usage Reviews and Cost Controls
Scheduled usage reviews are one of the easiest ways to save money - businesses often uncover 15–25% in savings this way.
Make it a habit to review your Datadog invoices every month. This helps you spot areas where costs are creeping up unnecessarily. Use Datadog’s usage attribution tools to see which teams or services are driving costs, so you can focus optimization efforts where they’ll have the most impact. Setting up usage alerts is another smart move. For instance, you can configure notifications to flag when log ingestion exceeds expected thresholds or when custom metric usage grows unexpectedly. This gives you time to investigate and adjust before costs spiral out of control.
Another quick win? Adjust your logging levels. Switching from DEBUG to INFO for production environments can cut log volumes by 70–80%. You can also use log retention filters to exclude development and test logs that don’t need long-term storage. For non-production workloads, consider scheduling them to shut down during off-hours - this simple adjustment can significantly reduce data ingestion costs, particularly for staging and development environments that don’t need round-the-clock monitoring.
Comparing Data Reduction Methods
Different strategies for reducing data come with their own pros and cons. Here’s a quick breakdown:
| Method | Pros | Cons |
|---|---|---|
| Log Filtering | Cuts storage costs dramatically | Risk of losing useful troubleshooting data |
| Sampling | Balances cost and performance | Requires careful setup |
| Metric Limiting | Simplifies dashboards | Potential loss of detailed insights |
Log filtering is straightforward: remove non-essential logs like verbose debug messages, routine health checks, or automated system processes. Just make sure you don’t filter out logs that might be critical during an incident. Sampling offers a balanced approach - capture 100% of error traces while sampling successful requests at lower rates. This keeps costs down while retaining enough data to solve problems. Metric limiting focuses on consolidating redundant metrics and capping the number of metrics per service. Use Datadog’s Metric Summary page to identify metrics that haven’t been queried recently and eliminate unnecessary ones.
The best results often come from combining these methods. Start with log filtering for immediate savings, then implement sampling for high-volume services, and finally optimize your metric collection to avoid waste. Together, these strategies can help you manage costs effectively while still maintaining the insights you need.
"Best practices are important, but there's no substitution for real measurement and cost optimization. Datadog Cloud Cost Management helped us attribute spend at a granular level over dozens of accounts to achieve significant savings." – Martin Amps, Stitch Fix
Conclusion
Optimizing workflow data in Datadog is not a one-and-done task - it’s an ongoing effort that boosts system performance while keeping costs in check. By applying the strategies outlined here, you can create a monitoring setup that adapts and grows alongside your business needs.
Main Takeaways
Streamlining workflow data optimization comes down to a few critical practices:
- Smart tagging: Avoid high-cardinality tags like user IDs or version numbers to keep your data organized and avoid unnecessary costs.
- Strategic log filtering: Adjust log levels in production to cut down on excess storage while retaining essential data.
- Intelligent alerting: Focus on alerts that matter. Prioritizing critical issues prevents alert fatigue and ensures your team stays on top of what’s truly important.
These practices lay the groundwork for efficient and scalable monitoring.
Ongoing Optimization
For long-term success, regular reviews and updates are key. Consider scheduling monthly check-ins to analyze your Datadog usage. Many businesses find that reviewing invoices and usage trends uncovers opportunities to reduce costs without sacrificing performance.
As your company grows, your monitoring requirements will change. Revisit your tagging strategy, refine dashboard layouts, and adjust alerting rules to match your evolving needs. Tools like Datadog’s Metrics without Limits can help you manage custom metrics more effectively, ensuring you maintain visibility without overextending resources.
Lastly, invest in team expertise. Structured training programs, such as Datadog’s learning paths, can empower your team to get the most out of your monitoring tools. By treating optimization as a continuous process, you’ll not only maintain system performance but also keep costs under control as your business scales.
FAQs
What are the best ways for small and medium-sized businesses to manage high-cardinality tags in Datadog and control costs?
Small and medium-sized businesses using Datadog can manage high-cardinality tags by being mindful of the tags they apply, especially those that generate a large number of unique values. Uncontrolled tagging can lead to higher costs and strain on system performance. To avoid this, focus on tagging only the metrics that are absolutely essential for observability.
For even better results, you might want to put governance measures in place. For example, assign a team or individual to oversee tag usage and ensure consistency across your system. Also, take advantage of Datadog tools like Metrics Without Limits™, which let you control and prioritize the most important tags while reducing the impact of less critical data. These strategies can help you strike the right balance between performance and cost.
How can I set up alerts in Datadog to minimize noise and prioritize critical issues?
To cut through the noise and focus on what really matters, start by adjusting your alert thresholds to fit your system's unique requirements. Using longer evaluation periods can help reduce false alarms, while grouping related alerts prevents duplicate notifications from cluttering your inbox. Another smart move? Set recovery thresholds to stop repetitive alerts when issues quickly resolve themselves.
You can also create notification rules to customize alerts for specific teams or scenarios. On top of that, setting up quiet hours - where only critical alerts get through - can keep distractions to a minimum and ensure your team stays focused on urgent issues. These strategies simplify workflows and help your team zero in on the alerts that deserve their attention.
How can Datadog's Observability Pipelines help reduce data volume and enhance log quality?
Datadog's Observability Pipelines make handling data simpler by letting you filter, clean up, and fine-tune logs before sending them where they need to go. This helps cut down on excessive log volume, saving on storage costs and reducing the clutter in your monitoring data.
You can also create metrics straight from logs, which means you don’t have to keep all the raw log data. This way, you still get the insights you need without the extra storage burden. These tools help keep your systems visible while making your data more efficient and your logs more useful.


