Checklist for Debugging Datadog Custom Integrations
A structured checklist to debug Datadog custom integrations, focusing on common issues like configuration errors and API key problems.
Debugging Datadog custom integrations can feel daunting, but a structured process simplifies it. Here’s the key takeaway: most issues stem from configuration errors, API key problems, or network connectivity issues. This guide walks you through essential steps to ensure your custom integrations work seamlessly, from verifying the Datadog Agent setup to troubleshooting data flow and connectivity.
Key Steps to Debugging:
- Pre-Debugging Checks: Ensure the Datadog Agent is installed, configured, and allowed to communicate over HTTPS (TCP 443).
- Configuration Validation: Double-check YAML files for formatting errors, verify API keys, and confirm proper tagging and metadata.
- Enable Debug Mode: Use debug mode in the Datadog Agent to identify errors in logs and performance metrics.
- Test Connectivity: Confirm API communication and data flow using test calls to endpoints like
/api/v1/series. - Data Verification: Check dashboards for missing or incorrect metrics, validate data intervals, and confirm tags are applied correctly.
- Address Common Problems: Look out for setup errors, third-party compatibility issues, or outdated software versions.
By following these steps, you’ll quickly identify and fix most integration issues. If problems persist, escalate to Datadog Support with detailed logs and configurations.
I01 Set Up the Datadog Agent and Start Collecting Data
Pre-Debugging Setup
Before jumping into debugging, it's smart to run a few preliminary checks. These steps help you sidestep common issues and save valuable time. Start by ensuring your Datadog Agent is installed and set up correctly.
Verify Datadog Agent Installation and Compatibility
To confirm your Datadog Agent is properly installed and configured, focus on these key points:
- Make sure outbound HTTPS traffic (TCP 443) to Datadog's intake servers is allowed. If you're using a proxy, double-check its configuration.
- Ensure the agent has the required security permissions to function without hiccups.
Configuration Check
Once you've completed the pre-debugging setup, it's time to ensure your custom integration settings align with Datadog's requirements. This step helps prevent potential issues by confirming everything is configured correctly.
Check Configuration Files and Syntax
Datadog Agent relies heavily on YAML files for its configurations, and these files are notoriously sensitive to formatting mistakes. Most integration-specific configurations can be found in the conf.d directory, with each integration having its own subfolder.
Here are some common YAML pitfalls to watch out for:
- Incorrect or inconsistent indentation (stick to exactly two spaces per level).
- Missing or misplaced colons after configuration keys.
- Trailing spaces at the end of lines, which can cause subtle syntax errors.
To avoid these issues, use a YAML validation tool to check your configuration files after making changes.
Confirm API Keys and Endpoints Are Correct
Authentication problems are often the culprit behind integration failures. Make sure you’re using the correct API and Application Keys to submit and retrieve data.
- Log into your Datadog account to generate new API and Application Keys if needed.
- Store these keys securely and include them in API requests using the appropriate headers.
Update your integration's configuration file (e.g., datadog.yaml or datadog.conf) by adding the correct key under the api_key: entry. Save the file once updated.
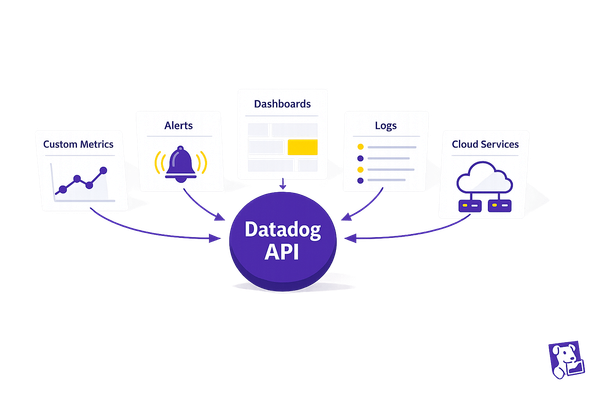
API endpoints depend on what the integration is designed to do. Common endpoints include:
- Metrics API:
/api/v1/seriesfor submitting data,/api/v1/queryfor retrieving data. - Logs API:
/api/v2/logs/events. - Monitors API:
/api/v1/monitor. - Dashboards API:
/api/v1/dashboard. - Events API:
/api/v1/events.
Test your connection by making a simple API call. For example, in Python, you can use response.raise_for_status() to automatically catch and handle errors. If you see a 401 Unauthorized error, double-check your API and Application Keys. A 403 Forbidden error often points to a permissions issue.
Verify Tags and Metadata Are Applied Correctly
Tags and metadata play a crucial role in grouping and analyzing your data. To avoid issues:
- Follow Datadog's naming conventions for tags: use lowercase letters, numbers, underscores, and hyphens. Avoid spaces or special characters, as they can cause parsing errors.
- Ensure consistency in metadata such as host names and service names. Even minor differences - like capitalization - can lead to fragmented data streams.
Review your configuration files and any custom code to confirm that tags and metadata are applied at the right levels, whether it’s host, metric, or check level. Proper tagging ensures your monitoring data is easy to filter and analyze effectively.
Debugging and Troubleshooting Steps
After reviewing your configuration, follow these steps to identify and resolve integration issues effectively. A structured approach to debugging can help you quickly pinpoint the root cause.
Turn On Debug Mode in Datadog Agent
Switching on debug mode turns the Datadog Agent into a powerful diagnostic tool, exposing configuration errors, network problems, and performance issues. To enable debug mode, add developer_mode: yes to the datadog.conf file or use the --profile flag. Then, restart the agent to apply the changes.
Debug mode provides detailed performance metrics, making it easier to identify issues.
Important: Remember to disable debug mode once you've resolved the problem. Leaving it on can lead to excessive log generation, which may affect performance and increase storage costs.
After enabling debug mode, review the logs to identify error messages and gather more insights.
Review Agent and Integration Logs
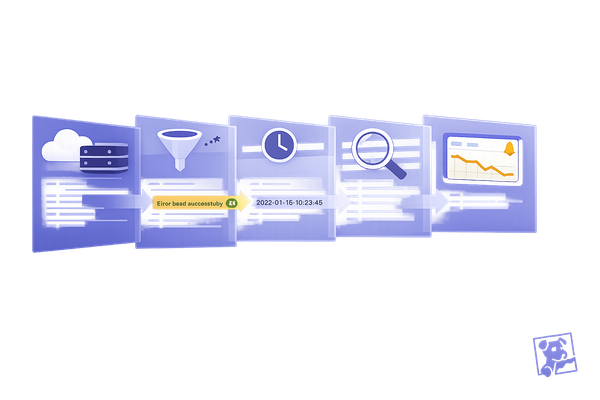
Logs are a key resource for uncovering what went wrong with your integration. The Datadog Log Explorer is an excellent tool for accessing and analyzing diagnostic messages.
Use the datadog-agent status command and the Log Explorer's Live Tail to locate errors and warnings quickly. To focus your investigation, apply search filters to isolate logs from your custom integration. Filter by attributes like service, source, or host to zero in on the issue.
For Python-based applications using tracing, enable debug logging for the tracer by setting the environment variable DD_TRACE_DEBUG to True. You can also direct logs to a specific file using the DD_TRACE_LOG_FILE variable.
Once you've reviewed the logs and verified their accuracy, proceed to test the connection to identify potential network-related issues.
Test Connection and Communication
Testing connectivity ensures that data flows smoothly between your custom application and the Datadog Agent. This step can help identify network issues, authentication errors, or data transmission problems.
Start by testing basic API connectivity. For instance, you can use the /api/v1/series endpoint to submit metrics or the /api/v1/query endpoint to retrieve data. If you encounter a 401 Unauthorized response, it usually indicates an issue with your API or Application Keys. A 403 Forbidden error often signals insufficient permissions.
While running these tests, monitor the agent's metrics. The agent_metrics check, executed at the end of each collector loop, provides performance data about the collector. Look out for unusual spikes in collection time or CPU usage, as these could indicate communication bottlenecks.
Finally, test your integration by sending a small batch of sample data. Verify that the data appears on your Datadog dashboards within the expected timeframe. If it doesn’t, investigate potential causes such as network connectivity issues, firewall restrictions, or proxy configurations. Tools like ping or traceroute can help confirm whether network settings allow data to flow to Datadog's endpoints.
Data Check and Monitoring
Once you've confirmed connectivity and configuration, the next step is to ensure your data is reaching Datadog as intended. This involves verifying that your custom integration is sending the expected metrics, events, and logs.
Check Data Appears in Dashboards
Start by checking if your custom metrics, events, and logs are visible in Datadog dashboards. Use the Metrics Explorer to search for your integration's namespace or specific metric names. This will confirm whether the data is being ingested properly.
Keep in mind that data processing can take 2-5 minutes, although this may vary depending on your configuration and network conditions.
Next, review the Infrastructure List to verify that your hosts are reporting correctly. Check for the presence of your custom tags and metadata, as missing tags often point to configuration issues that need to be resolved.
For event-based integrations, inspect the Events Stream to ensure your custom events are appearing with the correct timestamps, source, tags, and any custom properties you've configured. Once the dashboards display incoming data, review them for any missing or unexpected values.
Look for Missing or Incorrect Data Points
Compare the data appearing in Datadog with what you expect to see. Missing data points can indicate timing issues, network problems, or configuration errors in your integration.
Use the Metrics Summary page to analyze the volume and frequency of your custom metrics. Look for any gaps in data transmission, which might suggest intermittent connectivity issues or problems with the agent. Pay attention to metric types - ensure that counters, gauges, and histograms are being reported accurately based on your integration's design.
Double-check numerical values to ensure they fall within expected ranges. If you notice zeros, negative values, or unusually high numbers, review your integration's data parsing and transformation logic. Data type mismatches are a common culprit behind such discrepancies.
Once you've verified the integrity of the data, confirm that your custom check intervals are effectively capturing information.
Check Custom Check Intervals
Custom check intervals dictate how often your integration sends data to Datadog. Properly configured intervals ensure a steady data flow without overloading your systems or incurring unnecessary costs.
Review the min_collection_interval in your integration's YAML file to confirm the check frequency. Typical intervals range from 15 seconds for high-frequency monitoring to 300 seconds (5 minutes) for less critical metrics.
Run datadog-agent status to check the execution intervals of your custom checks. This command displays the "Last Run" and "Next Run" timestamps for each active check. If these timestamps don't match the expected interval, investigate potential scheduling conflicts or resource limitations.
Consistent and evenly spaced data points in your dashboards indicate that check intervals are functioning properly. If you notice irregularities, such as missing or clustered data points, it could signal timing issues that need to be addressed.
If your check isn't running as expected, enable debug mode and review the agent logs for errors related to scheduling or execution. High CPU usage or memory constraints can cause checks to skip runs or execute with delays, so monitor system resources closely.
Common Problems and Solutions
Identifying and addressing common challenges can help you troubleshoot effectively and keep your monitoring systems running smoothly.
Look for Setup Errors
Setup errors, particularly those involving permissions, can disrupt data flow. Start by ensuring your API keys are active and that service accounts have the proper read permissions.
Make sure firewalls are configured to allow outbound HTTPS traffic (TCP 443) and Agent communication (TCP 10516). If your setup is behind a corporate firewall, update the proxy settings in your agent configuration file.
Rate limits can also cause intermittent failures during periods of high traffic. To avoid HTTP 429 errors, adjust the frequency of API calls and implement backoff strategies. If rate limits are a persistent issue, consider increasing the interval between data collections.
Check that the agent user (e.g., dd-agent) has the necessary file system permissions. On Linux, for example, the dd-agent user needs read access to integration files and write access to /var/log/datadog/.
Lastly, validate the formatting of your YAML files. Errors in indentation or special characters can prevent integrations from loading properly.
Check Third-Party Compatibility
Once setup issues are resolved, ensure that third-party components integrate without conflicts. A common problem involves Python library mismatches. Integration-specific packages may conflict with the Datadog Agent's built-in Python libraries.
The Datadog Agent uses its own Python environment with pre-installed packages. To check the Python version and installed libraries, run datadog-agent status.
SSL certificate problems often occur when connecting to internal services or third-party APIs using self-signed certificates. While you can temporarily disable SSL verification for testing, it’s better to configure proper certificate validation for production environments.
Verify that database drivers are compatible with the agent's Python version. Some drivers may require additional system libraries or tools that aren't included in the agent's environment.
Authentication mismatches are another frequent issue. Modern APIs often use methods like OAuth 2.0 or JWT tokens, which require specific implementation. Double-check that your integration supports the required authentication flow.
Finally, watch out for version incompatibilities between your integration and the target system's API. APIs evolve, and changes to endpoints or response formats can break existing integrations. Ensure your integration is compatible with the API's current version.
Install Updates and Patches
After resolving conflicts, keep your Datadog Agent and integrations up to date to avoid recurring issues and benefit from new improvements.
To check your agent version, run datadog-agent version and compare it with the latest stable release. Datadog frequently updates the agent with bug fixes, security patches, and performance enhancements. Be sure to review release notes for any major updates, as they may include breaking changes.
Integration updates are available through Datadog's integration marketplace or community repositories. If you're using Datadog's integration SDK, update it regularly to ensure compatibility with newer agent versions and to take advantage of better error handling and logging.
System-level updates, like operating system patches or Python runtime upgrades, can also impact your integrations. Test your setup after applying updates to confirm everything continues to function as expected.
Pay close attention to security patches, especially for integrations that handle sensitive data or connect to external services. Outdated libraries or agent versions can expose vulnerabilities that compromise your monitoring setup.
Stay informed by monitoring Datadog's status page and release announcements. Critical updates and fixes are often highlighted, helping you address specific issues before they escalate.
Establish a regular maintenance routine to review and update your integrations. This proactive approach minimizes potential problems and ensures you’re leveraging the latest tools and features for reliable monitoring.
Conclusion: Making Debugging Easier for Datadog Custom Integrations
Having a structured approach to debugging can save you time and help avoid unnecessary troubleshooting mistakes. Start by ensuring your Datadog Agent is running and meets the integration requirements. Use the datadog-agent configcheck command to catch syntax errors and configuration issues early on. Additionally, validate your API key using Datadog’s validate endpoint. A successful response, such as {"valid":true} with an HTTP 200 status, confirms your authentication is working as expected. This step ensures you’re tackling the actual problem rather than chasing unrelated symptoms.
Once the configuration is validated, focus on reviewing logs and making incremental fixes. Enable debug mode selectively to gather detailed diagnostic information while keeping log volume and costs manageable. Pay close attention to Agent and integration logs, as they often reveal key issues like authentication failures, connection errors, or network problems. These logs can help you determine whether the issue lies in your configuration or in the underlying infrastructure.
Next, verify your data within Datadog dashboards. Check that metrics, service checks, and logs are showing up as expected, and confirm that tags are applied correctly for filtering and scoping. Problems like missing or mislabeled data often point to tagging errors or incorrect custom check intervals.
Make fixes step by step, testing each change as you go. For example, install missing dependencies, update configurations, restart the Agent, and re-run validation commands. This method keeps troubleshooting manageable by isolating the impact of each fix and avoiding compounded errors.
For custom checks, follow Datadog’s integration framework guidelines to ensure proper metric types, tag usage, and service check structures. This consistency simplifies future troubleshooting and ensures your custom integrations behave predictably, much like standard ones.
Small and medium-sized businesses can benefit from creating standardized runbooks that include common commands and expected outputs. Training your team to follow these steps consistently helps prevent recurring problems and builds overall debugging expertise. For additional tips, resources like Scaling with Datadog for SMBs provide practical advice on efficient monitoring strategies.
After resolving the issue, remember to clean up. Disable debug logging, document the resolution, and commit any updates. Set up monitors to catch similar problems early, so they don’t disrupt your systems in the future.
If all internal troubleshooting efforts fail - such as when datadog-agent configcheck passes, connectivity tests succeed, and logs show no clear errors, but data still doesn’t appear after a restart - it’s time to escalate. Reach out to Datadog Support or community resources with sanitized logs and configuration details to get additional help.
FAQs
What are some common mistakes that can cause issues with Datadog custom integrations?
When setting up Datadog custom integrations, there are a few common pitfalls you’ll want to avoid. One frequent issue is misconfiguring the setup files or using invalid parameters, which can disrupt how the integration operates. Forgetting to include API keys, using outdated libraries, or failing to enable log collection are other typical mistakes that can cause problems.
Another area where things often go wrong is with mismatched configurations. Errors in the agent setup or incorrect autodiscovery settings can lead to unexpected behavior. Taking the time to carefully review these details during the configuration process can save you a lot of troubleshooting later on.
How do I use debug mode in the Datadog Agent to troubleshoot custom integrations?
To troubleshoot custom integrations in the Datadog Agent, you’ll want to use debug mode for deeper insights. Start by opening the datadog.yaml configuration file and setting the log_level parameter to DEBUG. This adjustment will generate more detailed logs, making it easier to spot issues with the Agent’s activity.
Keep in mind, though, that debug mode produces a significant amount of log data. It’s best to enable it temporarily - just long enough to review the logs, identify errors, or uncover misconfigurations. Afterward, switch back to a lower log level to maintain optimal performance.
For even more information, you can review the Agent logs directly or use system tools like journalctl if your system uses systemd. By leveraging debug mode correctly, you can quickly identify and resolve integration problems, ensuring your monitoring setup stays on track.
What should I do if my data isn’t showing up in Datadog dashboards after troubleshooting?
If data isn’t showing up on your Datadog dashboards after troubleshooting, start by revisiting your custom integration setup. Ensure everything is configured correctly and that data is being sent to the appropriate Datadog API endpoints. It’s a good idea to review the integration logs to confirm data transmission and check for any network problems that might be blocking the flow.
Next, take a close look at your dashboard settings. Double-check that filters, time ranges, and any applied tags match the data you’re expecting to see. If the problem continues, dig into the Datadog agent logs for any error messages. You might also want to try re-initializing the integration or updating the agent to the latest version. These steps should help address most data visibility problems and get your dashboards back on track.

