Custom Metrics vs Standard Metrics: Cost Comparison
Understand the cost differences between standard and custom metrics in Datadog to manage your budget effectively and avoid unexpected expenses.

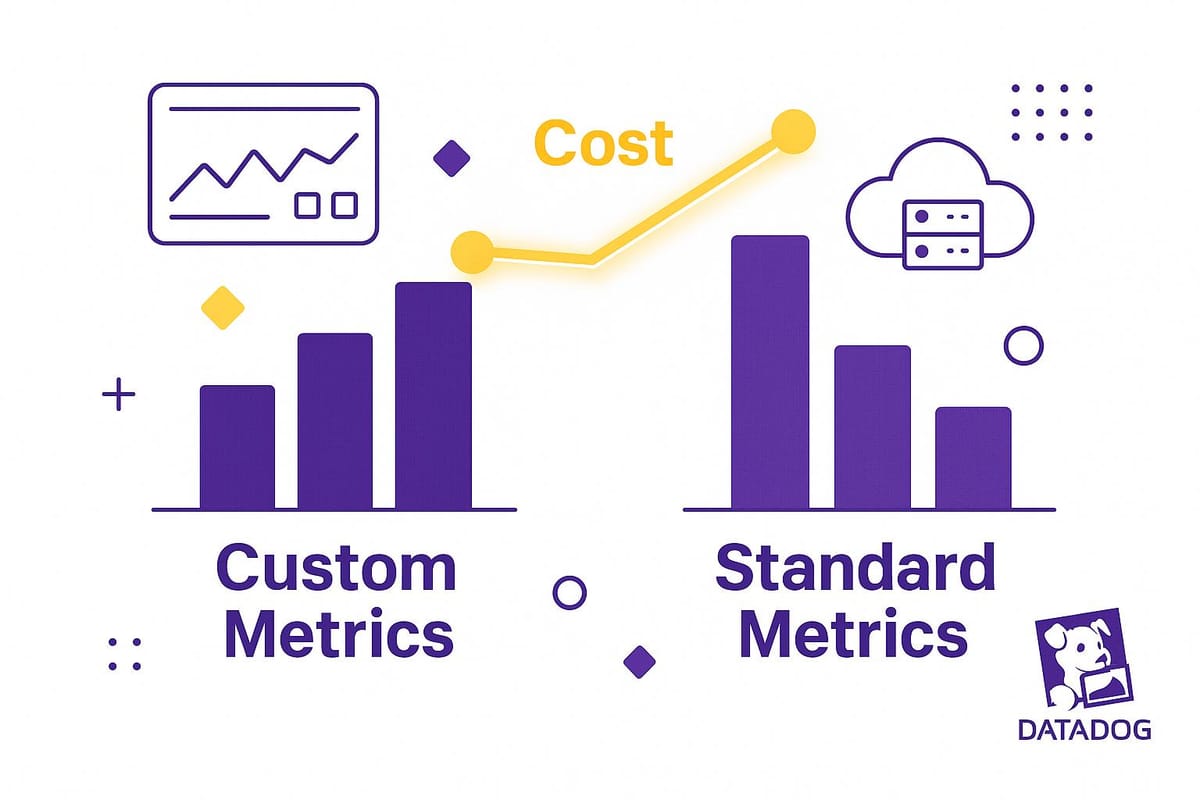
When managing your Datadog budget, standard metrics and custom metrics have very different cost structures. Here's the key takeaway: Standard metrics are included in your plan, while custom metrics can lead to extra charges based on usage. Understanding these differences is essential to control costs.
- Standard Metrics: Automatically collected from built-in integrations (e.g., CPU usage, memory). Costs are predictable and tied to your host count.
- Custom Metrics: Application-specific data you send to Datadog. Costs can increase due to high cardinality (unique tag combinations) and exceeding limits (100 per host on Pro plans, 200 on Enterprise plans).
- High-Cardinality Costs: Tags like user IDs or timestamps can multiply costs. For example, tracking one metric with 1,000 unique tags equals 1,000 billable metrics.
Quick Comparison
| Factor | Standard Metrics | Custom Metrics |
|---|---|---|
| Cost | Included in base plan | Usage-based fees after limits exceeded |
| Tagging Impact | No effect on cost | High cardinality increases costs |
| Predictability | Fixed, based on host count | Variable, based on usage and tags |
To manage costs:
- Avoid high-cardinality tags.
- Consolidate metrics with consistent tagging strategies.
- Use Datadog's cost tools to monitor and optimize usage.
Bottom Line: Use standard metrics as your foundation and implement custom metrics sparingly to avoid unexpected expenses.
Datadog Cost Optimization: Best Practices for APM, Metrics, Logs & Observability
Datadog Metric Types Explained
Understanding how Datadog categorizes metrics is key to managing costs effectively. Each type has its own characteristics, and these differences can directly influence your monthly bill. Let’s break down the key metric types and how tagging can impact your expenses.
Standard Metrics Overview
Standard metrics form the core of Datadog’s monitoring capabilities. These metrics are automatically generated through Datadog’s built-in integrations, covering everything from AWS CloudWatch data to Docker container statistics. The moment you connect your infrastructure to Datadog, these metrics start populating your dashboards - no extra setup required.
One of the biggest advantages of standard metrics is their predictable cost structure. They’re included in your base plan, so you won’t face unexpected charges for tracking things like CPU usage on EC2 instances or memory consumption in Kubernetes pods. Examples of standard metrics include system-level data such as disk I/O rates, network throughput, database connection counts, and load balancer response times.
Another perk? Standard metrics come with pre-configured dashboards and alerts. Datadog has already optimized the tagging structure for these metrics, so your team spends less time on setup. Plus, the metric names follow consistent patterns - like system.cpu.user or aws.ec2.cpuutilization - making them easy to recognize and manage.
Custom Metrics Overview
While standard metrics cover general monitoring needs, custom metrics are designed to track specific business insights and application performance indicators. These are metrics you define and send to Datadog, often through your application code, third-party tools, or OpenTelemetry. Unlike standard metrics, custom metrics require explicit implementation and come with usage-based pricing.
Custom metrics are ideal for tracking KPIs that standard integrations don’t cover. For example, you might monitor shopping cart abandonment rates, user session durations, API performance by customer tier, or revenue per transaction. They’re also useful for tracking proprietary software or legacy systems that lack built-in Datadog integrations.
However, with great flexibility comes added responsibility. You control the metric names, tags, and submission frequency, which means you also control the costs. For instance, a single custom metric like api.response_time can quickly multiply into hundreds of billable metrics once you add tags like endpoint, region, customer_id, and status_code.
How Cardinality and Tagging Affect Costs
Cardinality plays a major role in determining costs by counting each unique combination of a metric name and its tags. Every unique combination is treated as a separate billable metric in Datadog’s system.
Here’s how this works in practice: Suppose you’re tracking checkout.completion_time with tags for store_id, payment_method, and user_tier. If you have 50 stores, 4 payment methods, and 3 user tiers, that’s 600 unique custom metrics (50 × 4 × 3) from just one metric name.
High-cardinality tags are a common driver of increased costs. Tags with a large number of possible values - like user IDs, transaction IDs, or IP addresses - can quickly inflate your metric count. For example, a single metric tagged with 1,000 unique user IDs would result in 1,000 billable custom metrics. To avoid this, Datadog recommends using low-cardinality tags whenever possible.
Timing also matters. Datadog considers a metric active if it receives at least one data point during an hour. Even sporadically sent metrics count toward your monthly custom metric total for every hour they’re active. By adopting consistent tagging strategies, you can keep costs predictable and manageable.
Datadog Metrics Pricing Structure
Let’s break down how Datadog’s pricing model works when it comes to metrics. Knowing the cost structure is key to managing your monitoring expenses effectively. While standard metrics are part of your base plan, custom metrics come with additional charges once you exceed the included limits.
Standard Metrics Costs
Standard metrics are automatically bundled into your Infrastructure Monitoring plan - no extra fees here. Whether you’re on the Pro or Enterprise tier, core metrics like CPU usage, memory consumption, and network throughput are covered under your subscription. This flat-rate pricing ties costs to the number of hosts, not the volume of metrics, making it easier to predict your monthly bills.
Custom Metrics Costs
Custom metrics operate on a usage-based pricing model. Pro plans include 100 custom metrics per host, while Enterprise plans offer 200. These limits are calculated as a monthly average across your entire account - not strictly per host.
If you go over your allotment, additional charges kick in for every extra custom metric. Using high-cardinality tags can increase costs significantly, as a single metric might be split into multiple billable variations.
High-Resolution Metrics Extra Fees
Metrics submitted at intervals shorter than 15 seconds (high-resolution metrics) come with additional charges due to the increased granularity and storage requirements. Before opting for high-resolution data, consider whether the added detail is truly necessary - standard resolution combined with effective alerting often gets the job done.
Side-by-Side Cost Analysis
Let’s break down the cost considerations for standard and custom metrics, building on the pricing and tagging strategies we’ve already covered. This section highlights how costs can shift as your metric usage grows and tagging becomes more detailed.
Cost Comparison Chart
Here’s a quick overview of how standard metrics stack up against custom metrics in terms of cost:
| Factor | Standard Metrics | Custom Metrics |
|---|---|---|
| Base Cost | Usually included in your subscription | May involve extra usage-based fees |
| Included Limits | Typically unlimited | Often capped with usage limits |
| Cardinality Impact | Tag variations don’t usually affect costs | Unique tag combinations can increase charges |
| Predictability | Fixed costs based on host count | Costs fluctuate with usage and tagging |
For standard metrics, costs are straightforward - usually tied to a fixed host count. However, custom metrics operate differently. Each unique tag combination (e.g., endpoint, method, region) can result in multiple billable variations. The more granular your tagging, the faster costs can climb.
Common Cost Scenarios for SMBs
Small and medium-sized businesses (SMBs) often encounter these cost dynamics in real-world situations:
- E-commerce Platforms: An online store tracking performance across various product categories and payment methods may see custom metrics multiply rapidly if detailed tags are applied consistently. This can lead to unexpected cost spikes.
- SaaS Applications: A SaaS company monitoring features across customer tiers and regions might notice a sharp rise in custom metric counts. This escalation could result in higher monthly bills, especially with granular tagging.
- Environment Duplication: Replicating production monitoring setups in staging, testing, and development environments can significantly inflate the total number of custom metrics. Features like high-resolution metrics may further compound these costs.
Cost Control Tips for SMBs
Managing Datadog monitoring costs can be a challenge for SMBs, but with the right strategies, you can keep expenses predictable and under control. Here are three practical ways to tackle this issue.
Reduce High-Cardinality Custom Metrics
High-cardinality metrics are a common culprit behind unexpected cost increases. These metrics arise when tags create too many unique combinations, which can quickly inflate your expenses.
For example, including unique identifiers like user IDs, session tokens, or timestamps in your tags often leads to thousands of unnecessary combinations. While these details might seem useful, they rarely provide actionable insights and can rack up significant costs.
Instead, focus on grouping similar values together. For instance, rather than tagging HTTP response times with exact millisecond timestamps, classify them into broader categories like "fast" (under 200ms), "moderate" (200-500ms), and "slow" (over 500ms). This simplifies your data while still giving you the insights you need.
Another way to cut down on high-cardinality metrics is by eliminating nonessential tags, especially in non-production environments. Ask yourself if you really need the same level of detail in development and staging as you do in production. Often, reducing tagging granularity in these environments can save costs without compromising monitoring quality.
Once you've minimized unnecessary tag variations, organize your remaining metrics to further streamline costs.
Group Metrics and Tags Together
Organizing your metrics and tags more efficiently can significantly reduce your custom metric count. One effective approach is to combine related data points under a single metric name with distinguishing tags.
For example, instead of creating separate metrics like api.users.response_time, api.orders.response_time, and api.products.response_time, consolidate them into one metric called api.response_time and use an endpoint tag to differentiate between the data. This approach simplifies your setup and reduces costs.
To avoid duplication and confusion, standardize your tagging strategy across your organization. Establish clear guidelines on which tags are essential and which are optional. This ensures consistency and prevents teams from creating redundant metrics with slightly different tag structures.
Additionally, leverage metric namespaces to group related metrics by service, feature, or business function. This not only helps you identify redundant metrics during audits but also makes it easier to pinpoint which areas of your infrastructure are driving the highest costs.
Regularly monitor these changes using Datadog's cost tools to ensure your optimizations are effective.
Track Usage with Datadog Cost Tools
Keeping an eye on your metric usage is crucial for cost management. Datadog offers several built-in tools to help you track spending and uncover opportunities for optimization.
Set usage alerts at 80% and 90% of your custom metric limits to catch potential cost overruns early. Use the Usage & Billing dashboard to monitor patterns and identify sudden spikes, which could indicate new deployments or configuration changes driving up costs. Pay close attention to metrics with consistent month-over-month growth, as these are often the best candidates for optimization.
Conduct monthly audits of your top custom metrics by volume. Identify which metrics consume the most resources and evaluate whether they're still providing value. Metrics that were critical during development may lose their importance as your application matures.
Datadog's metric summary page is another valuable tool. Use it to pinpoint tag combinations that are inflating costs unnecessarily.
Finally, monitor metric ingestion rates during deployments and configuration changes. New features or updates can lead to a surge in metric volume. By tracking these changes in real-time, you can address cost increases before they spiral out of control.
Conclusion: Choosing the Right Metrics for Your Budget
Let’s wrap up the discussion on cost analysis and monitoring strategies with some key points to help you align your metrics with your budget.
Standard metrics - like CPU, memory, and network data - are typically included in your basic plan. These provide a solid foundation for monitoring. On the other hand, custom metrics, while offering deeper insights tailored to your needs, come with additional usage-based charges. The trick is to use them sparingly and only when they fill a clear gap in visibility.
One major cost driver to watch out for is uncontrolled cardinality caused by excessive tagging. Before adding tags to custom metrics, take a moment to evaluate whether they’re truly necessary. Over-tagging can inflate costs faster than you might expect.
To manage expenses effectively, start by relying on standard metrics to establish a baseline. Once you’ve identified specific needs, you can slowly introduce custom metrics. Regular audits and disciplined cost-control practices are essential to keeping your spending in check.
The ultimate goal isn’t to slash costs at all costs but to make sure every dollar you invest in monitoring delivers real, measurable value.
FAQs
What are the best ways to control costs for high-cardinality custom metrics in Datadog?
To keep your spending on high-cardinality custom metrics in Datadog under control, the first step is understanding how you're using them. Tools like the Plan & Usage page can help you pinpoint which metrics or services are contributing most to your costs. Breaking these costs down by team or project can also encourage better accountability.
Cutting unnecessary expenses is another key move. Look for unused or redundant metrics, particularly those with high cardinality, and remove them. Regular audits of your metrics, along with governance practices like setting quotas and refining your data collection processes, can make a big difference. By staying proactive and managing metrics efficiently, you can maintain strong observability without overspending.
How can I decide when to use custom metrics instead of standard metrics in Datadog?
When deciding if custom metrics are the right choice, start by assessing whether standard metrics fulfill your monitoring needs. While standard metrics work well for general performance tracking, custom metrics shine when you need to monitor specific KPIs - like user behavior patterns or the performance of individual transactions - that aren't included by default.
Custom metrics can also provide deeper insights or more detailed data, which can be critical for informed decision-making. That said, they can add to your costs, so it's essential to keep an eye on usage and establish governance practices to manage expenses effectively. Striking the right balance ensures your metrics strategy supports both your business objectives and your budget.
How can Datadog's cost tools help SMBs manage metric usage and avoid unexpected charges?
Datadog's cost management tools are designed to give small and medium-sized businesses (SMBs) a clear understanding of their metric usage and expenses. With user-friendly dashboards and detailed metrics, these tools make it easier to spot major cost drivers and uncover opportunities to save.
Beyond just tracking costs, Datadog lets users adjust the number and frequency of synthetic tests and manage custom metrics. This ensures monitoring stays efficient and budget-friendly without sacrificing performance or visibility. By staying ahead of potential overages, SMBs can avoid surprise charges and maintain control over their spending.


