Datadog API Tutorial: Automate Everything from Logs to Alerts
Learn how to automate monitoring tasks with an API, enabling faster incident response and streamlined log management.
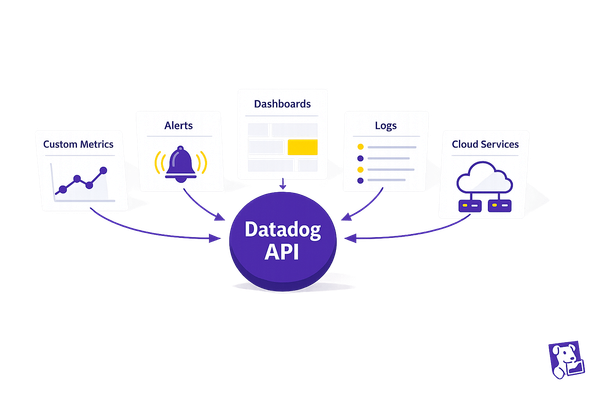
The Datadog API simplifies monitoring by automating tasks like managing metrics, logs, and alerts. Here’s what you can achieve:
- Faster Incident Response: Automate workflows to resolve issues without manual intervention.
- Custom Metrics: Send tailored data using endpoints like
/api/v1/series. - Log Management: Process, query, and archive logs with
/api/v2/logs. - Alert Systems: Create and manage alerts for metrics, logs, and anomalies.
- Secure API Access: Use API and App keys with robust security practices like OAuth2, rate limiting, and firewalls.
- Integration: Seamlessly connect Datadog with CI/CD pipelines, AWS Lambda, and more.
Quick Example: Automate log tagging with Python:
routing_rules = {
    "filter": {"query": "service:api AND @compliance:hipaa"},
    "processor": {"type": "pipeline", "name": "secure-logs"}
}
Datadog’s API is a powerful tool for scaling and securing your monitoring processes. Keep reading for step-by-step guides, code examples, and best practices.
Datadog Workflow Automation Demo
Setting Up Datadog API Access
Ensuring secure API access is a key step in automating your monitoring workflows effectively. Below, we’ll cover how to set up Datadog API access while keeping security a top priority.
Creating API and App Keys
To use Datadog's API endpoints, you’ll need two types of keys: API keys and Application keys. API keys authenticate service requests, while Application keys grant access to specific Datadog features.
Here’s how to manage your keys securely:
- Generate separate keys for each environment: Create unique keys for development, staging, and production environments. Clearly label them to avoid confusion and ensure they’re rotated regularly.
- Document key usage: Keep track of which teams and services are using each key. Maintain an updated inventory of active keys, noting their purpose, creation date, and rotation history.
Once these keys are in place, ensure your API endpoints are secured with proper authentication and access controls.
Setting Up API Security
APIs are frequent targets for cyberattacks, making it crucial to establish strong security measures to protect them.
Key security practices include:
- Authentication protocols: Use OAuth2 and OpenID Connect Discovery for token-based access control.
- Access control: Restrict access to only the necessary API endpoints to minimize vulnerabilities.
- Rate limiting: Set rate limits to prevent abuse and mitigate risks like denial-of-service attacks.
Additional Security Layers:
| Security Layer | Purpose | Implementation |
|---|---|---|
| Web Application Firewall | Block suspicious traffic | Configure rules to detect malicious requests |
| API Inventory Management | Track API endpoints | Use OpenAPI specifications for documentation |
| Runtime Protection | Monitor API behavior | Enable automatic discovery and vulnerability scanning |
Main API Endpoints Guide
Datadog's API is a powerful tool for automating monitoring tasks. With its endpoints, you can manage metrics, logs, and alerts, creating a streamlined workflow for your monitoring needs.
Sending Custom Metrics
The /api/v1/series endpoint lets you send custom metrics and submit data tailored to your specific needs.
Here’s an example using the Datadog Python library:
import time
from datadog_api_client import ApiClient, Configuration
from datadog_api_client.v1.api.metrics_api import MetricsApi

configuration = Configuration()
with ApiClient(configuration) as api_client:
    api_instance = MetricsApi(api_client)
    metric_data = {
        "series": [{
            "metric": "app.request.latency",
            "points": [[int(time.time()), 15.2]],
            "tags": ["environment:production", "service:api"]
        }]
    }
    api_instance.submit_metrics(metric_data)
Best Practice: Avoid hardcoding sensitive keys like DATADOG_API_KEY and DATADOG_APP_KEY in your scripts. Instead, store them securely as environment variables within your application.
Managing Logs via API
The /api/v2/logs endpoint provides robust capabilities for sending, querying, and processing log data. Here's a breakdown of its key operations:
| Operation | Endpoint | Purpose |
|---|---|---|
| Send Logs | POST /api/v2/logs | Submit log entries to Datadog |
| Query Logs | GET /api/v2/logs/events | Retrieve filtered log events |
| Archive Logs | POST /api/v2/logs/archives | Set up log archiving configurations |
Creating and Managing Alerts
To handle alerts, the /api/v1/monitor endpoint allows you to create and manage various types of monitors.
Monitor Types:
- Metric monitors for threshold-based alerts.
- Host monitors to track infrastructure health.
- Anomaly detection monitors for unusual behavior.
- APM and trace analytics monitors to oversee application performance.
- Log-based monitors to act on specific log patterns.
- Event correlation monitors for connecting related events.
Here’s how you can create an alert using Python:
from datadog_api_client.v1.api.monitors_api import MonitorsApi

with ApiClient(configuration) as api_client:
    monitors_api = MonitorsApi(api_client)
    monitor_data = {
        "name": "High API Latency Alert",
        "type": "metric alert",
        "query": "avg(last_5m):avg:app.request.latency{environment:production} > 2",
        "message": "API latency is above threshold. @slack-alerts"
    }
    response = monitors_api.create_monitor(body=monitor_data)
Pro Tip: Always include detailed alert messages with clear notification instructions. This ensures the right teams are informed promptly and can act accordingly.
Creating Log Processing Workflows
Log Collection and Processing
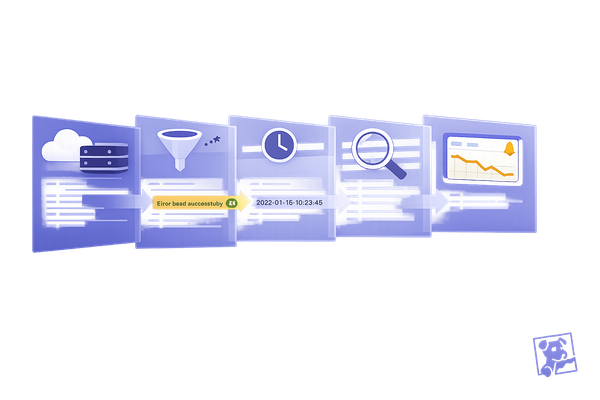
Datadog's API makes it easy to automate log collection and processing using Observability Pipelines, ensuring seamless integration with your data sources.
Here’s a Python snippet to demonstrate how you can set up automated log collection:
from datadog_api_client.v1.api.logs_api import LogsApi

with ApiClient(configuration) as api_client:
    logs_api = LogsApi(api_client)
    log_config = {
        "name": "production-logs",
        "processors": [
            {
                "type": "grok-parser",
                "source": "message",
                "samples": ["[2025-05-12 10:23:45] ERROR User authentication failed"],
                "grok": {
                    "support_rules": "",
                    "match_rules": "%{date:timestamp} %{word:level} %{data:message}"
                }
            }
        ]
    }
    response = logs_api.create_logs_pipeline(body=log_config)
Datadog supports a variety of processors to transform and structure logs effectively. Here’s a quick overview:
| Processor Type | Purpose | Usage |
|---|---|---|
| Grok Parser | Pattern-based parsing | Extract structured data from log messages |
| JSON Parser | JSON log processing | Parse nested JSON payloads |
| Date Remapper | Timestamp normalization | Standardize log timestamps |
| Status Remapper | Log level mapping | Categorize log severity |
| String Builder | Text manipulation | Create custom log attributes |
Log Routing with Tags
Automating log tagging and routing in Datadog can simplify your log monitoring workflows. Tags are key to filtering and directing logs to the appropriate teams or processes.
For example, you can use tags like:
- env:production (environment)
- service:api (service name)
- team:devops (responsible team)
- compliance:hipaa (compliance-related logs)
To implement routing rules with these tags, configure pipeline filters like this:
routing_rules = {
    "filter": {
        "query": "service:payment-api AND @compliance:pci",
        "sample_rate": 1.0
    },
    "processor": {
        "type": "pipeline",
        "name": "secure-payment-logs",
        "is_enabled": true
    }
}
Pro Tip: Ensure tag inheritance from your infrastructure to maintain consistency across your observability stack. For instance, when new containers or services are created, they should automatically inherit tags from their parent resources.
To safeguard sensitive information before routing logs, you can use Datadog's sensitive-data-scanner. Here's an example:
sensitive_data_processor = {
    "type": "sensitive-data-scanner",
    "name": "PII Scrubber",
    "pattern_types": ["credit_card", "email", "api_key"],
    "tags": ["compliance:gdpr"]
}
This helps you stay compliant while keeping your log management secure and efficient.
Setting Up Alert Systems
This section builds on our API endpoints to guide you through optimizing your alert management process.
Creating Alert Templates
The Datadog API allows you to create standardized alert templates, ensuring consistent monitoring across your systems. Here's an example:
from datadog_api_client.v1.api.monitors_api import MonitorsApi

monitor_template = {
    "name": "API Latency Alert",
    "type": "metric alert",
    "query": "avg(last_5m):avg:api.response.time{service:payment-api} > 2000",
    "message": "API response time exceeded threshold of 2000ms\n@team-backend\n@pagerduty-critical\n\nLast value: {{value}}\nService: {{service.name}}\nEnvironment: {{env.name}}",
    "tags": ["service:payment-api", "team:backend", "env:production"],
    "priority": 1,
    "escalation_message": "Alert still unresolved after 30 minutes!"
}

with ApiClient(configuration) as api_client:
    monitors_api = MonitorsApi(api_client)
    response = monitors_api.create_monitor(body=monitor_template)
To make your alerts more effective, consider tailoring thresholds and priorities based on the type of alert. Here's a quick reference:
| Alert Type | Threshold | Evaluation Window | Priority |
|---|---|---|---|
| Critical Infrastructure | 95% utilization | 5 minutes | P1 |
| Service Performance | Response time > 2s | 15 minutes | P2 |
| Resource Usage | Memory > 85% | 30 minutes | P3 |
| Business Metrics | Error rate > 5% | 1 hour | P4 |
Once you've defined your alert templates, the next step is deciding how and where these alerts will be delivered.
Configuring Alert Notifications
To ensure alerts reach the right teams quickly, configure notifications to use the preferred channels of your organization:
notification_channels = {
    "message": "{{#is_alert}}\nSystem: {{system.name}}\nAlert: {{alert.name}}\nMetric: {{metric.name}} = {{value}}\n{{/is_alert}}",
    "notification_targets": [
        {
            "channel": "slack",
            "target": "#ops-alerts"
        },
        {
            "channel": "pagerduty",
            "target": "critical-incidents"
        }
    ]
}
For critical alerts that demand immediate attention, you can integrate Datadog with Twilio to send SMS notifications using webhooks:
webhook_config = {
    "name": "SMS Alert Webhook",
    "url": "https://api.twilio.com/2010-04-01/Accounts/{account_sid}/Messages",
    "headers": {
        "Authorization": "Basic {encoded_credentials}",
        "Content-Type": "application/x-www-form-urlencoded"
    },
    "payload": "To={phone_number}&From={twilio_number}&Body={alert.message}"
}
Datadog's templating engine allows you to personalize alert messages with details like host, service, and metric context. Additionally, integrating with the Datadog Slack App ensures alerts are visible directly within team channels, simplifying incident response workflows.
Before rolling out alerts, it's crucial to test your configurations:
test_options = {
    "monitor_id": monitor_id,
    "notify_list": ["@ops-team", "#alerts-channel"]
}
monitors_api.validate_monitor(body=test_options)
API Integration Methods
Integrating the Datadog API with your development and deployment tools can help automate and streamline monitoring processes.
Adding Datadog to CI/CD
Incorporating Datadog into your CI/CD pipeline ensures consistent monitoring throughout your deployment stages. The datadog-ci tool offers a straightforward way to integrate:
# Install via NPM
npm install -g @datadog/datadog-ci

# Pull the Docker container
docker pull datadog/ci
Here’s an example of a GitLab CI configuration:
# GitLab CI configuration
deploy_monitoring:
  image: datadog/ci
  script:
    - datadog-ci junit upload ./test-results
    - datadog-ci git-metadata upload
    - datadog-ci deployment track
  environment:
    name: production
And for those using Ansible:
# Ansible playbook
- hosts: webservers
  roles:
    - datadog.datadog
  vars:
    datadog_api_key: "{{ vault_dd_api_key }}"
    datadog_agent_version: "7.42.0"
Beyond CI/CD pipelines, Datadog is also a powerful tool for monitoring serverless functions.
AWS Lambda Integration

Datadog extends its capabilities to serverless environments, making it an excellent choice for monitoring AWS Lambda functions. Here’s a real-world example:
"In March 2024, GlobalRetail Inc., a major e-commerce company, integrated Datadog's Lambda extension with their AWS Lambda functions to monitor order processing. By deploying the Datadog Lambda Layer (version 7) in the us-west-2 region, they collected enhanced metrics, custom metrics, traces, and real-time logs. This helped them identify and resolve a memory leak issue that was causing sporadic failures in order processing. After fixing the issue, they saw a 20% improvement in order processing time and a 15% drop in error rates." (Source: Internal Datadog Case Study, March 2024)
Here’s how you can monitor a Python-based Lambda function with Datadog:
# Python Lambda function with Datadog monitoring
from datadog_lambda.wrapper import datadog_lambda_wrapper

@datadog_lambda_wrapper
def lambda_handler(event, context):
    return {
        'statusCode': 200,
        'body': 'Success'
    }
Enhancing Integration Security
To secure your Datadog API integrations, consider implementing the following measures:
| Security Measure | Implementation | Purpose |
|---|---|---|
| Authentication | OAuth2/OpenID Connect | Verify identities securely |
| Rate Limiting | Configurable thresholds | Protect against denial-of-service attacks |
| Access Control | Role-based permissions | Enforce least-privilege access |
| API Monitoring | Datadog API Catalog | Track usage and detect potential threats |
"Datadog API Catalog provides organizations with a centralized view of all of their APIs. With this visibility, teams can manage standardized, approved, and production-ready APIs within Datadog, monitor their performance and reliability, and quickly identify who owns certain endpoints for faster triage during incidents."
Conclusion: Making the Most of API Automation
Datadog's API automation offers a smarter approach to managing incident response, ensuring uniformity, and adapting effortlessly to growing demands. By reshaping how monitoring and alerting work across your infrastructure, it empowers organizations to operate with greater efficiency.
"Reacting quickly to changes in complex systems requires automation. Datadog provides an intuitive way to leverage context-rich data to automate monitor creation, update integrations, and reduce complexity and overhead in reliability and incident response engineering."
These capabilities bring clear advantages to businesses. Here's how adopting Datadog's API automation can make a difference:
| Automation Benefit | How It Works | Business Impact |
|---|---|---|
| Faster Incident Response | Automated workflow triggers | Speeds up response times by cutting out manual delays |
| Consistent Processes | Standardized blueprints | Reduces human error through uniform procedures |
| Scalability | Workflows that grow with demand | Handles increasing infrastructure complexity with ease |
| Cost Efficiency | Less manual intervention | Reduces operational expenses |
FAQs
How can I securely use the Datadog API to automate monitoring tasks?
To ensure secure usage of the Datadog API, rely on API keys and application keys. These keys work hand-in-hand to authenticate users and manage access to your Datadog data. Application keys are particularly useful as they let you set specific authorization scopes, allowing you to grant only the permissions needed for each task.
It's essential to stick to the principle of least privilege - only assign the minimum access necessary for a key's intended use. If a key is compromised, revoke it immediately and create a new one to protect your system. Regularly reviewing and updating your keys is another crucial step to reduce risks and keep your operations secure.
What are the best practices for securely managing and rotating API and application keys in Datadog?
To keep your API and application keys secure in Datadog, here are some essential practices to follow:
- Regularly update keys: Make it a habit to rotate API keys every 90 days. If a key is ever leaked, compromised, or if an employee leaves your organization, replace it immediately.
- Ensure zero downtime during rotation: Before deactivating an old key, generate and deploy a new one to maintain uninterrupted access. Automating this process with Datadog's API can save time and reduce errors.
- Limit permissions with precision: When creating application keys, assign only the necessary authorization scopes to minimize potential misuse.
- Act swiftly on exposures: If a key is exposed, revoke it right away. Remove it from any public files, generate a replacement key, and update all systems that rely on the affected key.
- Utilize service accounts: For automation tasks, rely on service accounts rather than tying keys to individual users. This approach simplifies management and enhances security.
By following these steps, you can strengthen your infrastructure's security and minimize the chances of unauthorized access to your Datadog environment.
How do I use the Datadog API to integrate monitoring and alerts into my CI/CD pipeline?
To seamlessly incorporate Datadog's API into your CI/CD pipeline, you can use it to automate essential monitoring tasks like sending metrics, retrieving events, and setting up alerts. The first step is to generate your Datadog API and Application keys. These keys are crucial for secure authentication and access to Datadog's API features.
To get started, you can install the Datadog CI tool using NPM, Yarn, or as a standalone binary. This tool enables you to upload data, such as JUnit test reports and Git metadata, directly into Datadog. This makes it easier to monitor and troubleshoot your pipeline in real-time. Automating these processes not only saves time but ensures your system remains under constant observation during deployments. For a step-by-step guide, check out the Datadog documentation or explore their API client libraries for even more integration options.

