Datadog Configuration: Best Practices
Optimize your Datadog configuration with best practices for tagging, integrations, security, and custom metrics to enhance monitoring and reduce costs.
Want to avoid missed alerts, high costs, and monitoring headaches? Start with a solid Datadog setup.
Here’s what you need to know:
- Tagging matters: A clear tagging strategy improves efficiency by 40%. Use tags like
env,team, andcost centerto align data with business goals. - Integrations are key: Connect cloud platforms (AWS, Azure, Google Cloud), databases (MySQL, PostgreSQL), and web servers (Nginx, Apache) for deeper insights.
- Secure your setup: Protect API keys, encrypt data, and use tools like Datadog’s Sensitive Data Scanner to avoid compliance risks.
- Custom metrics = smarter decisions: Track business-specific metrics like cart abandonment rates or user engagement for better insights.
- Dashboards and alerts save time: Organize key metrics visually and set actionable alerts to prevent downtime.
Pro Tip: Regularly review and update your configuration to keep it aligned with your business needs. A well-optimized Datadog setup can reduce costs by up to 30% and improve system reliability.
Let’s dive into how to get your Datadog setup right from the start.
I01 Set Up the Datadog Agent and Start Collecting Data
Getting Ready for Datadog Setup
Taking the time to prepare ensures a hassle-free Datadog setup and reduces potential troubleshooting down the line.
Check System Requirements
Start by confirming that your operating systems meet Datadog's compatibility requirements. This includes verifying supported versions for Linux distributions like Amazon Linux, Alma Linux, CentOS, Debian, Fedora, Oracle Linux, Red Hat, Rocky Linux, SUSE, and Ubuntu, as well as Windows and macOS.
For cloud provider integration, make sure Datadog is configured to work with managed services in AWS, Azure, and Google Cloud. This includes services like AWS RDS, Azure App Service, and Google Cloud Functions.
On the network side, double-check your firewall rules, proxy settings, and connection configurations to ensure secure and seamless data transfer.
Set Up Access Permissions
Permissions play a key role in both security and collaboration. Implement Role-Based Access Control (RBAC) to assign roles tailored to specific needs, such as:
- Read-only access for developers
- Full access for DevOps teams
- Restricted views for executives
To keep things secure and efficient, schedule regular permission reviews. As teams grow and responsibilities shift, outdated permissions can become a risk or slow down workflows. Aim to audit permissions quarterly to update roles and remove unnecessary access.
Plan Your Tagging Strategy
Tags are essential for making sense of your monitoring data in Datadog. They act as key-value pairs that help you filter, group, and analyze your infrastructure and application metrics.
Start by using automatic tags from your current platforms. Datadog can automatically pull tags from systems like AWS and Kubernetes. For instance:
- AWS tags: account, autoscaling-group, availability-zone, instance-type, region, and more.
- Kubernetes tags: component, instance, managed-by, os, and name.
"Tagging is a powerful tool for correlating your infrastructure and application data throughout Datadog...you can develop a deliberate tagging approach to help you optimize your monitoring workflows."
Next, create custom tags to align technical data with business goals. Examples include tags for environment (env), team, application, or cost center.
Pay special attention to primary tags. These tags, like env or kube_cluster, determine how Datadog aggregates performance metrics. Setting these up properly allows for quick filtering and comparison across environments, which is especially helpful when diagnosing complex issues.
Another key step is service categorization using tags. Assign tags based on a service's function (e.g., web server, database, cache) and its role in the business (e.g., customer-facing, internal tool). This makes it easier to evaluate the business impact of any service disruptions.
Finally, standardize and document your tagging conventions. Clear guidelines ensure that everyone uses consistent tag names and values, making your data far more effective for analysis and troubleshooting.
Once you've nailed down system requirements, permissions, and tagging strategies, you're ready to dive into the core configuration steps and bring your Datadog setup to life.
Main Configuration Steps
Get your Datadog monitoring up and running by implementing its essential components.
Install and Set Up the Datadog Agent
The Datadog Agent is the bridge between your infrastructure and Datadog, collecting events and metrics from your systems and sending them for analysis. It's compatible with multiple platforms, including Windows, macOS, Docker, and Kubernetes, and operates efficiently, using just about 0.08% of your CPU.
For Linux, download the appropriate installation package from the Agent installation page in your Datadog account. You'll also need to add Datadog's repository to your package manager. On Windows, grab the MSI installer and run it with administrator privileges. In containerized setups, use the official Datadog Agent Docker image, supplying your API key and configuration details.
To streamline deployments across multiple systems, tools like Chef, Puppet, or Ansible can automate the Agent installation and setup. The datadog.yaml file is the heart of the Agent's configuration, letting you define critical settings like your API key, hostname, log collection preferences, and integration-specific parameters.
Once the Agent is set up, the next step is connecting your key services to expand your monitoring capabilities.
Connect Key Integrations
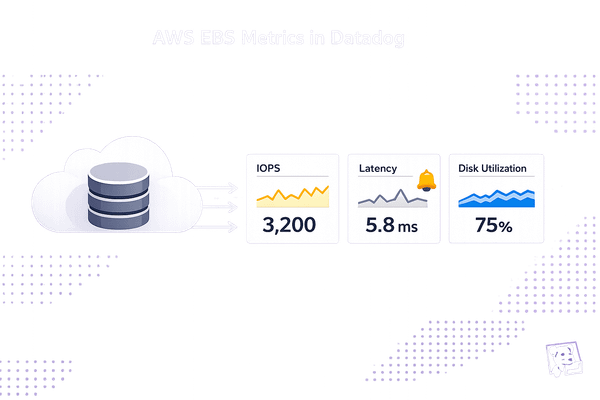
Integrations supercharge Datadog by extending its monitoring across your tech stack. Start with cloud providers like AWS, Azure, or Google Cloud Platform, which automatically pull metrics from managed services such as databases, load balancers, and storage systems.
For databases like MySQL, PostgreSQL, or MongoDB, setting up integrations helps track query performance, connection counts, and resource usage - metrics that directly impact application performance.
Web servers such as Apache, Nginx, or IIS can also be integrated to monitor request rates, response times, and error rates. To enable these, activate the necessary modules and ensure the Agent has access to server status pages.
Application Performance Monitoring (APM) integrations dig deeper into your app's performance. These often require language-specific libraries - like ddtrace for Python or the Datadog Java Agent for Java applications - to provide detailed traces of requests and database interactions.
For containerized environments, integrations with Kubernetes or Docker Swarm allow automatic discovery and monitoring of your applications. These setups usually involve tweaking configuration files and testing to confirm that metrics are flowing into Datadog.
With integrations in place, it's time to lock down your system's data flow.
Set Up Secure Connections
Once your Agent and integrations are configured, securing your data flow ensures uninterrupted and safe monitoring.
Start by securing your API keys with a dedicated secrets manager. Protecting your keys prevents unauthorized access to your Datadog account.
Encryption is key to safeguarding data. Datadog uses TLS with symmetric encryption to secure data in transit between your systems and their platform. For data stored within Datadog, apply appropriate encryption methods to ensure it remains protected.
To prevent sensitive information from reaching the platform, enable Datadog’s Sensitive Data Scanner. This tool automatically identifies and removes sensitive data from logs, helping you stay compliant while preserving the value of your monitoring data.
Audit logs add another layer of security by tracking who accesses your data and when. Use tools like AWS Management Console, Azure Portal, or Google Cloud Console to enable and review these logs. They’re invaluable for spotting unusual access patterns and potential threats.
For routine security updates, Datadog allows API key rotation without needing to restart the Agent. This seamless process keeps your system secure without interrupting operations. If your organization operates in a regulated industry, consider using the FIPS Agent, which meets stricter encryption standards.
Lastly, use tag-based Data Access Controls to manage access to specific data sets. By restricting access based on tags, you can ensure sensitive production data is only available to authorized personnel.
Custom Metrics and Advanced Setup
Once your core configuration is in place, you can take your observability to the next level by incorporating custom metrics and advanced monitoring tools.
Track Custom Business Metrics
To get deeper insights into your operations, you can integrate custom metrics that align with your business goals. For example, e-commerce platforms might monitor cart abandonment rates or checkout completion times, while SaaS companies could track user engagement metrics. These metrics can be calculated using scripts or SQL queries and then sent to Datadog through the Agent or API.
With Datadog's Metrics without Limits™, you can collect all metrics while indexing only the most relevant tags, potentially cutting custom metric usage by as much as 70%. Built-in alerts help you monitor usage effectively, ensuring your observability setup remains efficient.
Once you've refined your metrics, the next step is to standardize how you collect and manage logs.
Configure Log Collection
Centralized log management transforms scattered data into actionable insights. Start by standardizing your log formats - JSON is a great choice for consistency. Assign proper log levels, such as INFO for general operations, WARN for potential issues, and ERROR for critical problems. Each log entry should include critical context like timestamps, unique identifiers, and clear descriptions.
For AWS serverless environments, tools like lambda-log, aws-logging-library, or Log4j2 can streamline logging. You can also use the Datadog Lambda extension as a Lambda Layer for Python and Node.js functions to send logs directly to Datadog. Alternatively, deploy the Datadog Forwarder Lambda function to subscribe to CloudWatch Logs groups.
With Logging without Limits™, Datadog ingests all logs but indexes only the data you need. Use Log Patterns to filter out unnecessary log types and convert unindexed logs into metrics for long-term tracking. Datadog's log processing pipelines automatically extract metadata, making logs searchable and easy to correlate with distributed traces and metrics. To ensure compliance and security, avoid logging sensitive data, use unique identifiers to trace requests across systems, set up retention policies, and configure alerts for critical issues.
Use Advanced Monitoring Tools
Advanced tools like APM, service maps, and synthetic monitoring offer unparalleled visibility into your systems. Application Performance Monitoring (APM) provides code-level insights that go beyond standard monitoring. Yony Feng, CTO & Co-founder of Peloton, highlighted its impact, noting that it can cut response times by 80–90%.
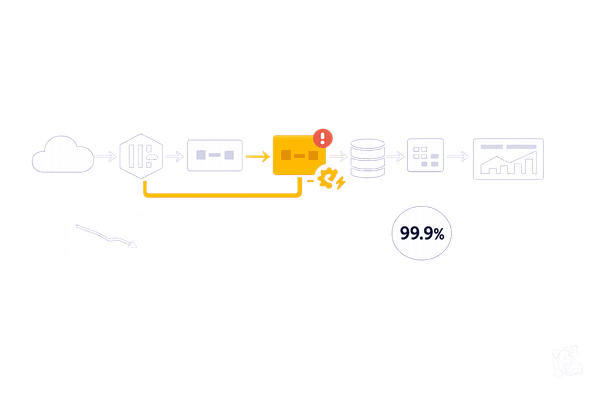
Service maps give you a real-time view of your application's data flows and dependencies, making it easier to pinpoint and resolve performance bottlenecks. Ian Schell, Site Reliability Architect at CVENT, praised Datadog's tracing capabilities:
"The robustness and responsiveness of Datadog Distributed Tracing, as well as the unique way in which traces are visualized, makes it very easy to spot problems quickly and nip them in the bud."
Real User Monitoring (RUM) bridges the gap between backend performance and user experience. By adding a simple JavaScript snippet to your web applications, you can track key metrics like page load times, user sessions, and client-side errors. Meanwhile, synthetic monitoring proactively tests critical user paths - such as login flows, checkout processes, or API endpoints - by simulating user interactions.
Finally, customize dashboards to highlight essential KPIs, monitor alerts, and visualize the geographical distribution of user traffic. With integrations for over 600 technologies and a 15-month retention period for metrics without roll-ups, Datadog ensures you're always equipped to make data-driven decisions.
Testing and Ongoing Management
After setting up your core Datadog configuration and integrations, it's time to test the setup and establish processes to keep everything running smoothly. These steps ensure that your monitoring continues to provide accurate, actionable insights as your business grows and changes.
Test Your Setup with Dashboards
Dashboards are an essential way to confirm that your Datadog setup is working as intended. Start by enabling the collect_system_metrics: true setting and verifying that system metrics, such as CPU and memory usage, are being captured. If you don’t see updated data, you may need to restart the Agent, as explained in earlier steps.
When building dashboards, focus on the metrics that matter most to your business. Avoid clutter by organizing information logically. For example, group related metrics - like network performance next to server metrics - so you can easily compare data. Use widget types strategically:
- Timeseries graphs for trends over time
- Heat maps to highlight performance hotspots
- Tables for detailed log insights
To keep things clean and easy to read, limit the number of widgets and use consistent color schemes. Custom tags and filters can also help you sort data by environment, service, or team. This makes it simpler to identify and isolate issues when they occur. Once your dashboards are in place, the next step is setting up alerts to catch problems early.
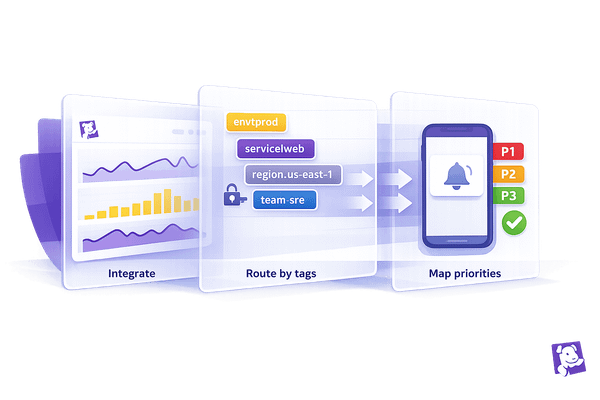
Set Up Alerts and Notifications
Proactive alerts are critical for staying ahead of potential issues. In fact, studies show that more than 70% of organizations with effective alert systems experience fewer major downtime incidents. The challenge is finding the right balance - alerts should highlight real problems without overwhelming your team.
Start by identifying the systems and applications that are most critical to your operations. Create alerts for metrics that directly affect user experience or business performance. Use baseline performance data to set thresholds: thresholds that are too tight can lead to alert fatigue, while overly relaxed settings might cause you to miss critical issues.
Choose notification channels that align with your team's workflow. Whether it’s Slack, email, or PagerDuty, make sure alerts reach the right people quickly. Regularly test your alerting system to ensure it works as expected, and periodically review thresholds to keep them aligned with current conditions.
Keep Your Configuration Updated
A monitoring setup isn’t something you configure once and forget. Regular updates are essential to ensure your Datadog configuration stays relevant. Sixty percent of IT teams report improved performance after fine-tuning their monitoring systems, and successful teams often revisit their analytics strategies every three months.
Schedule quarterly reviews with cross-functional teams to evaluate and update metrics, dashboards, and alerts. This process helps you remove outdated metrics and add new ones that align with shifting business goals. Pay special attention to scaling scenarios - if your infrastructure grows or changes, you may need to adjust tagging strategies, custom metrics, and alert thresholds. Consistent tagging practices, for example, can increase visibility into application performance by 30%.
As new services are deployed, update log collection settings and review retention policies to strike the right balance between cost and accessibility. If you’ve integrated new tools into your stack, make sure your dashboards take full advantage of any additional features they provide. Finally, document all configuration changes in a change log. This makes it easier for your team to track updates and is especially helpful during incident response.
Conclusion
A well-structured Datadog setup lays the foundation for effective monitoring and scalable growth. By applying the strategies discussed - like thoughtful tagging, seamless integration, and thorough testing - you can ensure your monitoring evolves alongside your business needs.
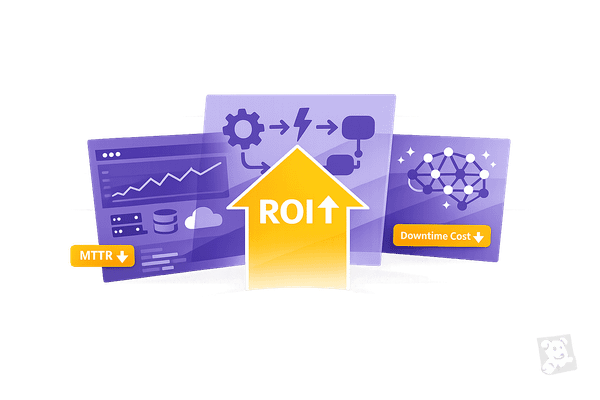
The financial upside of proper configuration is clear. For example, using PrivateLink can reduce data transfer costs by as much as 80%. Datadog’s transparent pricing model complements this efficiency, with infrastructure monitoring starting at $15 per host monthly and container monitoring available for just $1 per prepaid container per month.
"It's not about tradeoffs between cost and performance: cost is a need, just as important as scalability and security. CCM has empowered engineers in our organization to understand this and act on cost data in the same way they would on performance, to maintain efficiency as we scale." - Tim Ewald, CTO, Kevel
Cost optimization doesn’t just save money - it aligns your spending with your business goals. Features like streamlined data retention help avoid surprise expenses while keeping operations efficient.
Keep in mind that configuring Datadog isn’t a one-and-done task. Regular reviews and updates are crucial as your business grows. For small and medium-sized businesses, an optimized Datadog setup can be a game-changer, ensuring system reliability, controlled costs, and the ability to scale with confidence.
If you’re looking for more expert insights to guide you through your Datadog journey, check out Scaling with Datadog for SMBs (https://datadog.criticalcloud.ai).
FAQs
What’s the best way to create a tagging strategy in Datadog to support my business goals?
To build a strong tagging strategy in Datadog, start with unified service tagging. This approach uses three essential tags - env, service, and version - to link your telemetry data, making it more straightforward to analyze and interpret. It's also important to establish a clear and consistent naming convention for your tags to keep them intuitive and practical as your system evolves.
Tags should reflect your business priorities. For instance, you can track key dimensions like specific departments, projects, or customer groups. Make it a habit to regularly review and adjust your tagging structure to ensure it aligns with your monitoring requirements and supports your shifting business objectives.
What are the best practices for connecting cloud platforms and databases to Datadog for better insights?
To make the most of Datadog when connecting your cloud platforms and databases, start by tapping into its built-in library of integrations. These integrations make it easy to connect services like AWS, Google Cloud, Azure, and widely-used databases such as PostgreSQL and MySQL. Once connected, you can monitor critical performance metrics, track resource usage, and get a complete picture of your infrastructure in one place.
For databases, enable Database Monitoring to dig deeper into query performance, spot bottlenecks, and review historical trends. Customizing the setup based on your specific database ensures more precise insights and quicker issue resolution. A well-configured system not only boosts visibility but also helps you make better use of resources and improve overall system performance.
What are the best practices for securing my Datadog setup, especially regarding API keys and sensitive data?
To keep your Datadog setup secure, it's important to manage API keys and sensitive data carefully. Start by assigning minimal privileges to application keys - only give them access to what’s absolutely necessary. Make it a habit to revoke unused keys regularly, and use secrets management tools to safely retrieve sensitive data when needed.
Be mindful of the data you send to Datadog. Filter out unnecessary or sensitive information before it even reaches the platform. Tools like the Sensitive Data Scanner can help you identify and handle sensitive data in your logs. If you detect leaked credentials, act quickly - revoke compromised keys immediately to minimize risks.
Taking these steps to control access and protect sensitive information will help keep your Datadog environment secure and reliable.