Datadog for SMBs: Best Practices for Monitoring
Learn best practices for using a comprehensive monitoring tool to enhance system performance and manage costs effectively in small businesses.
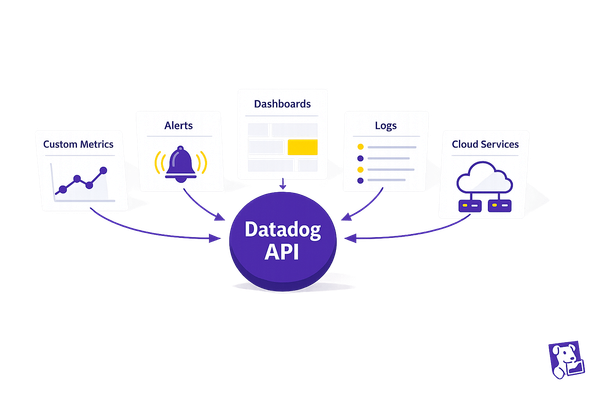
Want to improve your small business's system performance without a big IT team? Datadog is a simple, all-in-one monitoring tool that helps small and medium-sized businesses (SMBs) keep systems running smoothly, catch issues early, and grow without technical headaches.
Key Takeaways:
- Why Monitoring Matters: Stay ahead of system problems, improve service quality, and scale easily.
- Essential Features for SMBs:
- Real-time system insights
- Unified dashboards for metrics, logs, and performance
- Over 850 integrations
- AI-powered event management to reduce noise
- Quick Setup: Install the Datadog Agent, focus on critical systems, and create clear dashboards.
- Smart Alerts: Set meaningful thresholds, prioritize alerts, and connect notifications to tools like Slack or email.
- Cost Management Tips: Automate monitoring, filter unnecessary logs, and review usage quarterly to avoid overspending.
Datadog simplifies monitoring, so you can focus on growing your business while keeping your systems reliable.
Basic Datadog Setup Guide for SMBs
Setting Up the Datadog Agent
To get started, install the Datadog Agent to gather metrics, logs, and traces from your systems. It works with various operating systems, including Windows, Amazon Linux, and AIX. For step-by-step installation instructions, check Datadog's official guide tailored to your specific system.
Selecting Key Systems to Monitor
When setting up Datadog, focus on monitoring the systems that are most critical to your business. Here's where to start:
-
Customer-Facing Services
Keep an eye on your main web applications and APIs. Track response times, error rates, and user experience metrics to ensure smooth operations. -
Core Infrastructure
Monitor essential resources like CPU usage, memory, disk space, and network performance to maintain system reliability. -
Database Systems
Pay attention to query performance, connection pools, and storage capacity. This helps avoid bottlenecks that could disrupt your services.
Once you've identified these priorities, create dashboards to visualize these metrics clearly and efficiently.
Building SMB-Focused Dashboards
Dashboards are essential for turning raw data into actionable insights. Design them to highlight critical information without overwhelming your team. Focus on these key areas:
- System Health: Keep tabs on CPU, memory, and disk usage to manage resources effectively.
- Application Performance: Monitor response times and error rates to ensure your services meet quality standards.
- Business Metrics: Track transaction volumes and user sessions to understand how performance impacts revenue.
You can also customize dashboards for different roles - offering high-level summaries for executives and detailed technical data for IT teams.
Alert Setup and Management
Setting Alert Levels and Limits
Set thresholds that align with your business goals to ensure alerts are meaningful and avoid overwhelming your team.
Here are key principles for configuring thresholds:
- Symptom-Based Alerting: Focus on customer-facing symptoms. For instance, instead of flagging every CPU spike, set alerts for when API response times exceed 500ms - something that directly impacts users.
-
Alert Priority Levels: Organize alerts into three severity tiers for clarity:
Priority Level Response Time Example Triggers High Immediate (24/7) Service outages, security breaches Moderate Business hours Performance issues, storage at 80% Low Next business day Non-critical warnings, trend analysis - Evaluation Windows: Avoid unnecessary alerts by setting conditions like triggering only when CPU usage stays above 90% for 5 minutes.
These tailored thresholds ensure your alert system works effectively with communication tools.
Connecting Alerts to Communication Tools
Link alerts to the tools your team uses most. Datadog supports integration with email, Slack, and webhooks.
- Install the Datadog Slack App.
- Assign specific channels to different alert priorities.
- Use slash commands for quick interactions.
- Customize notification templates for clarity.
Alert System Maintenance
Once your alerts are configured and integrated, it’s crucial to keep them running smoothly. Regular maintenance prevents your team from drowning in unnecessary notifications.
- Alert Analysis: Use the Monitor Notifications Overview dashboard to spot noisy alerts. Adjust thresholds to reduce false positives.
- Alert Optimization: Fine-tune alerts by adding recovery thresholds, grouping related notifications, using conditional routing, and scheduling maintenance windows for planned downtime.
Regular reviews keep your system efficient and your team focused on what matters most.
Performance Monitoring Basics
Key SMB Performance Metrics
Small and medium-sized businesses (SMBs) need to monitor two types of metrics: work metrics and resource metrics. These metrics help inform operational decisions and ensure smooth system performance.
Work metrics provide a snapshot of how a service is performing:
| Metric Type | Description |
|---|---|
| Throughput | Tracks the amount of work being processed (e.g., requests per second) |
| Success Rate | Measures the percentage of successful transactions |
| Error Rate | Monitors the frequency of failed transactions over time |
| Latency | Assesses operational speed, such as API response times |
Resource metrics focus on the system's underlying infrastructure:
- Utilization: Tracks CPU and memory usage patterns.
- Saturation: Examines queue lengths and processing delays.
- Availability: Measures uptime and system responsiveness.
- Internal Errors: Highlights system failures that might not directly impact work metrics but could signal deeper issues.
With these metrics in place, tools like Datadog can refine performance monitoring by identifying real-time anomalies.
How Analytics and Issue Detection Work
Datadog's AIOps uses machine learning to identify issues before they escalate. The platform applies three distinct algorithms based on the nature of the metrics:
- Basic Algorithm: Best suited for unpredictable metrics, such as those from new or unstable services.
- Agile Algorithm: Ideal for metrics with seasonal patterns, like daily website visits or monthly billing cycles.
- Robust Algorithm: Tailored for metrics with stable, recurring patterns, this algorithm adapts over time to minimize false alerts.
These analytics also enhance security by pinpointing potential vulnerabilities.
Security Metrics and System Monitoring
Ongoing monitoring is essential for maintaining system security and health. Areas of focus include:
- Monitoring login activity, user behavior, and system changes.
- Ensuring compliance with standards like PCI DSS and HIPAA.
- Keeping a close watch on cloud resources.
Datadog integrates performance and security metrics, allowing businesses to link system performance with security events. The platform automatically identifies and prioritizes vulnerabilities based on their potential impact.
To support long-term planning and trend analysis, keep metrics at full granularity for at least 15 months. This practice aids in capacity planning and helps uncover patterns over time.
Cost Management and Growth Planning
Monitoring Task Automation
Use Datadog to streamline monitoring by automating tasks, reducing manual work, and maintaining complete system visibility.
- Set Up Automated Alert Management: Create tiered alerts that escalate only when genuinely unusual events occur. This helps avoid alert fatigue.
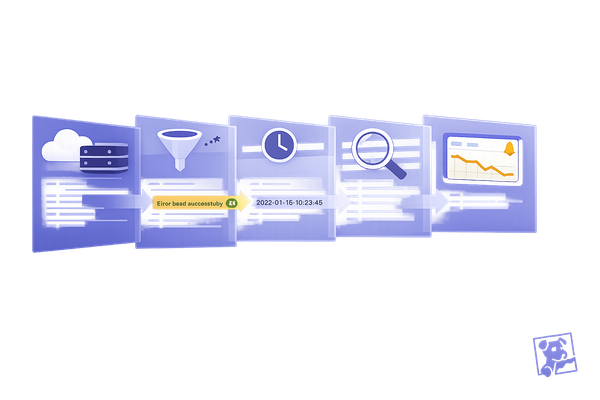
- Implement Log Pattern Detection: Group similar logs automatically to minimize manual log analysis.
- Configure Automated Reporting: Schedule performance reports to monitor system health trends over time.
Once monitoring is automated, focus on optimizing your data pipeline costs for better budget management.
Data Pipeline Cost Control
Did you know the top 10 indexes can account for 80% of logs and 90% of total costs? Managing these effectively can make a big difference.
| Cost Control Measure | Implementation Strategy | Potential Savings |
|---|---|---|
| Log Management | Use Flex Logs for high-volume data ($0.05/million logs) | Savings depend on usage volume |
| Data Transfer | Switch to PrivateLink instead of NAT Gateways | Up to 80% savings on transfer costs |
| Container Monitoring | Pre-pay for containers ($1/container/month) | Cheaper than on-demand rates ($0.002/hour) |
Other ways to cut costs include:
- Filtering out logs that aren't essential and tweaking metric cardinality to lower data volume
- Converting high-volume logs into metrics for long-term analysis
- Setting index quotas and configuring alerts for when limits are close
- Using log aggregation techniques like deduplication and sampling
Regular System Review Process
Plan quarterly reviews of your Datadog setup to keep monitoring aligned with your business goals and budget. For reference, infrastructure monitoring starts at $15 per host/month, while APM costs $31 per host/month.
Include these steps in your review process:
- Analyze resource usage to find and remove unused components
- Adjust committed use discounts as needed
- Review custom metrics and remove unnecessary tags
- Check log retention policies and sampling rates
To stay ahead of costs, leverage Datadog's pricing calculators to forecast expenses based on actual usage. Incorporate these practices into your overall Datadog strategy to ensure your monitoring setup scales efficiently as your business grows.
Datadog 101 Course | Datadog Tutorial for Beginners | SRE ...
Conclusion: Implementing SMB Monitoring
To effectively monitor your systems, focus on tracking key metrics, managing costs, and planning for growth. Start with your most critical systems and ensure your strategy is flexible enough to adapt as your business evolves. A well-thought-out approach can help you address issues before they affect operations.
Fine-Tune Your Monitoring Setup
Streamline your configuration by focusing on the metrics that matter most to your business. Identify and prioritize these metrics, and disable any unnecessary ones to minimize data overload and reduce ingestion costs.
Smart Cost Management
As your business grows, keeping expenses under control is crucial. Here are some practical tips:
- Filter out logs that aren't essential.
- Remove tags that aren't being used.
- Set up alerts to catch unexpected spikes.
- Uninstall Datadog agents from servers that are no longer active.
Keep Your Systems Running Smoothly
Cost management is important, but maintaining system health is just as critical. Regularly review your alert settings, dashboards, and data pipeline costs. Make sure to set up notifications - via email, Slack, or SMS - for events that need immediate attention. This proactive approach helps ensure your operations stay on track.
FAQs
How can small businesses decide which systems to monitor first with Datadog?
To prioritize which systems to monitor with Datadog, small businesses should focus on critical systems and key metrics that directly impact their operations. Start by identifying the systems essential to your business, such as customer-facing applications, payment processing, or internal tools, and ensure they are monitored for performance and reliability.
Collect two types of metrics: work metrics and resource metrics. Work metrics measure the overall health and output of your systems, like transaction rates or user activity. Resource metrics provide deeper insights into system performance, such as CPU usage or memory consumption, and are invaluable for troubleshooting issues. By monitoring these metrics, you can ensure your systems remain reliable and scalable while addressing problems proactively.
Remember, having the right data when you need it is crucial. It’s better to collect data from all critical systems upfront rather than risk missing insights during an unexpected issue.
How can SMBs effectively manage and reduce monitoring costs with Datadog?
To manage and reduce monitoring costs with Datadog, SMBs can focus on optimizing their data usage and configurations. Start by filtering out non-essential logs, reducing metric cardinality, and setting appropriate log retention policies. Use custom metrics strategically and apply tags and filters to ensure you're only monitoring what's necessary.
Additionally, consider sampling traces, excluding unnecessary events from indexing, and lowering log retention where feasible. Anomaly detection and alerts can help you proactively address issues without over-collecting data. For long-term savings, explore committed use discounts to lock in lower rates. By tailoring your setup to your specific needs, you can make the most of Datadog while keeping costs under control.
How does Datadog's AI-powered event management help small businesses minimize unnecessary alerts?
Datadog's AI-powered event management helps small businesses cut down on unnecessary alerts by automatically analyzing and grouping related events. It uses advanced AI to deduplicate and correlate events, ensuring your team only sees the most relevant issues that need attention.
By consolidating related alerts into a single case, Datadog reduces noise and allows your team to focus on resolving critical problems faster. This streamlined approach improves efficiency and ensures your monitoring efforts are both effective and manageable for small businesses.

