Datadog Network Monitoring: Troubleshooting Guide
Learn how to troubleshoot common network monitoring issues with effective strategies and tools for maintaining optimal performance.
Network monitoring issues can cost businesses thousands in downtime, but Datadog offers tools to help identify and resolve problems efficiently. Here's a quick breakdown of how Datadog addresses common challenges:
- Unified Monitoring: Combines network, application, and infrastructure metrics in one dashboard.
- Key Features: Includes Cloud Network Monitoring (CNM) for cloud-native environments and Network Device Monitoring (NDM) for physical devices.
- Common Problems Solved:
- Monitoring Gaps: Fix SNMP configuration or routing issues to ensure full visibility.
- Agent Setup Issues: Verify installation, configuration, and permissions for proper data collection.
- Firewall and Connectivity Problems: Open necessary ports and test network connections to restore communication.
Datadog simplifies network troubleshooting by providing real-time insights, dynamic topology maps, and advanced alerting. Whether you're addressing SNMP errors, firewall blocks, or agent misconfigurations, this guide walks you through practical solutions to keep your systems running smoothly.
Infrastructure & Network Monitoring I Datadog Fireside Chats
How Datadog Network Monitoring Works
Datadog transforms network data into clear insights, offering a single platform to monitor multi-cloud, hybrid, and on-premises systems. By consolidating massive amounts of network data - up to millions of data points per second - it provides a unified view for teams to analyze and act upon.
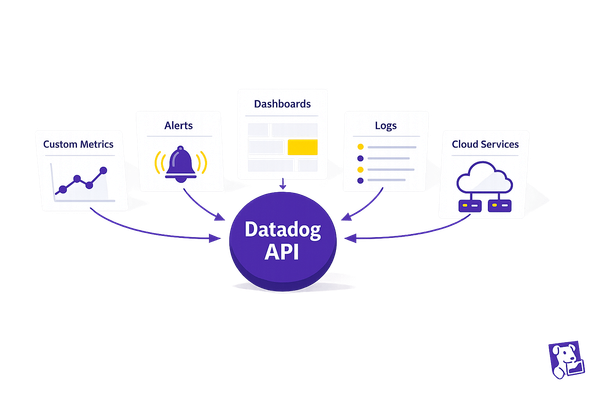
The platform is built on three key components: agents, integrations, and APIs. Agents are lightweight modules deployed on hosts or containers that collect metrics, traces, and logs. Integrations and APIs connect Datadog to databases, messaging systems, and cloud services, enabling automation and deeper data collection. This structure allows Datadog to link network data with infrastructure and application metrics in real time, making it easier to detect and address issues.
How Datadog Collects and Displays Network Data
Datadog uses flexible data collection methods to adapt to various infrastructures, scaling automatically as new cloud instances or containers come online.
In cloud-native setups, the platform tracks traffic between endpoints - whether they are services, pods, clusters, or hosts. This level of detail helps teams quickly identify communication issues. Datadog also visualizes the traffic path between applications step by step, making bottlenecks and routing problems easier to spot.
"We really like how Datadog's CNM product is tied into the rest of the platform. Being able to monitor network traffic all the way down to our containers with Datadog has helped us identify improvements and optimizations across our platform." - Brent Montague, Principal SRE at Cvent
Beyond basic metrics, Datadog offers advanced insights and alerting capabilities. It monitors unusual network behavior, allowing teams to set up dashboards and alerts using tags. One standout feature is its ability to identify "top talkers" on the network - highlighting traffic-heavy sources and the teams behind them, which can help optimize costs. For added security, Datadog tracks DNS traffic patterns and flags connections to suspicious domains.
Main Parts of Datadog Network Monitoring
Datadog's network monitoring system is anchored by two core components: Cloud Network Monitoring (CNM) and Network Device Monitoring (NDM).
Cloud Network Monitoring (CNM) focuses on modern cloud-native environments, offering detailed visibility into traffic between microservices. It’s particularly effective in dynamic systems where services scale rapidly, integrating seamlessly with Kubernetes to provide instant insights into pod communication and internal DNS behavior.
Network Device Monitoring (NDM) addresses traditional network infrastructure, combining data from physical and virtual devices. Using SNMP, it automatically discovers and monitors a wide range of devices - switches, routers, firewalls, load balancers, and more - across multiple vendors. Supported protocols include SNMP, syslog, and Netflow.
"With Datadog NDM we now have detailed information from thousands of devices across our large-scale network inside the Datadog platform, helping our NOC teams isolate and respond to issues faster than ever." - Robert Faria De Oliveira, Infrastructure Operations Manager at Wayfair
The platform also provides dynamic topology maps, which visually display network relationships and dependencies. These maps update automatically as infrastructure changes, ensuring teams always have accurate insights. Datadog integrates with major SD-WAN vendors like Cisco Catalyst SD-WAN, VMware Velocloud, Fortinet, and Meraki, pulling telemetry data directly from Meraki devices such as MX security appliances, MS switches, and MR wireless access points via the Meraki API. Additionally, the Cisco ACI integration offers end-to-end visibility into both physical and logical network health.
Both CNM and NDM work within Datadog’s unified tagging system, allowing teams to group and analyze traffic flows efficiently. This eliminates the data silos that often complicate network troubleshooting in complex systems. By combining CNM and NDM, Datadog reinforces its holistic approach to network monitoring, making it easier for teams to manage and optimize their networks.
Finding and Fixing Common Network Monitoring Problems
Small to medium-sized businesses (SMBs) often encounter network monitoring challenges when using Datadog. These challenges typically fall into three categories: monitoring gaps, agent configuration issues, and connectivity problems. Addressing these problems efficiently can save valuable time and help avoid costly downtime. Let’s explore how to identify and resolve these issues.
Fixing Monitoring Gaps
Monitoring gaps happen when Datadog fails to collect data from certain devices or services, leaving blind spots in your network overview. These gaps can compromise the effectiveness of your monitoring efforts.
One common cause of monitoring gaps is SNMP configuration issues. Many network devices have SNMP turned off by default, which prevents Datadog from gathering important metrics. In June 2023, Mitch Nethercott, a Datadog Engineer, explained:
"The most common error is timeout, which usually indicates that the device has not been configured for SNMP support or network access issues between the agent host and the device."
To identify these gaps, check your agent status by running:
sudo datadog-agent status
This command shows the current state of the agent and highlights devices that aren't responding. Look for timeout errors or devices in your inventory with no recent data. Before adding a device to monitoring, confirm it supports SNMP v2c or v3 over UDP port 161.
Network segmentation can also lead to unexpected monitoring gaps. For example, if your Datadog agent operates in one network segment but needs to monitor devices in another, routing rules or VLAN configurations might block communication. Use tools like ping or telnet to test connectivity between the agent and the devices to pinpoint the issue.
For security-related gaps, Datadog’s Cloud SIEM MITRE ATT&CK Map can help visualize threat detection coverage and identify areas where monitoring may not align with potential attack behaviors.
Once these gaps are addressed, ensure your agents are configured properly before moving on to connectivity issues.
Fixing Agent Setup and Configuration Problems
Agent-related problems often stem from installation errors, misconfigurations, or compatibility issues with the system.
Start by verifying the installation. Check if the agent is running using one of the following commands:
sudo service datadog-agent status  # For older systems
sudo systemctl status datadog-agent  # For newer Linux distributions
If the agent isn’t active, restart it with:
sudo service datadog-agent restart
# or
sudo systemctl restart datadog-agent
Next, review the agent logs located at /var/log/datadog/ for errors such as permission issues, configuration mistakes, or connectivity failures.
Validating the configuration file is equally important. Open /etc/datadog-agent/datadog.yaml and check for correct API keys, hostname settings, and other critical parameters. Even small YAML syntax errors can prevent the agent from starting. To confirm communication with Datadog, use:
sudo datadog-agent info
A status of "ok" indicates successful communication. If errors appear, they might point to network or configuration problems.
Permissions can also cause issues. Ensure installation scripts are run with elevated privileges (sudo) and that the agent has access to necessary log files and system metrics. For example, one user faced EC2 tag synchronization issues on a Windows EC2 instance using IMDSv2 after installing Datadog agent version 7.45. Despite verifying IAM roles and permissions, the problem persisted, showing how complex environments may require checking multiple configuration layers.
After resolving agent-related issues, restart the Datadog agent to apply changes.
Fixing Connection and Firewall Problems
Connectivity and firewall issues can disrupt data collection or cause intermittent monitoring failures.
Start with basic connectivity tests. Run:
ping app.datadoghq.com
This checks whether your host can reach Datadog’s servers. If the ping fails, the issue might be related to DNS resolution, routing, or general network connectivity rather than Datadog-specific settings.
Next, review your firewall configuration. Datadog agents need outbound access over ports 443 and 8125. Corporate firewalls often block these ports by default, so you may need to update your firewall rules. For SNMP monitoring, make sure UDP port 161 is open between the agent and the devices.
Verify the API key in /etc/datadog-agent/datadog.yaml to ensure it matches your Datadog account credentials. An incorrect API key can lead to authentication errors.
Datadog offers integrations with firewall systems like Palo Alto Networks Firewall, AWS Network Firewall, Amazon Web Application Firewall, and Microsoft Azure Firewall. These integrations can help identify configuration issues and potential threats. For instance, one case involved an external host (IP: 158.217.22.173) attempting to connect to multiple ports in quick succession. The firewall blocked the first four attempts but allowed the final connection, which could indicate either legitimate service discovery or malicious port scanning.
In environments with strict outbound filtering, IP whitelisting may be necessary. Consult your network administrator to whitelist the required IP ranges for Datadog servers while maintaining security policies.
After making changes, restart the Datadog agent to confirm that full network visibility is restored.
Testing Fixed Network Monitoring and Keeping It Working
Once you've addressed network monitoring issues, the next step is to ensure everything is functioning as expected. Testing verifies that your monitoring system is collecting accurate data and sending appropriate alerts. Beyond testing, regular upkeep is essential to keep the system reliable over time.
Testing Network Visibility and Alert Settings
Start by confirming that network data collection is fully restored. Use Datadog's Network Path monitoring to check that all metrics are being displayed correctly. Pay attention to any missing data or gaps in collection, as these could signal unresolved problems. The CNM Overview dashboard provides a consolidated view of your network's health and performance across various parts of your distributed system. Additionally, use path visualization tools to verify network latency and packet loss metrics.
Fine-tune your alert settings to avoid being overwhelmed by unnecessary notifications. Use the Monitor Notifications Overview dashboard to review and adjust alerts. Focus on identifying predictable or repetitive alerts, tweak thresholds and evaluation windows to minimize false positives, and group notifications by service or cluster. Scheduling downtimes for maintenance can also help reduce unnecessary alerts. These steps ensure your monitoring system operates efficiently and effectively.
Best Practices for Monitoring Health
Once you've confirmed that metrics and alerts are working as intended, it's important to implement habits that maintain the reliability of your monitoring system. Regularly review alerts and Saved Views for critical queries. Use CNM dashboards to correlate data from the network, applications, and infrastructure, monitoring key metrics like network load, TCP performance, DNS health, and inter-regional traffic. Document any configuration changes and set up automated health checks for agents and alerts.
As your infrastructure expands, correlation monitoring becomes even more critical. Datadog CNM integrates monitoring data from every layer of your stack, making it easier to connect network, application, and infrastructure telemetry. You can also customize the CNM Overview dashboard's Application Overview section to display network throughput alongside application performance data from Datadog APM.
Stay proactive by regularly reviewing agent statuses, configurations, and network settings to adapt to changes in your environment. Use Datadog's advanced tagging features to create monitors and dashboards that track unusual network states. Keeping thorough documentation of configuration updates, alert adjustments, and troubleshooting insights ensures that your team can quickly understand and resolve any future issues. This approach not only maintains monitoring efficiency but also enhances team collaboration.
Using Datadog Resources for SMBs
Small and medium-sized businesses (SMBs) often face unique challenges when it comes to network monitoring. Limited IT resources, tight budgets, and the need for quick, effective solutions make it crucial to have the right tools and guidance. That’s where Scaling with Datadog for SMBs comes in, offering resources designed to help SMBs get the most out of their Datadog investment.
The platform provides detailed guides and step-by-step tutorials to tackle common network monitoring issues. For example, SMBs can access resources on log collection, managing API rate limits, and monitoring cloud environments across multi-cloud and hybrid setups. It also covers essential topics like automating IT monitoring with scheduled checks, enforcing data retention policies, and interpreting workload distribution metrics. These tools are key for maintaining smooth and efficient network operations.
Since cost management is often a top concern for SMBs, the resources include strategies to optimize cloud expenses, manage log ingestion, and reduce alert fatigue. Practical advice helps businesses identify high-traffic areas in their network and pinpoint which teams are responsible, making cloud spending easier to control. Additionally, the platform offers guidance on securing networks by detecting DNS traffic directed to suspicious domains - an especially valuable feature for businesses with limited security teams.
Real-world examples show how these strategies lead to quicker issue resolution and improved visibility into network performance.
Datadog's Network Device Monitoring (NDM) features are also highlighted, including SNMP Trap support, which provides full visibility into potential device issues within hybrid infrastructures. By correlating data from applications, infrastructure, and networks, SMBs can quickly identify monitoring gaps and address them effectively. Using Datadog’s intelligent insights and alerting tools, smaller teams can create monitors and dashboards with advanced tagging, simplifying the management of even complex monitoring setups without requiring deep technical expertise.
The resources available through Scaling with Datadog for SMBs emphasize practical, actionable strategies tailored to SMB needs. They focus on maximizing Datadog’s potential for performance monitoring, optimization, and delivering insights that businesses can act on. This guidance builds on earlier troubleshooting techniques, offering sustainable and cost-effective ways to improve monitoring. From creating real-time metrics dashboards to refining data collection and adopting best practices, these tools grow alongside your business, ensuring your network stays efficient and secure.
Conclusion: Better Network Monitoring with Datadog
Keeping your network running smoothly means staying ahead of potential issues and maintaining visibility into every corner of your infrastructure. This guide has outlined how to tackle common Datadog network monitoring challenges and keep your systems operating efficiently.
The numbers tell a clear story: 65% of network disruptions stem from misconfigurations or faulty hardware, while 30% of access issues are tied to firewall misconfigurations. Addressing these problems proactively can prevent them from escalating into major operational setbacks.
"Proactive monitoring is key to flagging potential issues with your applications and infrastructure early, enabling you to respond quickly and reduce downtime." - Datadog
For small and medium-sized businesses, Datadog's Network Performance Monitoring provides a cost-effective solution at $5/host/month (billed annually). It offers real-time insights into network traffic and performance, allowing businesses to correlate data across applications, devices, and infrastructure for a complete view of network health.
To ensure long-term success, establish baseline performance metrics and encourage a proactive IT approach. Regular testing and maintenance not only improve performance but also enhance customer satisfaction by reducing downtime.
With over 30% of small businesses reporting underwhelming internet speeds, having a reliable network monitoring tool is more important than ever. Datadog's ability to provide a unified view across multi-cloud, hybrid, and on-premises environments ensures SMBs have the visibility they need to optimize resources and maintain seamless operations.
FAQs
How does Datadog's Cloud Network Monitoring work with Kubernetes to monitor pod communication?
Datadog's Cloud Network Monitoring (CNM) works hand-in-hand with Kubernetes to provide a clear, visual map of how containers, pods, and services communicate with each other. It offers detailed visibility into pod-to-pod traffic, keeps an eye on Istio service mesh activity, and monitors DNS health to quickly pinpoint and address network problems.
With this integration, teams can keep a close watch on the performance and connectivity of their Kubernetes setups, ensuring components communicate effectively and the system stays reliable.
What should I do if the Datadog agent isn't collecting data from certain devices due to SNMP configuration problems?
To start, make sure SNMP is enabled on the device and that port 161 is accessible on your network. Double-check your firewall settings to confirm they're not blocking communication. Next, ensure the Datadog Agent's configuration includes the correct SNMP details, like the community string or other credentials.
Take a look at the agent logs for any error messages that might help pinpoint the problem. You should also test the connection to the device from the Datadog Agent's host to confirm everything is reachable. If needed, adjust the configurations to address any issues. If you're still having trouble, refer to Datadog's SNMP integration documentation for more detailed troubleshooting steps.
How can SMBs improve their network monitoring setup with Datadog?
Small and medium-sized businesses (SMBs) can improve their network monitoring by leveraging Datadog's tools to achieve comprehensive visibility across cloud, on-premises, and hybrid setups. Datadog's features, such as Network Device Monitoring, allow businesses to keep a close eye on both physical and virtual network devices. This proactive approach helps detect and fix issues before they escalate and disrupt performance.
To make the most of Datadog, SMBs should adopt smart practices like setting up well-structured dashboards, applying clear and consistent naming conventions, and configuring targeted alerts that align with their specific needs. Keeping an eye on critical metrics - such as latency, traffic, errors, and saturation - is essential for effective monitoring. By staying on top of these metrics, businesses can catch potential problems early, ensure smooth system operations, and create a solid foundation for growth.

