Fix Metric Reporting Errors in Datadog
Learn how to diagnose and fix metric reporting errors in Datadog, ensuring accurate monitoring and effective system performance.
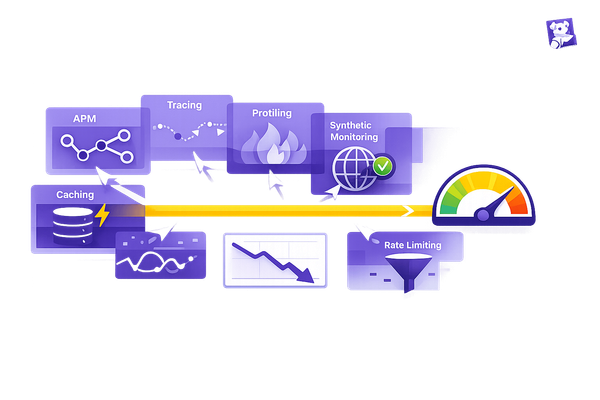
When metrics in Datadog are incorrect or missing, it disrupts your ability to monitor systems effectively. Common causes include misconfigured agents, integration issues, or data limits. Here's how to fix them:
- Check Agent Configurations: Ensure settings like
collect_system_metrics: trueare enabled and dependencies likepsutilare installed. Restart the agent after changes. - Verify Integrations: Confirm API keys, permissions, and network connectivity. Missteps here often block metric collection.
- Review Data Limits: Monitor custom metric usage to stay within plan limits and optimize collection to avoid dropped data points.
Use Datadog tools like Metrics Explorer to diagnose issues, and regularly update agents, review configurations, and set alerts to maintain accuracy over time.
Common Causes of Metric Reporting Errors
Getting to the root of why metrics fail to report correctly is key to resolving the issue. Most errors fall into three main categories, each with its own telltale signs and fixes. Let’s dive into the common causes, starting with agent configuration challenges.
Agent Configuration Problems
The Datadog Agent plays a critical role in collecting metrics, and missteps in its configuration can often lead to reporting issues. For instance, if the datadog.yaml file is set up incorrectly, you might notice missing or incomplete metrics on your dashboards.
One frequent issue is the system metrics collection being disabled or misconfigured. To address this, check that the collect_system_metrics: true setting is enabled in your datadog.yaml file. Without this, you could lose visibility into key metrics like CPU usage, memory stats, and disk performance.
Another common problem is missing dependencies. The agent relies on packages such as psutil to gather system data. If these are outdated or missing, it can lead to silent failures, leaving gaps in your dashboards.
You should also keep an eye out for empty metric values, which can cause parsing errors. For example, back in December 2019, custom metrics for Rails controllers triggered the error: "Dogstatsd: error parsing metrics: invalid metric message format: empty 'name', 'value' or 'text' field." This happened because a nil value was mistakenly submitted as a timing metric in response to HTTP 204 No Content responses.
After making any changes to your configuration, don’t forget to restart the Datadog Agent. This ensures that updates take effect.
Integration Setup Issues
Third-party integrations expand Datadog’s monitoring capabilities, but they also introduce potential points of failure. Misconfigured integrations can lead to incomplete or inaccurate metrics, often due to authentication errors, permission problems, or network connectivity issues.
One frequent issue is an incorrect API key. Double-check that your API key is entered correctly in the configuration file to avoid authentication failures that can block metric collection. Similarly, running installation commands without the necessary privileges can lead to permission-related problems.
Whitelist configurations can also be a source of trouble. If the whitelist doesn’t include all relevant metrics, you might only see partial data. Additionally, ensure the agent can communicate with Datadog servers without interference - firewall restrictions, for instance, can disrupt metric delivery.
To avoid these pitfalls, systematically verify your setup: confirm API keys, check permissions, validate network connectivity, and review whitelist configurations.
Data Sampling and Ingestion Limits
Sometimes, what looks like a metric error is actually the result of data sampling or ingestion limits. Datadog enforces limits on custom metrics based on your pricing plan, and exceeding these limits can lead to dropped data points.
This is particularly challenging for large service clusters, where the sheer volume of metrics can overwhelm collection systems. For example, JMX metrics often run into such issues. Gradually increasing the max_jmx_metrics value while monitoring performance can help you strike a balance between detailed monitoring and system efficiency.
To manage costs and system performance effectively, it’s also a good idea to optimize your metric collection. Reducing the volume of metrics collected can help keep disk usage and ingestion expenses under control.
With these common causes in mind, the next section will walk you through specific troubleshooting steps to get your metrics back on track.
Step-by-Step Troubleshooting Guide
If you're facing issues with metric reporting, follow this guide step by step to pinpoint and resolve the problem. Move through each step in order until you identify the root cause.
Check Metric Collection in Metrics Explorer
Start with the Metrics Explorer, your go-to tool for diagnosing data collection problems. Open the Metrics Explorer in your Datadog dashboard and search for the metrics that aren't showing up. If they’re completely missing, it’s likely a collection issue rather than a display problem. Make sure the correct time range is selected - lags or gaps in recent or historical data often hint at collection issues.
Pay attention to patterns like sporadic gaps or sudden drops, as these may indicate intermittent failures in metric collection. Also, check the metadata panel for details about metric tags, units, and collection frequency. Missing or incorrect metadata could point to configuration errors.
Review Integration Settings and Permissions
Integration misconfigurations are a common cause of metric issues. Begin by reviewing the integration documentation, then head to /etc/datadog-agent/conf.d/ to verify the settings. Check your API keys and run datadog-agent configcheck to identify any misconfigurations. If needed, use pip to install missing dependencies. After making changes, restart the Datadog Agent to apply them.
Once integration settings are confirmed, ensure your monitor configurations align with the frequency of your metrics collection.
Check Monitor Settings and Time Ranges
Mismatched time ranges in monitors can create the appearance of data gaps. Confirm that your monitor settings match the data collection frequency. For instance, if metrics are collected every five minutes but monitors check every minute, you might see gaps that don’t actually exist.
Double-check your query syntax for errors in metric names, tags, or aggregation functions, as even minor mistakes can prevent monitors from returning data. Test your queries in the Metrics Explorer before applying them in monitors. Additionally, fine-tune alert conditions so thresholds are appropriately set - not too sensitive or too lenient.
If everything looks correct here, it’s time to investigate potential network issues.
Fix Network Connection Issues
Network disruptions can interfere with metric transmission from your infrastructure to Datadog’s servers. Use Datadog's Network Device Monitoring (NDM) to track the health of individual devices and catch problems early. Similarly, leverage Cloud Network Monitoring (CNM) to analyze real-time traffic and monitor communications between services, hosts, and Kubernetes pods.
Check the Live Processes view for processes consuming excessive resources, as they might be impacting network performance. On the Network Page, review aggregate connections to see if the issue is isolated or widespread. Also, ensure firewall rules allow the necessary agent communications.
Finally, run synthetic tests to quickly identify and troubleshoot connectivity problems.
Best Practices for Maintaining Metric Accuracy
To ensure accurate reporting in Datadog after addressing metric issues, it's important to follow a few key practices. These steps can help prevent future inconsistencies and ensure your data remains reliable.
Keep Agents and Integrations Updated
Outdated agents or integrations are a common source of metric reporting errors. Datadog updates often include fixes for compatibility issues, security improvements, and performance enhancements that directly influence data accuracy.
- Schedule regular updates: Plan monthly updates for all Datadog agents. To check your current version, run
datadog-agent versionon your systems and compare it with the latest release listed in Datadog's documentation. Similarly, review and update integrations to ensure they stay aligned with any infrastructure changes. - Monitor versions across systems: Keep track of agent and integration versions to identify outdated systems. This helps maintain consistency across your environment.
- Test updates in staging: Before applying updates to production, test them in a staging environment to catch potential issues early.
- Automate updates: Use configuration management tools to streamline updates and reduce manual intervention, ensuring consistency across all systems.
Check Configuration Files Regularly
Over time, small changes to configuration files can lead to significant issues with metric reporting. Regularly reviewing and managing these files can help prevent problems caused by configuration drift.
- Version control for configuration files: Store your service registry files in version control. This makes it easy to track changes and roll back any problematic updates.
- Quarterly reviews: Schedule periodic reviews of your configuration files to ensure they reflect your current infrastructure. Use tools like
datadog-agent configcheckto identify misconfigurations. Pay close attention to API keys, endpoint URLs, and tag setups, as these are often sources of errors. - Cross-reference with internal documentation: Use resources like CMDB tables and internal documentation to confirm your Datadog configurations match your actual infrastructure and services.
Set Up Alerts for Early Problem Detection
Proactive alerts are essential for catching metric issues before they escalate. Datadog offers several types of monitors to help detect and address problems early.
- Metric Monitors: Set these up to alert you when metrics stop reporting or fall outside expected ranges. For example, if your application typically handles 1,000 requests per hour, configure a monitor to alert you if this drops below 800 or exceeds 1,500.
- Anomaly Monitors: These are ideal for spotting subtle deviations from normal patterns, especially for metrics that naturally fluctuate, like website traffic or resource usage.
- Error Tracking Monitors: Use these to detect application-level issues that might affect metric collection. Errors in your applications can lead to incomplete or inaccurate metrics.
Make sure your alerts include actionable details. For example, instead of simply stating that a metric is missing, include specific systems to check and initial troubleshooting steps. This approach minimizes response times and helps your team resolve issues more effectively.
Additionally, set up escalation policies tailored to your team's structure. A tiered system works well for many teams, where initial alerts go to on-call staff, and unresolved issues escalate to senior members or management as needed.
Conclusion: Ensuring Reliable Metric Reporting in Datadog
When it comes to fixing metric reporting errors in Datadog, a mix of immediate solutions and long-term strategies is key. Start by making sure metrics are being collected and processed correctly. Double-check integration and agent configurations, confirm permissions are set up properly, monitor network connectivity, and validate monitor settings and time ranges to catch any inconsistencies.
To maintain accuracy over time, focus on verifying critical configurations regularly. For small and medium-sized businesses (SMBs), precise metric reporting isn't just a technical necessity - it’s a competitive edge. Reliable monitoring data helps maintain service uptime, enhances customer satisfaction, and optimizes resource allocation, all of which are essential for SMB growth.
Datadog’s Metrics Explorer can speed up troubleshooting by quickly identifying discrepancies. From there, digging into integration logs, resolving network issues, and fine-tuning monitor configurations will address most common problems .
Combining immediate fixes with ongoing maintenance creates a strong monitoring framework. Proactive alerts can catch small issues early, preventing them from snowballing into major outages that might disrupt your customers' experience . This approach ensures that your systems remain reliable and your team can focus on making data-driven decisions.
For SMBs aiming to scale their monitoring practices, resources like Scaling with Datadog for SMBs offer specific guidance to get the most out of Datadog as your business grows. Investing in accurate metric reporting not only improves system reliability and speeds up issue resolution but also delivers valuable insights that drive sustainable growth.
FAQs
How do I make sure my Datadog agent is set up correctly to avoid metric reporting issues?
To make sure your Datadog agent is set up properly and to prevent metric reporting issues, start by confirming that the datadog.yaml file contains the correct API key and site settings specific to your organization. Additionally, ensure the agent has internet access or is configured to use a proxy if needed. Don’t forget to restart the agent after making any changes to apply the updates.
If issues persist, take a look at the agent logs for any errors or switch on debug mode to gather more detailed insights. This can help pinpoint and address any lingering problems. By following these steps, you’ll keep your Datadog setup running efficiently while maintaining accurate metric reporting.
How can I manage data sampling and ingestion limits in Datadog to prevent data loss?
To ensure no data points are lost in Datadog, it's crucial to handle data sampling and ingestion limits properly. Start by setting up ingestion controls to define rate limits for traces and logs. This helps keep your system within manageable thresholds. For instance, you might configure limits such as 100 traces per second for each service instance or adjust log quotas to align with your system's requirements.
Leveraging adaptive sampling rules can help you focus on retaining the most critical data. This approach allows you to prioritize specific data types or services, ensuring essential metrics are captured without breaching ingestion limits. Additionally, adjusting sampling rates anywhere between 0% and 100% gives you the flexibility to strike the right balance between data visibility and system performance. By managing these configurations effectively, you can maintain accurate metric reporting while optimizing your system's resources.
How do I set up alerts in Datadog to quickly identify and resolve metric issues?
To set up alerts in Datadog, the first step is installing the Datadog Agent on your systems. Whether you're working with on-premises servers, containers, or cloud-based environments, the Agent needs to be configured to gather critical metrics, logs, and events specific to your setup.
Once the Agent is up and running, focus on creating monitors for your most important metrics. Define thresholds that represent normal performance levels, and take advantage of tools like anomaly detection or forecasting to identify potential problems early. For seamless incident management, configure alert notifications to work with platforms like Slack or PagerDuty, ensuring your team can respond quickly.
It's also important to regularly review and fine-tune your alert settings. This helps reduce false alarms and ensures that notifications are meaningful and actionable. By staying proactive, you can tackle issues before they escalate and affect your systems or users.