Full-Stack Observability on Heroku with the Datadog Add-On
Gain complete visibility into your Heroku app's health with Datadog's observability features, ensuring smooth performance and effective monitoring.

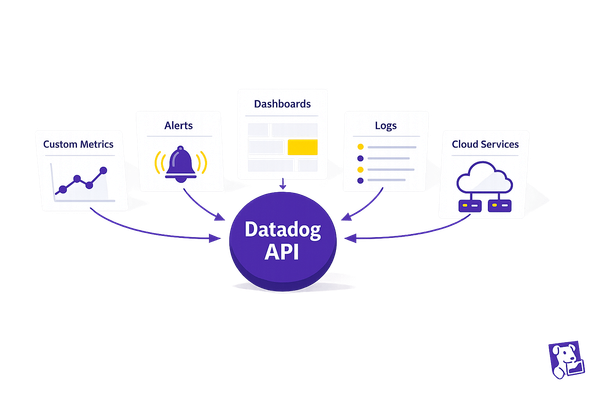
Want to keep your Heroku app running smoothly? Datadog’s add-on for Heroku gives you full visibility into your app’s health - backend, frontend, and everything in between.
Here’s what you’ll get:
- Complete Monitoring: Track infrastructure, app performance, logs, and user experience in one place.
- Easy Setup: Add the Datadog buildpack to your Heroku app or configure it for Docker-based setups.
- Key Metrics & Alerts: Monitor CPU, memory, response times, and more. Set alerts for issues before they impact users.
- Cost Control: Use features like log sampling and metric filtering to manage monitoring expenses.
Quick Setup Steps:
- Install the Datadog buildpack via Heroku CLI.
- Configure critical environment variables like
DD_API_KEY. - Enable runtime metrics and system-level monitoring.
- Build dashboards and set alerts for real-time insights.
Datadog simplifies monitoring, so you can focus on scaling your Heroku app without worrying about performance issues.
Setup Datadog APM in One Minute
Installing Datadog on Heroku
Here's how to set up Datadog monitoring for your Heroku app.
Add-On Installation Steps
Before starting, make sure you have an existing Heroku application.
- Use the Heroku CLI to add the Datadog buildpack.
- Configure ports 8125 (for metrics) and 8126 (for traces).
- Confirm the installation by checking the directory at
/app/.apt/opt/datadog-agent.
If you're working with Docker-based applications, you'll need to adjust your Dockerfile. Below is an example for Debian-based Docker images:
# Add Datadog repository
RUN apt-get update && apt-get install -y gpg apt-transport-https
RUN sh -c "echo 'deb [signed-by=/usr/share/keyrings/datadog-archive-keyring.gpg] https://apt.datadoghq.com/ stable 7' > /etc/apt/sources.list.d/datadog.list"

# Install Datadog Agent
RUN DD_AGENT_MAJOR_VERSION=7 DD_API_KEY=$DD_API_KEY DD_SITE=$DD_SITE bash -c "$(curl -L https://s3.amazonaws.com/dd-agent/scripts/install_script.sh)"
After setting up the buildpack or Docker configuration, you’ll need to define environment variables to enable Datadog’s features.
Setting Up Environment Variables
Here’s a table of the key environment variables you need to configure:
| Variable | Purpose | Example Value |
|---|---|---|
| DD_API_KEY | Authenticates with Datadog | Your API key |
| DD_SITE | Specifies the Datadog region | datadoghq.com |
| DD_DYNO_HOST | Uses the dyno name as hostname | true |
| DD_TAGS | Adds custom tags to your data | env:production,team:backend |
Set these variables using the Heroku CLI. For example:
heroku config:set DD_API_KEY=your_api_key
heroku config:set DD_SITE=datadoghq.com
heroku config:set DD_DYNO_HOST=true
heroku config:set HEROKU_APP_NAME=your_app_name
Testing Your Setup
After installation, you can verify if everything is working correctly by using the Datadog Agent's built-in status checks.
-
Access your dyno:
heroku ps:exec -a your_app_name -
Run the following command to check the Agent's status:
agent-wrapper status
The status output should confirm:
- A valid API key is in use.
- Collectors for any enabled integrations are active.
- The APM Agent is running (if you’ve configured it).
If you notice missing data, review the Agent’s status output carefully. Double-check the following:
- Configuration files located at
/app/.apt/etc/datadog-agent - Log files stored at
/app/.apt/var/log/datadog
Essential Heroku Metrics to Track
Keep an eye on key Heroku metrics using Datadog to ensure your app runs smoothly and efficiently.
Dyno Performance Metrics
Tracking dyno performance is crucial for understanding how your app responds under different conditions. Focus on these metrics:
| Metric Type | Key Indicators |
|---|---|
| Response Time | Median (P50), 95th Percentile (P95), 99th Percentile |
| Memory Usage | Resident Set Size (RSS), Swap, Total memory usage |
| CPU Usage | Average and maximum usage (for Cedar-generation apps) |
| Throughput | Request volume by HTTP status codes |
If your app consistently experiences high load, it might be time to consider scaling. But don't stop here - system-wide metrics can give you a more comprehensive view.
Heroku System Metrics
To get a full picture of your app's health, collect system-level metrics. Here's how to set it up:
-
Enable Runtime Metrics
Use the following command to enable runtime metrics for your app:
heroku labs:enable log-runtime-metrics -a your_app_name -
Configure Metric Collection
Configure Datadog to gather system metrics by setting this parameter:
heroku config:set DD_DISABLE_HOST_METRICS=false -
Monitor Platform Indicators
Pay attention to critical platform-level indicators like:
- Database connection count
- Queue depth and processing time
- Add-on resource usage
- Router response times
These metrics provide insights into your app's backend performance and help you address bottlenecks before they escalate.
Log Analysis
Performance metrics tell part of the story, but logs can fill in the gaps. Here's how to set up detailed log analysis:
-
Set the Correct Source Parameter
Specify your application's type and service name in your configuration:
source: ruby # For Rails applications service: your-app-name -
Create Custom Facets
Define custom facets for attributes that matter most to your app, such as:
- Controller actions
- Response times
- Error types
- User IDs
Datadog's built-in processing pipelines simplify log analysis by automatically parsing common patterns and extracting useful information. Keep an eye on these log patterns:
- HTTP status codes, especially 5XX errors
- Memory warnings like R14 errors
- Database timeout errors
- Router issues, including H10–H99 errors
Setting Up Monitoring in Datadog
Learn how to configure monitoring with custom dashboards and alert rules to keep an eye on your system's performance.
Creating Heroku Dashboards
Using the Heroku metrics you've collected, you can build custom dashboards to get real-time insights into your system's health.
- System Performance Widgets
Start by setting the following environment variables to enable monitoring for Heroku Redis and Postgres:
DD_ENABLE_HEROKU_REDIS: true
DD_ENABLE_HEROKU_POSTGRES: true
- Application Metrics Panel
Add these widgets to your dashboard for a detailed view:
| Widget Type | Metrics to Display | Update Interval |
|---|---|---|
| Time Series | CPU Usage, Memory Usage | 15 seconds |
| Top List | Highest Response Times | 30 seconds |
| Query Value | Active Database Connections | 1 minute |
| Heat Map | Request Distribution | 1 minute |
- Resource Monitoring Section
To monitor your database resources, enable Database Monitoring for Postgres by setting the following variable:
DD_ENABLE_DBM=true
Once your dashboards are in place, the next step is to define alert rules that help you address potential issues before they escalate.
Setting Alert Rules
With your dashboards ready, configure alert rules to detect and respond to performance issues early.
| Alert Category | Example Threshold | Notification Priority |
|---|---|---|
| CPU Usage | >80% for 10 minutes | High |
| Error Rate | >1% over 15 minutes | High |
| Response Time | Based on your baseline | Medium |
- Performance Degradation Alerts
Set up a metric monitor to track CPU usage:
monitor_type: metric
query: avg(last_10m):avg:heroku.dyno.cpu_usage{*} > 80
- Composite Monitors for System Health
Combine multiple metrics, such as high CPU usage and increased error rates, into a composite monitor for a more comprehensive view of system health.
- Log-Based Alerts
To capture critical errors, configure log levels and queries:
DD_LOG_LEVEL: WARN
query: "status:error service:your-app-name"
"Alerting is at the heart of proactive system monitoring, especially when managing dynamic environments that involve complex infrastructure." - Siddarth Jain
"Send a page only when symptoms of urgent problems in your system's work are detected, or if a critical and finite resource limit is about to be reached." - Alexis Lê-Quôc
Managing Costs and Performance
Controlling Monitoring Costs
Effective observability not only helps identify issues but also keeps your monitoring expenses under control. To make the most of your Heroku monitoring, it's essential to understand and optimize Datadog's pricing structure.
Here’s how you can manage costs without compromising on monitoring quality:
| Monitoring Component | Optimization Strategy | Cost Impact |
|---|---|---|
| Log Management | Pre-sample logs at 50% | Saves $0.05/GB |
| Infrastructure | Consolidate workloads | Saves $15–$23 per host/month |
For log management, you can use targeted exclusion filters to reduce unnecessary data processing. Here’s an example:
DD_LOGS_ENABLED: true
DD_LOGS_CONFIG_PROCESSING_RULES:
  - type: exclude_at_match
    name: exclude_dev_logs
    pattern: development
To further streamline costs:
- Set log retention periods: Retain logs only as long as they’re necessary for compliance or analysis.
- Enable metric filtering: Focus on critical business metrics and avoid collecting redundant data.
- Automate cleanup: Regularly remove unused custom metrics to save resources.
By focusing on cost-efficiency, you can ensure your monitoring remains scalable and effective as your needs grow.
Monitoring for Growth
As your Heroku infrastructure evolves, your monitoring strategy should adapt to maintain visibility without a proportional rise in costs. A thoughtful approach to scaling ensures you stay efficient while supporting growth.
Here’s a quick breakdown of pricing considerations for key services:
| Service Type | Base Price | Growth Strategy |
|---|---|---|
| APM | $31/host/month | Use sampling for high-traffic services |
| RUM | $1.50/1,000 sessions | Apply session-based filtering |
| Synthetic Tests | $5/10,000 API tests | Schedule tests during peak hours only |
Dynamic sampling can be instrumental in managing costs for growing applications. For example:
DD_APM_SAMPLE_RATE: 0.5
DD_MAX_CUSTOM_METRICS: 100
DD_TRACE_SAMPLE_RATE: "rate=0.1;service=high-volume-api"
Additional growth-focused strategies include:
- Consumption-based pricing: Adjust monitoring intensity based on workload fluctuations.
- Automated shutdowns: Disable non-production monitoring during off-hours to save resources.
- Metric collection limits: Restrict data collection for non-critical namespaces.
To optimize resources, consider reducing the frequency of synthetic tests during low-traffic periods while ensuring critical systems remain monitored.
"Alerting is at the heart of proactive system monitoring, especially when managing dynamic environments that involve complex infrastructure." - Siddarth Jain
"Send a page only when symptoms of urgent problems in your system's work are detected, or if a critical and finite resource limit is about to be reached." - Alexis Lê-Quôc
Summary
This section brings together the key aspects of setting up, tracking metrics, and managing costs for full-stack observability on Heroku using the Datadog add-on. Achieving effective monitoring requires careful configuration and consistent upkeep to ensure everything runs smoothly without overspending.
Here’s a quick recap of the essential configuration settings that support robust monitoring:
| Component | Critical Setting | Impact on Observability |
|---|---|---|
| System Integration | Service Discovery | Unified metric collection |
| Performance Analysis | Trace Sampling | Balanced depth of insights |
| Resource Optimization | Targeted Filtering | Streamlined data management |
By fine-tuning these configurations, you not only gain valuable insights but also keep costs under control. One standout practice is using unified service tagging through a prerun script. This step ensures seamless correlation between host metrics and APM data - especially useful for organizations juggling multiple dynos.
Key Configurations to Remember:
- Buildpack Order: Place the Datadog buildpack before any language-specific buildpacks.
- Environment Variables: Set critical variables like API keys and dyno host settings.
- Resource Management: Keep an eye on agent memory usage and make adjustments as needed.
"Datadog has become the industry standard for observability. Engineers rely on it to monitor their infrastructure, troubleshoot issues, and build better systems - but while they're focused on shipping the next feature or solving a production issue, Datadog costs are quietly stacking in the background."
– Shouri Thallam, nOps
These insights tie back to earlier steps, highlighting the balance between effective monitoring and managing system performance alongside costs.
FAQs
How can I optimize my Heroku app for efficient and cost-effective monitoring with Datadog?
To make monitoring your Heroku app with Datadog both efficient and budget-friendly, there are a few practical strategies to keep in mind:
- Filter unnecessary logs: Cut down on log ingestion by sending only the logs that truly matter to Datadog. This reduces clutter and saves on costs.
- Streamline custom metrics: Combine data points where possible and avoid creating metrics with excessive granularity or high-cardinality values.
- Leverage consumption-based pricing: Datadog’s pricing model works well for apps with temporary or fluctuating workloads, so align your usage to take full advantage.
You might also want to explore committed use discounts and group metrics thoughtfully to strike the right balance between cost management and maintaining clear insights into your app’s performance. These adjustments can help you keep monitoring effective without straining your budget.
What important metrics and alerts should I focus on when using Datadog for full-stack observability on Heroku?
When using Datadog to implement full-stack observability on Heroku, it's crucial to zero in on metrics that directly affect your app's performance and reliability. Start by tracking response times, error rates, and throughput - these give you a clear picture of your application's health. On top of that, monitor Heroku-specific metrics like dyno load, memory usage, and queue wait times to address platform-specific concerns.
Set up alerts for critical events like service crashes, high error rates, or unexpected traffic surges. Make sure these alerts are precise and actionable to prevent overwhelming your team with unnecessary notifications. Including context in the alerts can also help your team react faster. For logs, keep an eye on patterns such as spikes in errors or signs of security risks to catch problems before they escalate. By honing in on these metrics and setting up well-thought-out alerts, you can keep your Heroku-hosted applications running smoothly and minimize disruptions.
What should I do if my Datadog setup on Heroku isn't capturing all the metrics I need or shows missing data?
If your Datadog setup on Heroku isn't tracking all the metrics you need, the first step is to confirm that the Datadog Agent is running as expected within your app. Look for any errors in the Agent's status, and double-check that your Datadog API key, application name, and site are correctly set as environment variables.
Next, make sure the Datadog buildpack is properly added to your Heroku app. It should be listed after any buildpacks that install apt packages or make changes to the /app directory. If you're using services like Postgres or Redis, review their configurations and credentials to ensure everything is set up correctly. Anytime you adjust buildpacks or environment variables, remember to recompile your slug so the updates take effect.
Still running into problems? Compare your setup with the official Datadog documentation. This can help you spot any configuration issues and ensure your app is fully monitored for better performance.

