
Getting Started with Datadog on Engine Yard: Manual Setup Guide
Learn how to manually set up Datadog on Engine Yard for efficient app deployment and monitoring, enhancing system performance and reliability.
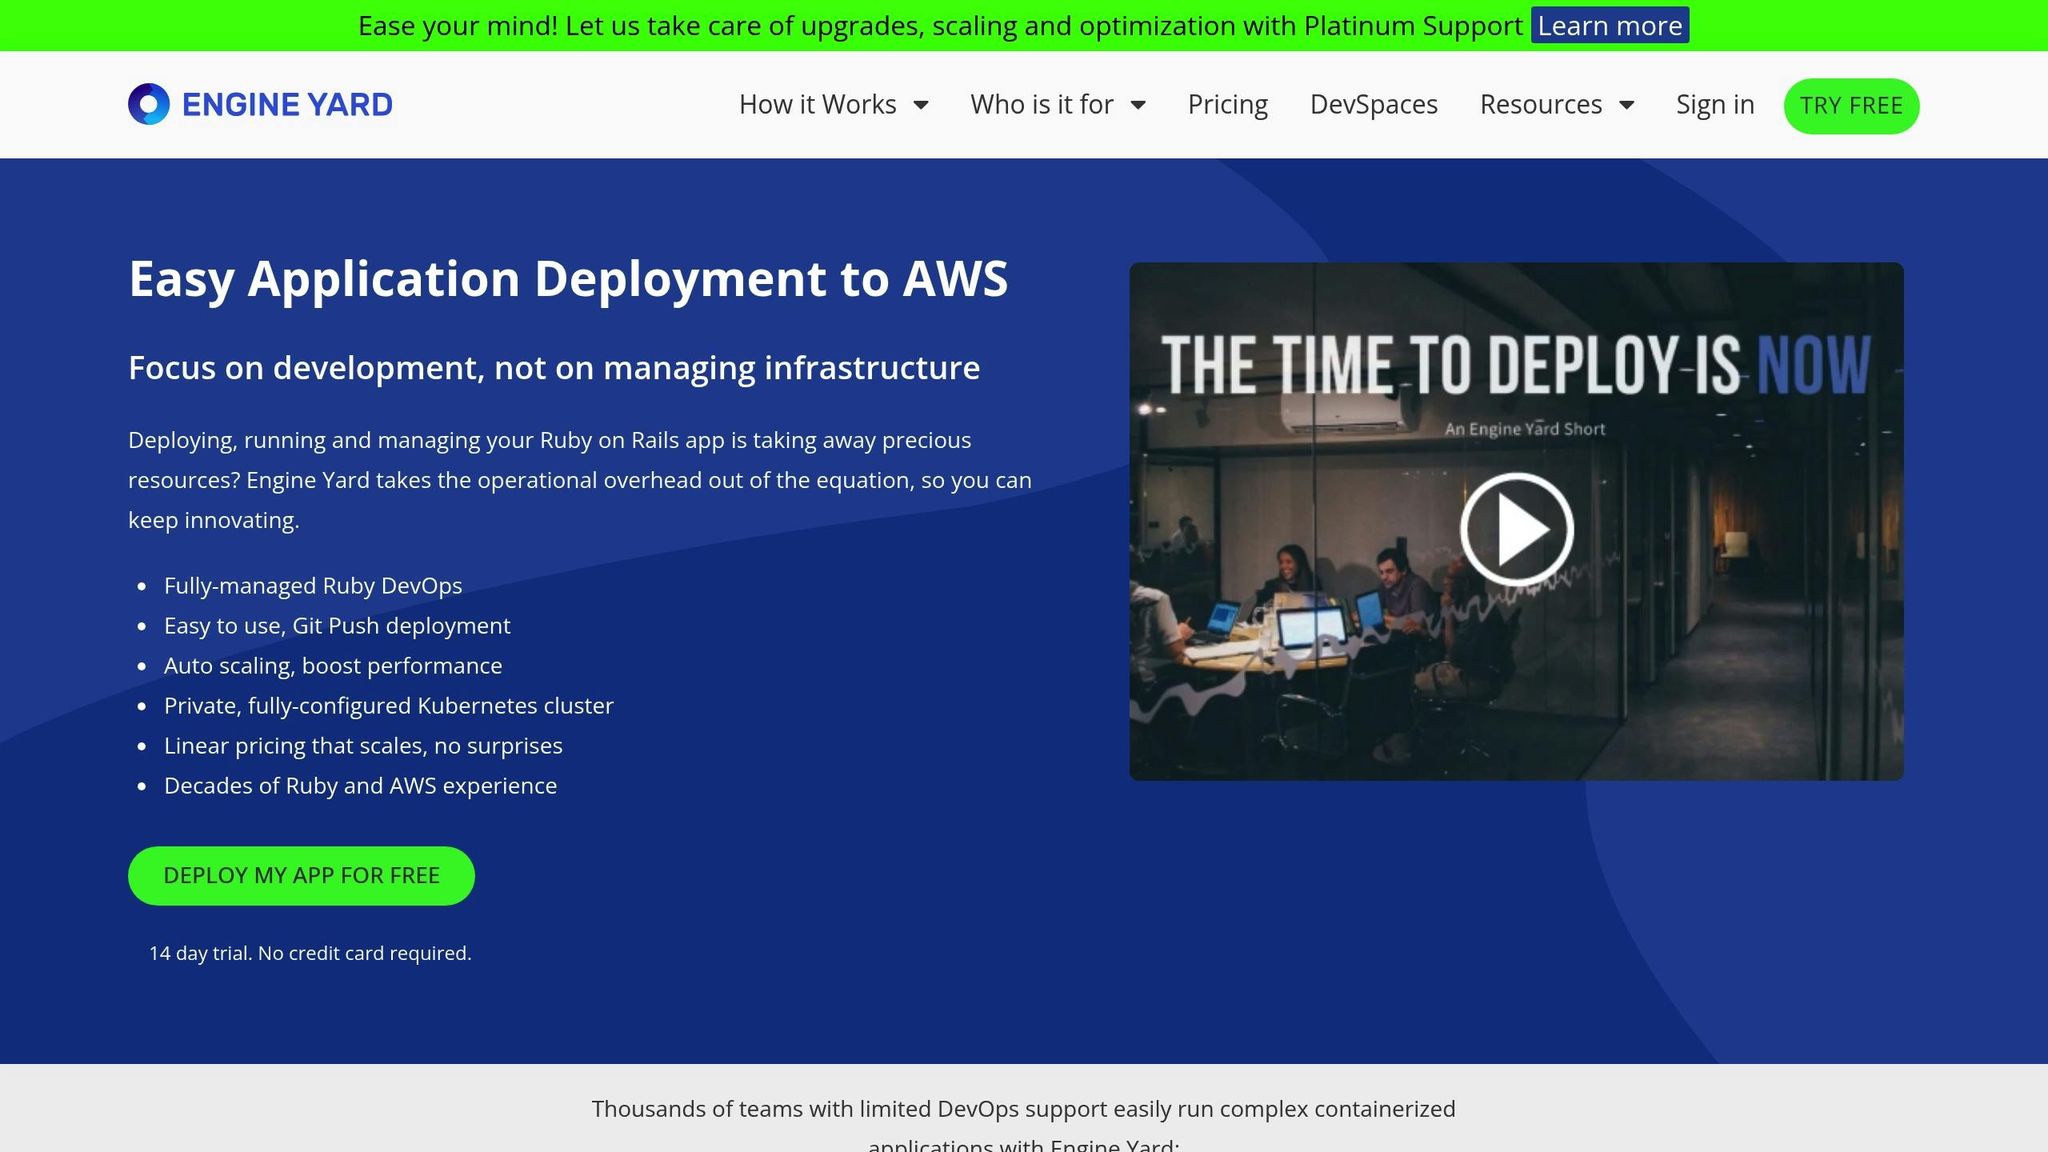
Datadog and Engine Yard together simplify app deployment and monitoring on AWS. Engine Yard handles Kubernetes clusters, containers, and deployments, while Datadog provides advanced monitoring for infrastructure, logs, and security. This guide shows you how to manually set up Datadog on Engine Yard, ensuring efficient system performance and streamlined operations.
Key Steps Covered:
- System Requirements: Minimum 1GB RAM, 1 CPU core, and 350MB storage. Supported OS: Ubuntu 18.04+ or Amazon Linux 2.
- Network and Security: Ensure outbound access on port 443 to Datadog endpoints and set up AWS IAM roles for monitoring.
- Datadog Agent Installation: Install via SSH, configure the
datadog.yamlfile, and verify setup. - Monitoring Setup: Create dashboards for CPU, memory, and error rates, and configure alerts for proactive issue detection.
- Optimization Tips: Use Datadog’s tools for resource management, cost tracking, and performance tuning.
This guide ensures a smooth integration, helping you monitor and optimize your Engine Yard environment effectively.
Setup Requirements for Engine Yard
System Requirements Check
Before diving in, make sure your system meets these baseline requirements:
- Memory: At least 1GB of RAM (2GB is better if you’re running a production environment).
- CPU: A minimum of 1 core, though 2 cores are recommended for production.
- Storage: You’ll need 350MB of free disk space to install the agent.
- Operating System: Either Ubuntu 18.04 LTS or newer, or Amazon Linux 2.
Also, ensure there’s enough capacity to handle both the Datadog agent and your applications without running into resource issues.
Access and Security Setup
Once your system is ready, it’s time to configure access and security settings to ensure smooth operation.
Network Configuration
Your Engine Yard instances must have outbound access on port 443 to these Datadog endpoints:
api.datadoghq.com(for the US region)agent-intake.logs.datadoghq.comprocess.datadoghq.com
AWS IAM Permissions
Set up an IAM role with read-only access for monitoring. This role should include permissions for:
- CloudWatch metrics
- EC2 instance monitoring
- RDS monitoring
- ElastiCache monitoring
Required Software List
To ensure everything runs smoothly, your Engine Yard environment needs the following software:
| Component | Purpose | Version Requirements |
|---|---|---|
| Python | Agent support | Version 2.7 or 3.6+ |
| sysstat | System metrics | Latest stable |
| procps | Process monitoring | Latest stable |
| ntp/chrony | Time synchronization | Latest stable |
Database Monitoring Setup
For database monitoring, set up dedicated read-only users. If you’re working with MySQL, you can use the following SQL command:
GRANT SELECT, PROCESS, REPLICATION CLIENT ON *.* TO 'datadog'@'localhost';
To keep database performance steady while collecting metrics, limit monitoring connections to 3–5. This strikes a good balance between data collection and system efficiency.
Datadog Agent Installation Steps
SSH Installation Guide
To get started, access your instance via SSH. Once connected, download and run the installation script using your API key. After that, simply start the agent.
For deploying the Datadog agent across multiple instances, you can use the Datadog Chef cookbook. This tool simplifies the process, ensuring all instances are set up consistently with minimal effort.
Agent Configuration Settings
Once the agent is installed, you’ll need to adjust the configuration. Open the datadog.yaml file and update it with the following settings:
# Basic agent configuration
hostname: "your-engine-yard-instance"
tags:
  - environment:production
  - service:web
  - region:us-east

# Performance settings
process_config:
  enabled: true
logs_enabled: true
apm_config:
  enabled: true
For more refined control, use the node['datadog']['extra_config'] attribute. This method allows you to add custom settings without altering the core configuration file, giving you flexibility to fine-tune the agent’s behavior.
Integration Settings
Here’s a quick overview of integration options:
| Integration Type | Configuration Method | Use Case |
|---|---|---|
| Basic Monitoring | Recipe inclusion | System metrics and logs |
| Custom Checks | datadog_monitor resource |
Service-specific monitoring |
| Specific Versions | datadog_integration resource |
Version-controlled deployments |
After configuring the agent, it's time to verify everything is working as expected.
Installation Check
-
Verify Agent Status
Run the following command to ensure the agent is active and reporting:
Check the Datadog dashboard to confirm that metrics like CPU, memory, disk usage, and any custom or integration metrics are being tracked.sudo datadog-agent status -
Test Log Collection
Logs should start appearing in your Datadog dashboard within 5 minutes of installation. This confirms that log collection is functioning correctly.
If you run into any issues during installation, you can troubleshoot using the agent's debug mode:
sudo datadog-agent diagnose
This command helps identify and resolve common problems, ensuring a smooth setup process.
Monitoring and Alert Configuration
Dashboard Setup for Engine Yard
After verifying the Datadog agent, the next step is configuring dashboards and alerts to keep tabs on Engine Yard's performance. Start by setting up a dashboard to track key metrics that reflect the health and efficiency of your system.
Here are the essential metrics to include:
# Key Engine Yard Metrics
- CPU Utilization
- Memory Usage
- Disk Space
- Network Traffic
- Application Response Times
- Error Rates
For each metric, add widgets to your dashboard. Use time-series graphs to visualize both real-time performance and historical trends. This setup provides a clear overview of your system's behavior over time.
Alert Setup Guide
When creating alerts, focus on work metrics - the ones that measure how effectively your system is performing its tasks - rather than just resource usage.
"You only want to get alerted on work metrics. In other words, you want to get alerted on things that measure how useful your system is." - Alexis Lê-Quôc, co-founder and CTO of Datadog
Set specific thresholds for critical metrics to ensure timely alerts:
| Metric Type | Warning Threshold | Critical Threshold | Monitor Type |
|---|---|---|---|
| CPU Usage | 75% | 90% | Metric Monitor |
| Memory | 80% | 95% | Metric Monitor |
| Disk Space | 75% | 90% | Metric Monitor |
| Error Rate | 2% | 5% | Event Monitor |
Once you've defined these thresholds, configure notifications to ensure your team can respond promptly to any issues.
Alert Notification Setup
Set up notification channels through the Datadog interface to make sure alerts reach the right people at the right time:
- Email Notifications: Create escalation tiers based on the severity of the alert. Assign different email groups for various alert types to streamline responses.
- Integration Alerts: Connect Datadog with your team's communication tools for seamless notifications:
| Channel | Best Use Case | Setup Priority |
|---|---|---|
| Slack | Real-time team alerts | High |
| PagerDuty | Critical incidents | High |
| Daily summaries | Medium | |
| SMS | Urgent notifications | High |
- No Data Alerts: Activate these alerts for critical metrics to detect connectivity issues or agent failures quickly.
"Alerting is at the heart of proactive system monitoring, especially when managing dynamic environments that involve complex infrastructure." - Siddarth Jain
To make alerts actionable, use templates that include:
- The conditions that triggered the alert
- Details about the affected system components
- Suggested initial steps for troubleshooting
- Links to related runbooks
- Escalation contact information
This approach ensures your team is always prepared to address issues efficiently.
How to Install Datadog Agent and Monitor Datadog Agent Manager
Setup Tips and Guidelines
Once you've completed installation and configuration, these tips can help fine-tune performance monitoring for ongoing success.
Resource Management Tips
Managing resources effectively not only reduces costs but also enhances system performance. Datadog's Cloud Cost Management tool is a great way to dig into resource consumption and pinpoint inefficiencies. Here are some areas to focus on:
| Resource Type | Monitoring Focus | Optimization Strategy |
|---|---|---|
| Compute | CPU Profile Analysis | Use the Continuous Profiler to spot resource-heavy functions. |
| Storage | Data Transfer Patterns | Apply rack awareness configurations to improve efficiency. |
| Network | Cross-Zone Traffic | Monitor and optimize how data moves between availability zones. |
Datadog's team has successfully used these strategies to identify and eliminate expensive inefficiencies. By following these approaches, you’ll set a solid foundation for scalable and efficient performance monitoring.
Planning for Growth
As your system grows, your monitoring setup needs to evolve with it. Planning for scalability ensures your infrastructure can handle both current demands and future expansions.
Here’s what to keep in mind:
-
Resource Optimization
- Use profile-guided optimization techniques.
- Monitor resource usage patterns to identify inefficiencies.
- Adjust resource allocation based on actual usage data.
-
Network Configuration
- Keep an eye on data transfer patterns.
- Use Datadog’s Network Performance Monitoring to fine-tune configurations.
- Optimize data routing to minimize unnecessary cross-zone traffic.
-
Cost Management
- Set up a Cloud Cost Management dashboard to track expenses.
- Monitor spending across your infrastructure components.
- Use data insights to make smarter allocation decisions.
By addressing these areas early, you can avoid resource bottlenecks and unexpected costs down the road.
Common Problems and Fixes
Even with the best setup, occasional issues can arise. Here are some common problems you might encounter when using Datadog on Engine Yard, along with practical fixes:
Agent Status Issues
- Check the logs at
/var/log/datadogfor error messages. - Ensure the agent can connect to the backend.
- Verify that the agent service is running correctly.
Configuration Problems
- Double-check the syntax in your
/etc/datadog-agent/datadog.yamlfile. - Confirm that your API key is valid and correctly entered.
- Review firewall settings to ensure ports 443 and 8125 are open.
Set resource thresholds to catch performance problems before they escalate.
Diagnostic Tools
- Use configuration validation tools to spot errors.
- Run system health checks regularly.
- Monitor the status of your setup for early warning signs.
By tackling these issues proactively, you can ensure smooth and reliable operations for Datadog on Engine Yard.
Conclusion: Next Steps with Datadog and Engine Yard
Now that your setup is ready, it’s time to take your monitoring capabilities to the next level. Focus on building observability pipelines that can scale with your data demands. Integrate these pipelines with your dashboards to create a seamless and efficient monitoring ecosystem.
Key steps include configuring log filters, extracting metrics, and applying data redaction techniques. These actions not only provide deeper insights but also help manage costs effectively. Additionally, develop a data retention strategy that strikes the right balance between keeping the information you need and optimizing resource usage.
Here’s a quick overview of areas to prioritize for long-term success:
| Focus Area | Action Items | Expected Outcome |
|---|---|---|
| Data Management | Set up log filtering and aggregation for better performance | Lower storage costs and faster query results |
| Compliance | Archive and redact data to align with regulations | Maintain visibility while meeting regulatory standards |
| Performance | Implement dual shipping for critical logs | Boost reliability and ensure redundancy |
FAQs
What are the advantages of using Datadog with Engine Yard for app deployment and monitoring?
Integrating Datadog with Engine Yard brings a range of advantages for efficiently managing and monitoring your cloud infrastructure. With Datadog, you get real-time insights into your system’s performance, enabling you to pinpoint and address issues without delay.
Pairing Engine Yard’s dependable app deployment features with Datadog’s advanced monitoring capabilities allows you to:
- Monitor system health: Keep an eye on metrics like CPU usage, memory, and database performance across your infrastructure.
- Simplify troubleshooting: Use Datadog’s intuitive dashboards and alerts to quickly locate and resolve bottlenecks or errors.
- Optimize scalability: Leverage Datadog’s insights to fine-tune resource allocation and scale your applications seamlessly.
This integration helps ensure smoother workflows, smarter resource usage, and greater application reliability - an excellent choice for small and medium-sized businesses.
How can I optimize my Datadog setup on Engine Yard for better performance and cost savings?
To get the most out of your Datadog setup on Engine Yard, consider these strategies:
- Focus on key data: Keep an eye on the most critical hosts and metrics to avoid collecting excessive, unnecessary data. This helps streamline your monitoring process.
- Be selective with custom metrics: Stick to tracking only the metrics that are truly important to your system’s performance. This prevents system overload and keeps costs in check.
- Organize with tags and filters: Remove irrelevant tags and apply filters to keep your data clean and manageable.
- Control log management: Use filters and exclusion rules to limit the logs you ingest and store, keeping your system efficient and your storage costs under control.
Make it a habit to review your configurations regularly. This ensures your setup stays aligned with your performance needs and budget, helping you strike a balance between efficiency and cost-effectiveness while leveraging Datadog’s capabilities.
What should I do if the Datadog agent isn’t reporting metrics correctly on Engine Yard?
If the Datadog Agent isn’t sending metrics as expected on Engine Yard, here are a few steps you can take to troubleshoot:
- Check the Agent Configuration: Open the
datadog.yamlfile and confirm that the API key and other settings are correctly entered. Any misconfiguration here can prevent the agent from working properly. - Inspect the Agent’s Status: Use the
datadog-agent statuscommand to see if the agent is running and collecting data. This can help identify if it’s active or encountering issues. - Review the Logs: Check the agent logs, usually located in
/var/log/datadog/, for any errors or warnings. These logs often provide clues about what might be going wrong. - Test Network Connectivity: Ensure the server can connect to Datadog’s endpoints. Look out for any firewalls or network restrictions that could block communication with Datadog.
If none of these steps resolve the issue, restarting or reinstalling the Datadog Agent can often fix configuration-related problems. Be sure to follow the recommended setup guidelines to minimize potential issues down the line.


