How to Configure Log Collection in Datadog
Streamline your log collection process in Datadog with our comprehensive guide on setup, verification, and optimization.

Want to streamline log collection in Datadog? Here's how you can set it up quickly:
- Install the Datadog Agent: Ensure you have an active Datadog account with log management enabled.
- Enable Logs in
datadog.yaml: Setlogs_enabled: trueand restart the Agent. - Configure Log Sources: Use file paths, TCP/UDP, or container annotations to specify where logs are collected.
- Verify: Check log ingestion via the Datadog Agent status or the Logs Explorer in the dashboard.
- Optimize Settings: Use tags, filters, and retention policies to manage log volume and costs.
L02 - How to Collect Logs in Datadog: File, Docker, K8s & More
Prerequisites and Initial Setup
Before diving in, make sure your environment is ready and you have the necessary access to Datadog to prevent any setup hiccups.
System Requirements
First, you'll need to install the Datadog Agent. For this, your organization must have an active Datadog account with log management enabled. If you're already using Datadog for monitoring but haven't activated log management yet, you can enable it through your account settings.
You’ll also need administrator-level access (like SSH) to modify configuration files and install the required components. Additionally, having a basic understanding of your system's logging setup is helpful. This knowledge will make it easier to identify the log files you want to monitor. Most applications and services store logs in standard locations, so knowing where to look can save you time.
Accessing the Datadog Platform
Log in to your Datadog account and head to the main dashboard. From there, find the Logs section in the left sidebar. If you don’t see it, you’ll need to ask your administrator to activate log management.
Make sure your account permissions allow you to configure log sources. Key permissions to check include logs_read_data, logs_write_exclusion_filters, and logs_write_pipelines. If your organization enforces strict access controls, you might want to explore Datadog's Multi-Org setup. This allows separate accounts for different teams or environments, offering more flexibility.
Familiarize yourself with the Datadog Logs interface. It includes the real-time Log Explorer for viewing logs as they come in and a Configuration section for managing sources, processing rules, and retention settings.
Lastly, verify that your API key is correctly configured. This key is essential for authenticating log submissions from the Agent to your Datadog account. You can find it in the Organization Settings under the API Keys section. Make sure the key has the necessary scopes for log ingestion.
Once your system is ready and access is confirmed, you can move on to enabling and configuring log collection.
Enable and Configure Log Collection
To start collecting logs, you’ll need to tweak configuration files and specify which logs to monitor. Here’s how you can get started.
Turn On Log Collection in datadog.yaml
First, locate the datadog.yaml file. On Linux, you’ll find it at /etc/datadog-agent/datadog.yaml, while on Windows, it’s located at C:\ProgramData\Datadog\datadog.yaml.
Inside the file, look for the logs_enabled setting. By default, it’s set to false. Change it to true and restart the Datadog Agent to activate log collection:
logs_enabled: true
To restart the Agent:
-
Linux: Use
sudo systemctl restart datadog-agentorsudo service datadog-agent restart. -
Windows: Either restart the service via the Services management console or run these commands in an elevated command prompt:
net stop datadogagent
net start datadogagent
Once log collection is enabled, you can move on to setting up specific log sources.
Set Up Log Sources
The Datadog Agent supports collecting logs from files, network connections (TCP/UDP), journald, and Windows event channels. Here’s how to configure each type:
-
File-based logs: Create a folder in the
conf.d/directory named after your log source (e.g.,myapp.d/). Inside, add aconf.yamlfile with this configuration:logs: - type: file path: /var/log/myapp/*.log service: myapp source: python sourcecategory: sourcecode -
Network logs: For logs collected via TCP or UDP, your configuration might look like this:
logs: - type: tcp port: 10514 service: network-service source: syslog -
Container logs: In Docker or Kubernetes environments, logs are automatically detected when containers are labeled or annotated correctly. For Docker, you can add labels like this:
For Kubernetes, annotations can be added to pod specifications:docker run -l com.datadoghq.ad.logs='[{"source": "apache", "service": "webapp"}]' httpdapiVersion: v1 kind: Pod metadata: annotations: ad.datadoghq.com/apache.logs: '[{"source": "apache", "service": "webapp"}]'
After setting up your configurations, restart the Agent and verify that the sources are active by running:
sudo datadog-agent status
Look for your log sources under the Checks section.
Additional Log Configuration Options
To fine-tune log collection, consider these options:
-
Log message size limits: Prevent oversized logs from hogging bandwidth by setting a maximum message size in
datadog.yaml:logs_config: max_message_size_bytes: 256000 -
Open file limits: Control how many log files the Agent monitors at once to avoid resource exhaustion:
logs_config: open_files_limit: 100 -
Processing rules: Modify logs before they’re sent to Datadog. For example, you can exclude logs with certain patterns or add tags. Here’s an example of excluding debug logs:
logs: - type: file path: /var/log/myapp/*.log service: myapp source: python log_processing_rules: - type: exclude_at_match name: exclude_debug pattern: DEBUG -
Custom tags: Add tags to organize logs for easier filtering. Tags can be set globally in
datadog.yamlor for individual sources:logs: - type: file path: /var/log/myapp/*.log service: myapp source: python tags: - env:production - team:backend
These configurations let you optimize log collection to fit your needs. Don’t forget to restart the Agent after making changes to ensure they take effect.
Verify and Monitor Log Ingestion
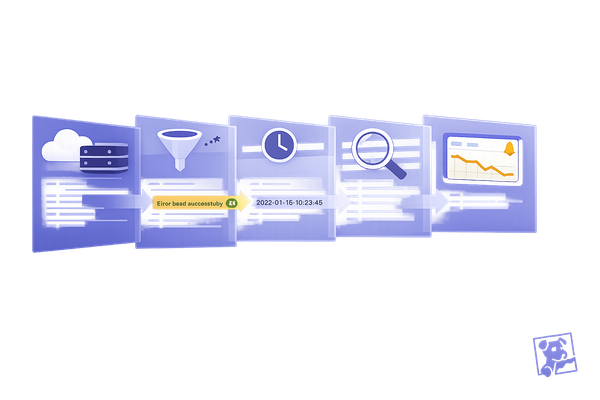
Once your log sources are set up, it's crucial to confirm that logs are being ingested into Datadog correctly. This step ensures your monitoring system is functioning as intended and helps identify any issues early on.
Check Log Ingestion Status
To verify that logs are being collected, start by running the Datadog Agent status command:
sudo datadog-agent status
In the output, locate the Logs Agent section. Here, you'll find details about each configured log source, including whether logs are actively being collected. Healthy log sources will show recent timestamps and file paths, confirming proper connectivity and configuration.
You can also check the Logs section in the Datadog dashboard for real-time log entries. This interface provides a live view of logs as they arrive, making it easy to confirm that data is flowing in.
For real-time monitoring, use the Live Tail feature. This tool displays events as they happen, allowing you to verify that specific log sources are functioning. Access Live Tail from the Logs section and apply filters, such as service name or source, to focus on your newly added logs.
Another option is to use custom dashboards to monitor log ingestion performance. These dashboards can include visualizations for log volume, error rates, and ingestion trends, giving you a comprehensive view of your system's health alongside other metrics and traces.
Lastly, the Log Explorer is a powerful tool for searching and filtering specific log entries. Use it to filter by service name, source, or custom tags. If your logs appear as expected, your ingestion setup is working correctly.
If you notice missing logs, review the common issues outlined below. For further troubleshooting, refer to the next section.
Fix Common Log Collection Problems
If logs are not appearing as expected, here are some common issues and their solutions:
-
Permission Errors: Ensure the Datadog Agent has the necessary read permissions. On Linux, adjust permissions with the following commands:
For Windows, confirm that thesudo chmod 644 /var/log/myapp/*.log sudo chown dd-agent:dd-agent /var/log/myapp/ddagentuseraccount has read access to the relevant log files and directories. -
Network Connectivity: Test connectivity with this command:
If the connection fails, check your firewall settings to allow outbound traffic on port 10516. Corporate networks often block this traffic, so you may need to update firewall rules.telnet intake.logs.datadoghq.com 10516 -
File Path Issues: Double-check that the
conf.yamlfile contains absolute paths to existing log files. Ensure any wildcard patterns match actual files. -
Resource Limitations: If the Agent encounters system limits, such as "too many open files" errors, increase the file limit in your
datadog.yamlfile:logs_config: open_files_limit: 500 - Parsing Errors: Check the Agent logs for detailed error messages about parsing failures. Adjust your configuration as needed to resolve these issues.
- Container Log Problems: Incorrect labels or annotations are a common cause of container log issues. Verify that your Docker labels or Kubernetes annotations match the required syntax exactly. Even minor errors can prevent logs from being discovered.
After making any changes, restart the Agent to apply the updates. During setup, monitor the Agent logs for detailed information about errors, connection issues, or misconfigurations that might hinder log collection. This proactive approach will help ensure a smooth and reliable logging setup.
Log Collection Best Practices for SMBs
Once you've set up and verified your log collection, it's time to fine-tune it. Small and medium-sized businesses (SMBs) often face unique hurdles like tight budgets, smaller IT teams, and the challenge of balancing thorough monitoring with cost efficiency. These tips can help you make the most of your Datadog log collection without breaking the bank.
Organize Logs for Efficiency
Start by organizing your logs with thoughtful tagging. Use labels like source, team, and tier (e.g., hot, warm, cold, debugging, or compliance) to streamline cost analysis and management. Minimize redundant data by filtering out unnecessary metadata, removing null fields, and standardizing formats to reduce storage needs.
You can also generate metrics directly from logs to monitor performance indicators without storing excessive data. Consider routing low-priority logs to archival storage while retaining only critical logs - such as those marked Error, Warning, or Critical - within Datadog. These typically account for just 10–30% of your total log volume.
Fine-tune storage by customizing indexing and retention policies for different log types. For instance, debug logs might only need a short retention period, while compliance-related logs may require longer storage to meet regulatory needs.
Reduce Resource Usage
High-volume, low-value logs can put unnecessary strain on your system. To address this, implement log sampling - for example, retaining only 10% of these logs. This approach reduces system load while still providing enough data for analysis.
These adjustments build on your initial setup, helping you optimize resource usage and simplify log management.
Keep Costs in Check While Staying Compliant
Scaling your business doesn't have to mean skyrocketing log management costs. Use exclusion filters and customize retention policies to control expenses. Tailor these policies to meet your compliance requirements rather than relying on default settings. For instance, switching from a 15-day to a 3-day retention period could save you over 37% on storage costs.
Instead of storing every single event, aggregate logs to create summaries, and pre-calculate metrics when detailed logs aren't essential for audits. These strategies help you balance compliance needs with cost control, ensuring your log management remains both effective and affordable.
Conclusion
Implementing log collection in Datadog doesn’t have to be complicated, even for small and medium-sized businesses. By following the key steps - installing the Datadog Agent, enabling log collection in your datadog.yaml file, configuring log sources, and verifying ingestion - you can establish a solid starting point for effective log management.
To get the most out of your setup, consider refining it over time. Using smart tagging, setting clear retention policies, and applying strategic filtering can help you stay on top of costs while ensuring you maintain the visibility needed for troubleshooting and compliance.
Strong log management offers tangible benefits for your business. Real-time monitoring allows you to identify and address issues before they affect customers, while well-organized logs make it easier for your team to pinpoint and resolve problems quickly. Exclusion filters can also help reduce system strain and unnecessary expenses.
As your business grows, your log collection strategy should grow with it. Focus on monitoring what matters most and adapt your setup as you gain more insights into your system's behavior. With Datadog’s flexibility and a thoughtful approach, you can build a monitoring system that supports your business’s growth without overspending.
For more tips and expert advice tailored to small and medium-sized businesses, check out Scaling with Datadog for SMBs. It's a great resource for learning how to optimize your Datadog setup as your company evolves.
FAQs
How can I set up log collection in Datadog to save costs while maintaining efficiency?
To manage log collection costs effectively in Datadog, focus on filtering and prioritizing the most important data. Begin by setting up log filters to exclude logs that provide little value before they are ingested. Make it a habit to review your log and metric usage regularly to pinpoint and eliminate unnecessary data.
Leverage Datadog's built-in tools like tag cardinality limits and committed use discounts to keep expenses under control. You can also fine-tune log retention policies and filtering rules to ensure you’re only storing essential information. Regular audits of your setup will help you maintain a balance between maintaining visibility and managing costs efficiently.
What are the common reasons logs might not be collected in Datadog, and how can I fix them?
Logs might not show up in Datadog for a variety of reasons. One common issue is agent misconfiguration - for example, forgetting to enable log collection by setting logs_enabled: true or using an incorrect API key. Another frequent culprit is network problems, such as blocked ports (like port 10516, which is necessary for Docker logs).
To troubleshoot, start by reviewing your configuration files for any mistakes. Make sure the agent has the right permissions to access log files, and restart the agent to apply any updates. Turning on debug mode can provide more detailed logs, making it easier to pinpoint the problem. Also, verify that the proper log drivers are being used and that all necessary ports are open. These steps often help resolve common log collection issues.
How can I configure Datadog to efficiently manage high log volumes without straining resources?
Managing high log volumes in Datadog without putting too much strain on your system or hitting resource limits can be straightforward with the right approach. Start by breaking logs into multiple indexes. This makes it easier to organize and prioritize your data, ensuring you can focus on what matters most.
Next, use exclusion filters to get rid of logs you don't need. This helps clear out unnecessary data, keeping your system lean and efficient. You can also rely on log sampling, which allows you to zero in on the most critical information, and apply smart log indexing techniques to keep storage costs under control.
Finally, keep an eye on log patterns and tweak your configurations as needed. Regular adjustments ensure your system stays efficient, even as log volumes grow. By following these steps, you can handle high log volumes in Datadog without overloading your resources.


