How to Correlate Logs and Metrics in Datadog
Learn how to effectively correlate logs and metrics in Datadog to enhance troubleshooting, reduce downtime, and improve system performance.
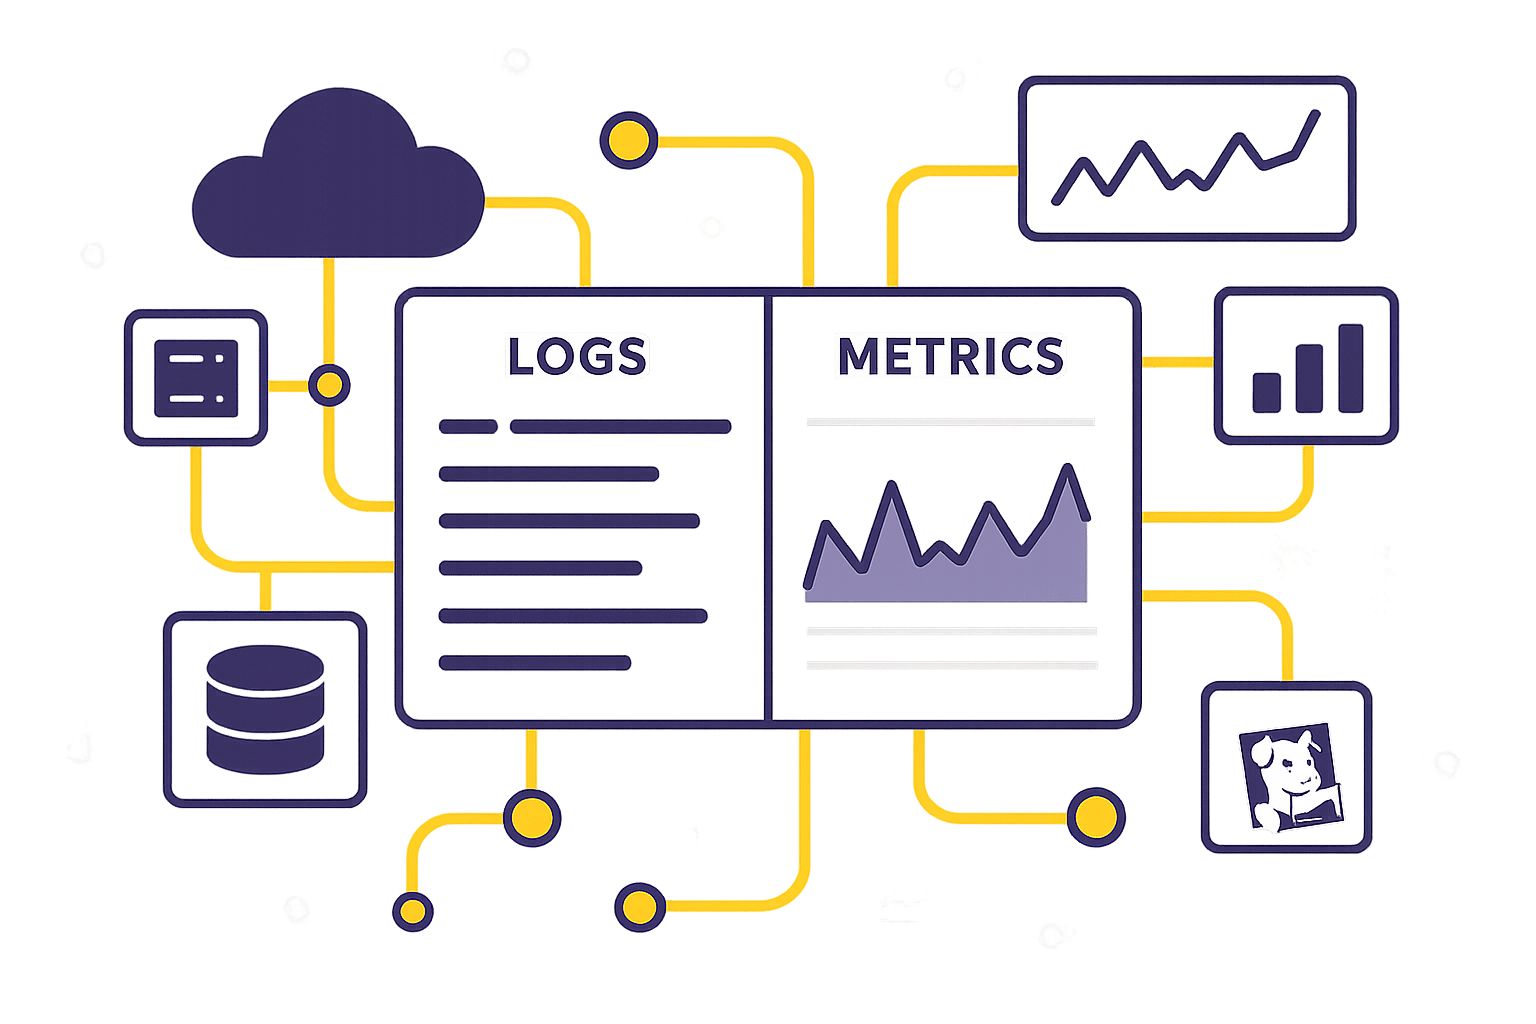
Here’s the deal: Logs capture detailed events, while metrics provide high-level trends. Correlating them connects the dots, helping you find root causes faster, improve performance, and reduce downtime. For SMBs, this means saving time, cutting costs, and maintaining smooth operations.
Key highlights:
- Why it matters: Faster issue resolution, reduced downtime costs ($5,600/min), and smarter resource allocation.
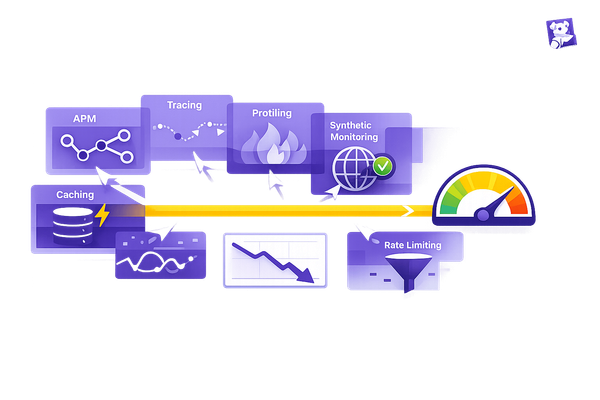
- How Datadog helps: Unified tools like Log Explorer, Metrics Explorer, and AI-driven Watchdog simplify correlation.
- Best practices: Use standardized tags, JSON logs, synchronized timestamps, and trace IDs for seamless data linking.
Datadog makes it easy to correlate logs and metrics, so you can focus on keeping your systems running smoothly.
Data Correlation in Datadog Boost Your Observability & Troubleshooting
Setting Up Log and Metric Correlation in Datadog
To get the most out of Datadog's capabilities, you'll need to prepare your environment by tackling a few key steps: ensuring prerequisites are met, configuring data sources, and following best practices for data ingestion.
Prerequisites for Correlation
Before you can start correlating logs and metrics, it’s essential to lay the groundwork. Begin by verifying account permissions. Your team will need the appropriate access to configure logs, metrics, and tracing within Datadog. Typically, this means admin-level permissions or roles that allow modifications to log pipelines and metric settings.
For a complete system view, make sure logs are linked across functions, hosts, containers, and cloud services. This interconnected setup gives you a unified perspective, which is critical for effective troubleshooting. Without these connections, you’re left with isolated data points rather than a cohesive picture.
Enable distributed tracing libraries to propagate request context across services, ensuring logs and traces are unified. This step is crucial for turning fragmented data into a clear narrative of your system’s behavior.
To simplify the process, configure your tracing library for automatic trace-log correlation. For example, if you’re using Python, set DD_LOGS_INJECTION=true. This automation saves time and ensures consistent correlation across your infrastructure.
Configuring Log and Metric Sources
The way you set up your log and metric sources plays a huge role in how effectively they work together. Start by structuring your logs in JSON format. JSON makes parsing easier and allows for the addition of custom fields and metadata, which can enhance correlation.
Tagging consistently is another must. Use the same tags and naming conventions for both logs and metrics. For instance, if your metrics are tagged with service:web-app and environment:production, make sure your logs follow the same pattern. This consistency allows Datadog to automatically identify and link related data points.
When it comes to sending data, you have two reliable options: the Datadog Agent or the OpenTelemetry Collector. The Datadog Agent integrates deeply with Datadog’s ecosystem, while OpenTelemetry offers a vendor-neutral alternative. Both support scalable ingestion and built-in correlation.
Leverage Datadog Pipelines to derive metrics directly from logs. For example, you can generate error rate metrics from error logs, creating natural points of correlation between qualitative log data and quantitative metrics.
Datadog’s tools are designed to make correlation seamless, whether it’s between logs, metrics, traces, or RUM data. Take advantage of these built-in features instead of building custom solutions from scratch.
Data Ingestion Best Practices
Getting data ingestion right is critical for smooth correlation. Start by implementing structured logging with key elements like timestamps, log levels, and unique identifiers. This structure makes it easier to automate processing and link related events.
Include timestamps, user request identifiers, and unique trace IDs in your log messages. These details provide the context needed to correlate events across systems and time periods. Standardizing trace IDs across all observability data types is particularly important. By injecting trace IDs consistently across services and including them in logs and metrics, you create a common thread that ties events together.
Ensure all data aligns with accurate timestamps. Even minor time discrepancies can break correlation logic, so synchronize your systems to a reliable time source.
Enrich your logs with metadata pulled from traces, such as user IDs, request paths, or API endpoints. Similarly, add context to metrics with details like environment, version, or user segment information. This additional layer of detail opens up more angles for correlation and makes troubleshooting more precise.
Pay attention to log bucket management. Set up monitors to alert you about unusual ingestion spikes by tracking estimated usage metrics by service or source. For each index, configure a Daily Quota and Warning Threshold to catch any unexpected activity early.
For long-term retention of high-volume data, use Flex Logs. For real-time troubleshooting, stick to Standard Indexing. To avoid accidental changes that could disrupt your setup, restrict Modify Index permissions to central admins and unit leads. Use the Audit Trail feature to monitor and alert on changes to Index retention or Exclusion Filter settings, ensuring your correlation setup remains intact.
How to Correlate Logs and Metrics in Datadog
Once your data sources are set up and ingesting data correctly, it’s time to dive into correlation. Datadog offers several ways to connect logs and metrics, each tailored to different troubleshooting needs and workflows.
Using Log Explorer and Metrics Explorer
The Log Explorer and Metrics Explorer are your go-to tools for identifying correlations. If you spot an issue in your metrics - say, a sudden spike in error rates - start by opening the Log Explorer. This helps you trace the problem back to its source.
Focus your log search by filtering logs within the same time range as the metric anomaly. For example, if your error rate spiked at 2:15 PM EST, narrow your log query to that exact timeframe for more precise results.
Subqueries in the Log Explorer allow you to refine your search further. For instance, if you’re investigating failed database connections during a performance issue, create a subquery that identifies database errors first. Then, connect those errors to performance metrics for deeper insights.
Standardized tags are a big help here. They make it easier to toggle between Log Explorer and Metrics Explorer while keeping the same filters. If you notice a pattern in your logs, you can immediately switch to Metrics Explorer using the same service and environment tags to assess the broader impact on your system.
Starting Correlation from Dashboards
Dashboards make it simple to correlate logs and metrics by showing them side by side. If you notice an unusual pattern in a metric graph, you can quickly pivot to the relevant log data without losing your place.
You can enhance dashboards by adding log analytics graphs directly from the Log Explorer or the dashboard editor. For example, place an application error rate graph next to a log analytics graph showing error frequency. This setup allows you to visualize both metrics and log patterns in one view.
Dashboard template variables further streamline investigations. When you update a variable - like the service or environment filter - it refreshes all related widgets, keeping everything in sync. This is especially helpful when troubleshooting, as it ensures all your graphs and log analytics stay aligned.
From any dashboard panel, you can jump to other correlated views, such as the Log Explorer, host maps, infrastructure dashboards, or request traces. The system retains your filters and time range, making it easy to troubleshoot step by step. For more focused troubleshooting, consider using runbook dashboards that combine metrics with specific log queries.
Using Watchdog for Advanced Correlation
For an automated approach, Datadog’s Watchdog feature takes correlation to the next level. This AI-driven tool continuously monitors your metrics, logs, and traces to detect anomalies and suggest related data points you might miss.
Watchdog identifies unusual behavior in real time and correlates these anomalies with relevant log and trace data. It even maps service dependencies and ranks likely causes through Root Cause Analysis (RCA). For example, if database query times spike, Watchdog will search for related error logs and pinpoint which queries or services are affected.
The tool’s automated insights are particularly useful for smaller teams. Watchdog learns from your application’s behavior and recommends logs to investigate when specific metric patterns arise. Alerts link directly to the relevant logs, metrics, and traces, saving you time.
Watchdog also includes forecasting capabilities. By analyzing historical trends in your logs and metrics, it predicts when current anomalies might lead to bigger issues, giving you a chance to act before things escalate. This is a game-changer for teams that need quick, actionable insights with limited resources.
Best Practices for Log and Metric Correlation
Once you've set up the basics, following these best practices can sharpen your correlation strategy, ensuring your logs and metrics work together seamlessly.
Structuring Logs and Metrics for Correlation
Say goodbye to inconsistent log messages. Instead, stick to a predefined JSON format with standardized timestamps, log levels, and message structures. This helps keep your log data uniform and easier to analyze when paired with metrics.
Tagging consistency is key. Use the same tag names across all data sources for services, environments, and regions. For example, if you tag a metric with service:checkout and env:production, make sure your logs use identical tags. This uniformity makes it much easier to correlate data quickly and intuitively.
Trace IDs are your secret weapon. Propagate them across your services to link logs, metrics, and traces effortlessly. Tools like OpenTelemetry or instrumentation libraries can help inject trace IDs consistently. With these IDs in place, you can quickly track down related logs and performance metrics when an issue arises.
Don't overlook timestamp alignment. Use NTP to synchronize system clocks and ensure your timestamps match perfectly. Additionally, enrich your logs with contextual metadata from traces - like user IDs, request paths, or API endpoints. This added context bridges the gap between individual user experiences and overall system performance.
By following these practices, you'll speed up root cause analysis and align with Datadog's integrated monitoring philosophy.
Setting Up Alerts for Correlated Data
Once your data is structured, it's time to focus on alerts that matter. Your alerts should shine a spotlight on user-impacting symptoms, not just technical hiccups. When setting up an alert, ask yourself: Is this condition urgent? Does it require immediate action? Is it actively affecting users?.
Keep it simple - alert only on actionable issues. The best alerting systems minimize noise and maximize clarity. Every alert should demand attention and require human intervention to resolve.
"Every time the pager goes off, I should be able to react with a sense of urgency. I can only react with a sense of urgency a few times a day before I become fatigued."
Conclusion and Key Takeaways
Using Datadog to correlate logs and metrics transforms how SMBs handle monitoring and troubleshooting. By offering a unified view of your systems, it eliminates the need to dig through separate data sources during incidents, saving valuable time and effort.
Take, for example, when Datadog's Watchdog flagged a sudden spike in latency during the checkout process of an online store. Instead of wasting hours sifting through various dashboards, the team used Metric Correlations directly from the Watchdog story. This led them straight to the root cause, allowing them to restore service quickly and efficiently. For SMBs with smaller technical teams, this kind of speed and precision is a game-changer.
A consistent data structure is key to making these tools work seamlessly. By maintaining uniform tags across services, standardized log formats, and synchronized timestamps, you can reduce the time spent on manual investigations and let the correlation tools do the heavy lifting.
Automation takes this even further. Features like Watchdog and Metric Correlations simplify anomaly detection, enabling smaller teams to monitor and manage complex systems with the same effectiveness as larger organizations.
Accurate alerting is another critical piece of the puzzle. As your business grows, Datadog scales with you, ensuring your monitoring practices keep up without adding unnecessary complexity. For additional support, resources like Scaling with Datadog for SMBs provide practical tips and real-world examples to help you get the most out of the platform.
The benefits are clear: reduced downtime, improved reliability, and the confidence to scale your operations. By starting with a solid data structure, leveraging Datadog's automation, and adopting scalable monitoring practices, you can ensure your systems remain resilient as your business grows.
FAQs
How does Datadog help connect logs and metrics to improve system reliability and reduce downtime?
Datadog simplifies the process of connecting logs and metrics, offering teams a sharper perspective on system performance and potential problems. By tying these elements together, you can swiftly pinpoint the root cause of issues, gauge their impact, and address them before they escalate into serious disruptions.
This integration speeds up troubleshooting, cuts down on mean time to resolution (MTTR), and encourages proactive monitoring. With Datadog’s suite of tools, you can spot irregularities early, reduce downtime, and ensure your systems operate smoothly.
How can I set up and optimize log and metric correlation in Datadog?
To set up log and metric correlation in Datadog, start by ensuring your logs are structured properly - ideally in JSON format. This makes parsing and linking much smoother. Use tools like the Log Explorer and Metrics Explorer to visualize your data and connect logs with the relevant metrics. These tools provide a clear view of your system’s performance.
You can also create log-based metrics to extract specific metrics directly from your logs. The Correlations tab in dashboards is particularly helpful for spotting patterns or relationships between logs and metrics. To make troubleshooting even faster, consider automating log-trace linkage and applying dynamic filters, such as subqueries. These steps will help you improve observability and streamline the process of identifying and resolving issues, making your system monitoring more effective.
How does Datadog's Watchdog help detect and resolve system issues more effectively?
Datadog's Watchdog leverages advanced machine learning to spot performance issues in your systems automatically - no manual setup required. It keeps an eye out for unusual patterns, like sudden latency spikes or rising error rates, and sends detailed alerts to help you pinpoint and resolve problems quickly.
By simplifying anomaly detection and delivering clear insights, Watchdog helps you resolve issues faster, minimize downtime, and maintain a more reliable system overall.