How to Debug Datadog API Metric Issues
Learn how to effectively troubleshoot Datadog API metric issues, ensuring accurate data delivery and reliable monitoring for your applications.

When your Datadog metrics don’t show up or behave as expected, the problem often boils down to these key issues:
- Authentication Errors: Invalid or expired API keys are a common cause. Always ensure your API key is valid, properly scoped, and configured for the correct endpoint.
- Payload Formatting Problems: Errors in JSON structure - like missing fields or incorrect data types - can lead to API rejections. Stick to Datadog’s required format for metric submissions.
- Rate Limiting or Network Issues: Exceeding API limits or facing connectivity problems (e.g., timeouts, DNS failures) can disrupt metric delivery. Monitor API usage and implement retry logic.
To debug effectively:
- Validate API Keys: Test your key using Datadog’s validation endpoint.
- Check Connectivity: Use tools like
curlto confirm network access to Datadog servers. - Inspect Logs: Look for HTTP status codes and error messages to identify specific issues.
- Verify Metrics in Datadog: Use the Metrics Explorer to confirm data ingestion.
Prevent future problems by managing API keys securely, standardizing metric naming/tagging, batching submissions, and documenting troubleshooting steps. These practices ensure smooth metric delivery and reliable monitoring.
How Do I Troubleshoot Datadog? - Next LVL Programming
How Datadog API Metric Collection Works
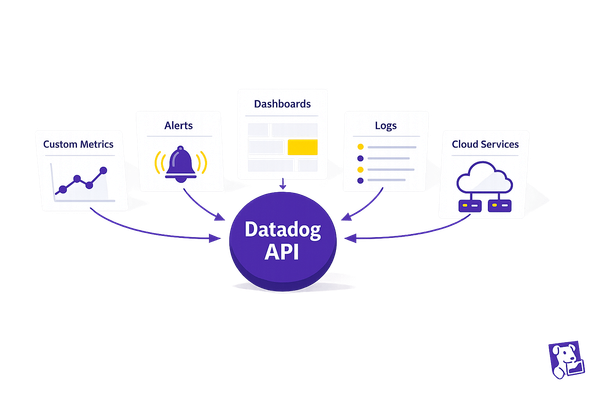
The Datadog Metrics API acts as a direct channel for sending custom time-series data to your monitoring platform. While the Datadog Agent automatically gathers system metrics, the API gives you full control over what data you send, when you send it, and how it’s formatted.
Using HTTP requests, the API transmits your custom data to Datadog’s servers. Once there, Datadog processes the data, making it accessible in dashboards, alerts, and analytics tools. This setup is crucial for addressing metric-related issues, as discussed later.
API Metric Collection Basics
At its core, API metric collection relies on HTTP POST requests sent to Datadog's metric submission endpoint. The payload in each request must follow a specific JSON structure required by Datadog. Understanding this structure is essential for diagnosing submission issues.
Each metric submission includes four key elements:
- Metric name (e.g.,
app.response_time) - Numeric value
- Unix epoch timestamp
- Host identifier
Tags can also be added to help organize and filter your data. Examples of commonly used tags include environment:production, service:api, or region:us-east-1.
Unlike metrics collected by the Agent - which automatically gathers system data - API metrics require you to explicitly define what’s being sent. This manual approach gives you finer control over your monitoring data.
Authentication and Permissions
Every API call must include a valid API key in the request headers, typically under the DD-API-KEY field. Without proper authentication, submissions will fail with a 401 Unauthorized error.
Datadog uses two types of keys: API keys and Application keys. For metric submissions, only an API key is necessary, as it verifies your organization’s permission to send data. Application keys, on the other hand, are used for tasks like reading data or managing dashboards.
Managing API keys effectively is crucial for both security and troubleshooting. You can name and scope keys for specific purposes, which makes it easier to identify the source of incoming data. If a key is compromised or needs to be updated, you can disable or regenerate it without disrupting other integrations.
Keep in mind that rate limits apply to all API key usage. Understanding these limits is important, especially during high-traffic periods, to avoid submission failures.
Common Use Cases for SMBs
For small and medium-sized businesses (SMBs), the Metrics API is particularly useful in scenarios where standard monitoring doesn’t provide a complete picture. Custom metrics allow SMBs to track performance indicators that directly affect their operations.
For example:
- E-commerce platforms monitor conversion rates, cart abandonment, and revenue per visitor.
- SaaS applications track user engagement, feature adoption, and subscription events.
- Financial services oversee transaction processing, compliance, and risk management.
- Manufacturing and IoT applications send sensor data and performance metrics from production lines and equipment.
For more SMB-focused insights, check out Scaling with Datadog for SMBs.
Common Causes of Metric Issues
Building on the earlier discussion about API workings and authentication, let’s explore some of the most common reasons metrics fail. These problems generally fall into three categories. Identifying them quickly can help you troubleshoot more efficiently and get your monitoring back on track.
Authentication Failures
One of the most frequent culprits behind metric issues is invalid or expired API keys. When this happens, you’ll typically see a 401 Unauthorized error, and your metrics won’t make it to the platform. This can happen if the keys are incorrect, missing, or have been revoked. To avoid this, make sure your keys are up-to-date and valid.
Another potential issue arises when the API key doesn’t have the required permissions due to strict security settings. Even if the key itself is valid, it may fail to authenticate. Double-check that your keys are configured for the correct regional endpoint and have the necessary access.
Payload Formatting Errors
Datadog’s API has specific requirements for JSON payloads, and small mistakes can cause big problems. Errors such as missing commas, unclosed brackets, or incorrect data types can result in a 400 Bad Request error. Incomplete payloads - where fields like the metric name, value, timestamp, or host are missing - will also be rejected.
Additionally, metric names must follow Datadog’s naming conventions. If they don’t, you may encounter display issues in your dashboards. Overloading a single request with more than 500 metrics or exceeding Datadog’s size limits can trigger a 413 Payload Too Large error. Keeping payloads clean and within limits is key to avoiding these issues.
Rate Limiting and Network Problems
Submitting too many metrics too quickly can lead to rate limiting, which returns a 429 error. If you continue to push requests without addressing the issue, you might face prolonged throttling.
Network issues, such as high latency, DNS failures, or SSL/TLS errors, can also disrupt metric submissions. These problems often cause timeouts, making it impossible to connect to Datadog. Temporary disruptions might occur during periods of heavy network congestion or scheduled maintenance.
Step-by-Step Debugging Process
When your metrics aren't showing up in Datadog, following a structured process can help you quickly pinpoint and resolve the issue. Start with the basics and address each potential problem systematically until you uncover the root cause.
Check API Key and Permissions
First, confirm that your API key is valid and has the necessary permissions. Use an API testing tool to validate the key through Datadog's validation endpoint. If the response confirms success, your API key is active and correctly configured. If you encounter errors, either generate a new key or double-check that you're using the right one.
Keep in mind, if the key works for one metric, it should work for all metrics tied to the same account. Once you've verified the key, move on to testing your connection to Datadog.
Test API Connectivity
Next, test your connection to Datadog's servers by sending a basic metric payload using curl from your command line or terminal. If the request times out or fails, the issue might stem from network problems, firewall restrictions, or DNS settings. Verify that your server can reach Datadog's endpoints and that no security policies are blocking the connection.
A successful connection will return an appropriate HTTP status code, even if the payload itself has formatting issues. If you’re unable to connect at all, the problem is likely network-related rather than an issue with the metric data. Once connectivity is established, check your logs for further clues.
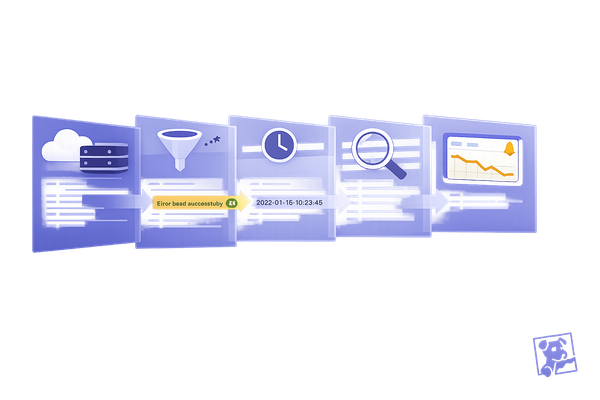
Check Logs for Error Messages
Your application logs are an excellent resource for diagnosing issues with metric submissions. Look for HTTP status codes in the API responses, as these codes provide specific information about the problem.
Examine the JSON response for details, focusing on fields like "status": "error" and descriptions that highlight the issue. These often point to problems like incorrect formatting, missing fields, or parsing errors in your payload.
If you're sending logs to Datadog, the Error Tracking Explorer can help you group and analyze errors. This tool makes it easier to identify recurring problems or patterns that might not stand out when reviewing individual logs.
Use Metrics Explorer for Validation
Once connectivity and authentication issues are resolved, use Datadog's Metrics Explorer to verify that your metrics are being received and processed correctly. Search for the specific metric names to ensure they appear in the system. Check that timestamps align properly and that any tags are applied as expected.
If metrics show up in the Metrics Explorer but not in your dashboards, the problem is likely with your dashboard configuration rather than the API submissions. Adjust your dashboard settings to ensure everything displays as intended.
Best Practices for Preventing Metric Issues
Avoiding metric issues is crucial for maintaining a reliable data flow into your Datadog environment. Following these practices can help you sidestep common pitfalls and ensure your metrics are accurate and accessible.
Secure API Key Management
Think of your API keys as you would passwords - they demand careful handling. Store them in environment variables or use secret management tools, but never hard-code them or include them in version control.
Regularly rotate your API keys, ideally every 90 days. This limits the risk if a key is ever compromised. When rotating keys, create a new one first, update your applications to use it, and only delete the old key once you’ve confirmed everything is working smoothly.
For team environments, assign separate API keys to each application or team member. This makes it easier to track usage and revoke access if someone leaves or an application no longer needs it. Maintain clear documentation that maps API keys to their respective systems for easier management over time.
Standardize Metric Naming and Tagging
Establish a clear and consistent naming convention for your metrics. For instance, use a pattern like company.service.metric_name or environment.application.measurement. Avoid mixing formats like prod-web-response and production.database.cpu, as this inconsistency complicates filtering and analysis.
Tag your metrics thoughtfully with relevant metadata, such as environment, service version, or geographic region. Tags like env:production, service:api, and version:2.1.3 make it easier to filter and analyze data later. However, be cautious about overloading your metrics with too many unique tag combinations, as this can affect both performance and costs.
To keep everyone aligned, create a shared documentation file that outlines your naming conventions and required tags. This resource helps new team members follow established patterns and prevents your metrics from becoming disorganized over time.
Monitor API Rate Limits and Usage
Datadog enforces API rate limits to ensure fair use across all customers. Keep an eye on your API usage patterns to avoid hitting these limits, especially if you’re sending a high volume of metrics.
In case of rate-limiting errors, implement exponential backoff and retry logic in your applications. Start with a 1-second delay and double it with each retry attempt. This prevents your application from overwhelming the API while still ensuring your metrics are eventually submitted.
Whenever possible, batch your metric submissions instead of sending individual API calls for each data point. For example, sending 100 metrics in one API call is far more efficient than making 100 separate calls. This reduces network overhead and lowers the risk of hitting rate limits.
Document Troubleshooting Procedures
Technical fixes are only part of the solution - clear documentation is equally important. Create a troubleshooting runbook that your team can use when metric issues arise. Include common error messages, their likely causes, and step-by-step resolutions. This saves time during incidents and empowers less experienced team members to resolve issues independently.
Maintain a record of past incidents, including their causes, resolution times, and fixes. This historical data can reveal patterns and highlight areas for improvement. For example, if API key expiration causes repeated problems, you can set up better reminders for key rotation.
Keep your contact information and escalation procedures updated in the runbook. Specify who to contact for different types of issues and when to escalate them to Datadog support. Having this information readily available can prevent delays during critical incidents.
Finally, test your troubleshooting steps regularly during quieter periods. This ensures the process remains effective even as your infrastructure evolves and helps your team stay prepared for real emergencies.
Conclusion: Key Takeaways for Debugging Datadog API Metric Issues
Debugging Datadog API metric issues requires a clear understanding of the basics and a structured approach. The two most common trouble spots are authentication and payload formatting - these are often at the root of issues SMBs face when sending metrics through the API.
Start by checking your API key, testing connectivity, and reviewing logs for error messages. Datadog’s API responses are designed to help pinpoint problems, offering detailed status and error fields. These can quickly reveal whether you're dealing with authentication glitches, payload missteps, or network issues.
Once connectivity and authentication are confirmed, shift your focus to data integrity. The Metrics Explorer is an essential tool for ensuring metrics are being correctly ingested by Datadog. Regular use of this tool can help you identify missing data or formatting errors early, preventing these problems from affecting your monitoring and alerts. This proactive step can save you significant time and hassle down the line.
Prevention is key to maintaining smooth metric collection. Using client libraries for languages like Python and Go can eliminate many manual errors related to authentication and payload formatting. These libraries simplify the process, handle much of the complexity for you, and offer better error management compared to custom-built solutions.
To ensure long-term success, keep your documentation up to date and follow consistent monitoring practices. Regularly review API usage to avoid hitting rate limits, and stick to standardized naming conventions for your metrics. As your infrastructure scales and more team members work within your Datadog environment, these habits will make troubleshooting faster and more efficient. Each issue you resolve builds your team’s expertise and strengthens your knowledge base, paving the way for quicker and more effective problem-solving in the future.
FAQs
What are the signs of issues with Datadog API metric submissions?
If you're having trouble with Datadog API metric submissions, here are a few signs that something might be off:
- Metrics not appearing in the Metric Explorer or on your dashboards.
- Errors from the API, like failed requests or invalid responses.
- Submitted metrics showing no data.
These issues often stem from problems with how the data is formatted, how it's being submitted, or the API configuration itself. Taking a close look at your API logs and double-checking that your payloads align with Datadog's requirements can help you pinpoint and fix the problem quickly.
How can I securely manage Datadog API keys to prevent unauthorized access?
To keep your Datadog API keys safe and prevent them from falling into the wrong hands, it's crucial to follow security best practices. Start by implementing role-based access control (RBAC). This ensures permissions are assigned based on the principle of least privilege, meaning users and applications only get access to what they absolutely need.
Make it a habit to rotate your API keys regularly. This reduces the risk of exposure if a key is ever compromised. Also, avoid embedding API keys directly in your code or configuration files. Instead, use secure storage options like encrypted storage or secrets management tools such as AWS Secrets Manager or Azure Key Vault.
Finally, keep an eye on access logs for any unusual activity. If you suspect a key has been compromised, revoke it immediately to maintain the integrity of your system.
What should I do if I get a 429 rate-limiting error when sending metrics to Datadog?
A 429 error means you've exceeded the API rate limit. Start by checking the Retry-After header in the response, which tells you how long to wait before trying again. If the problem continues, use an exponential backoff strategy - this involves slowly increasing the time between retries to reduce strain on the system. To avoid running into this issue in the future, keep an eye on your API request rates to ensure they stay within Datadog's limits. You can also manage your activity better by adjusting how you use the API or combining multiple requests into batches.

