How to Monitor Any PaaS with Datadog: A Practical Guide for Vercel, Heroku, Render, and More
Learn how to effectively monitor your PaaS platforms using Datadog, covering setup, key metrics, and cost optimization strategies.

Need to keep your PaaS running smoothly? Datadog helps you monitor platforms like Vercel, Heroku, and Render with ease. Here’s how it works:
- Unified Monitoring: Track system health, application performance, and logs - all in one place.
- Key Metrics to Watch: CPU usage, memory, response times, error rates, and more.
- Quick Setup: Install integrations for Vercel, Heroku, or Render in just a few steps.
- Custom Dashboards: Build dashboards to visualize performance and troubleshoot faster.
- Cost Control: Optimize monitoring expenses with log sampling and efficient configurations.
Quick Comparison of PaaS Monitoring Features
| Platform | Integration Steps | Key Metrics | Setup Time |
|---|---|---|---|
| Vercel | Use Vercel Marketplace | Response times, request throughput | ~10 minutes |
| Heroku | Add Datadog Buildpack | Dyno performance, database health | ~15 minutes |
| Render | Configure log streaming | CPU, memory, disk I/O | ~20 minutes |
Start by connecting Datadog to your PaaS, set up alerts, and create dashboards to track performance. With Datadog, you’ll reduce downtime, improve reliability, and manage costs effectively.
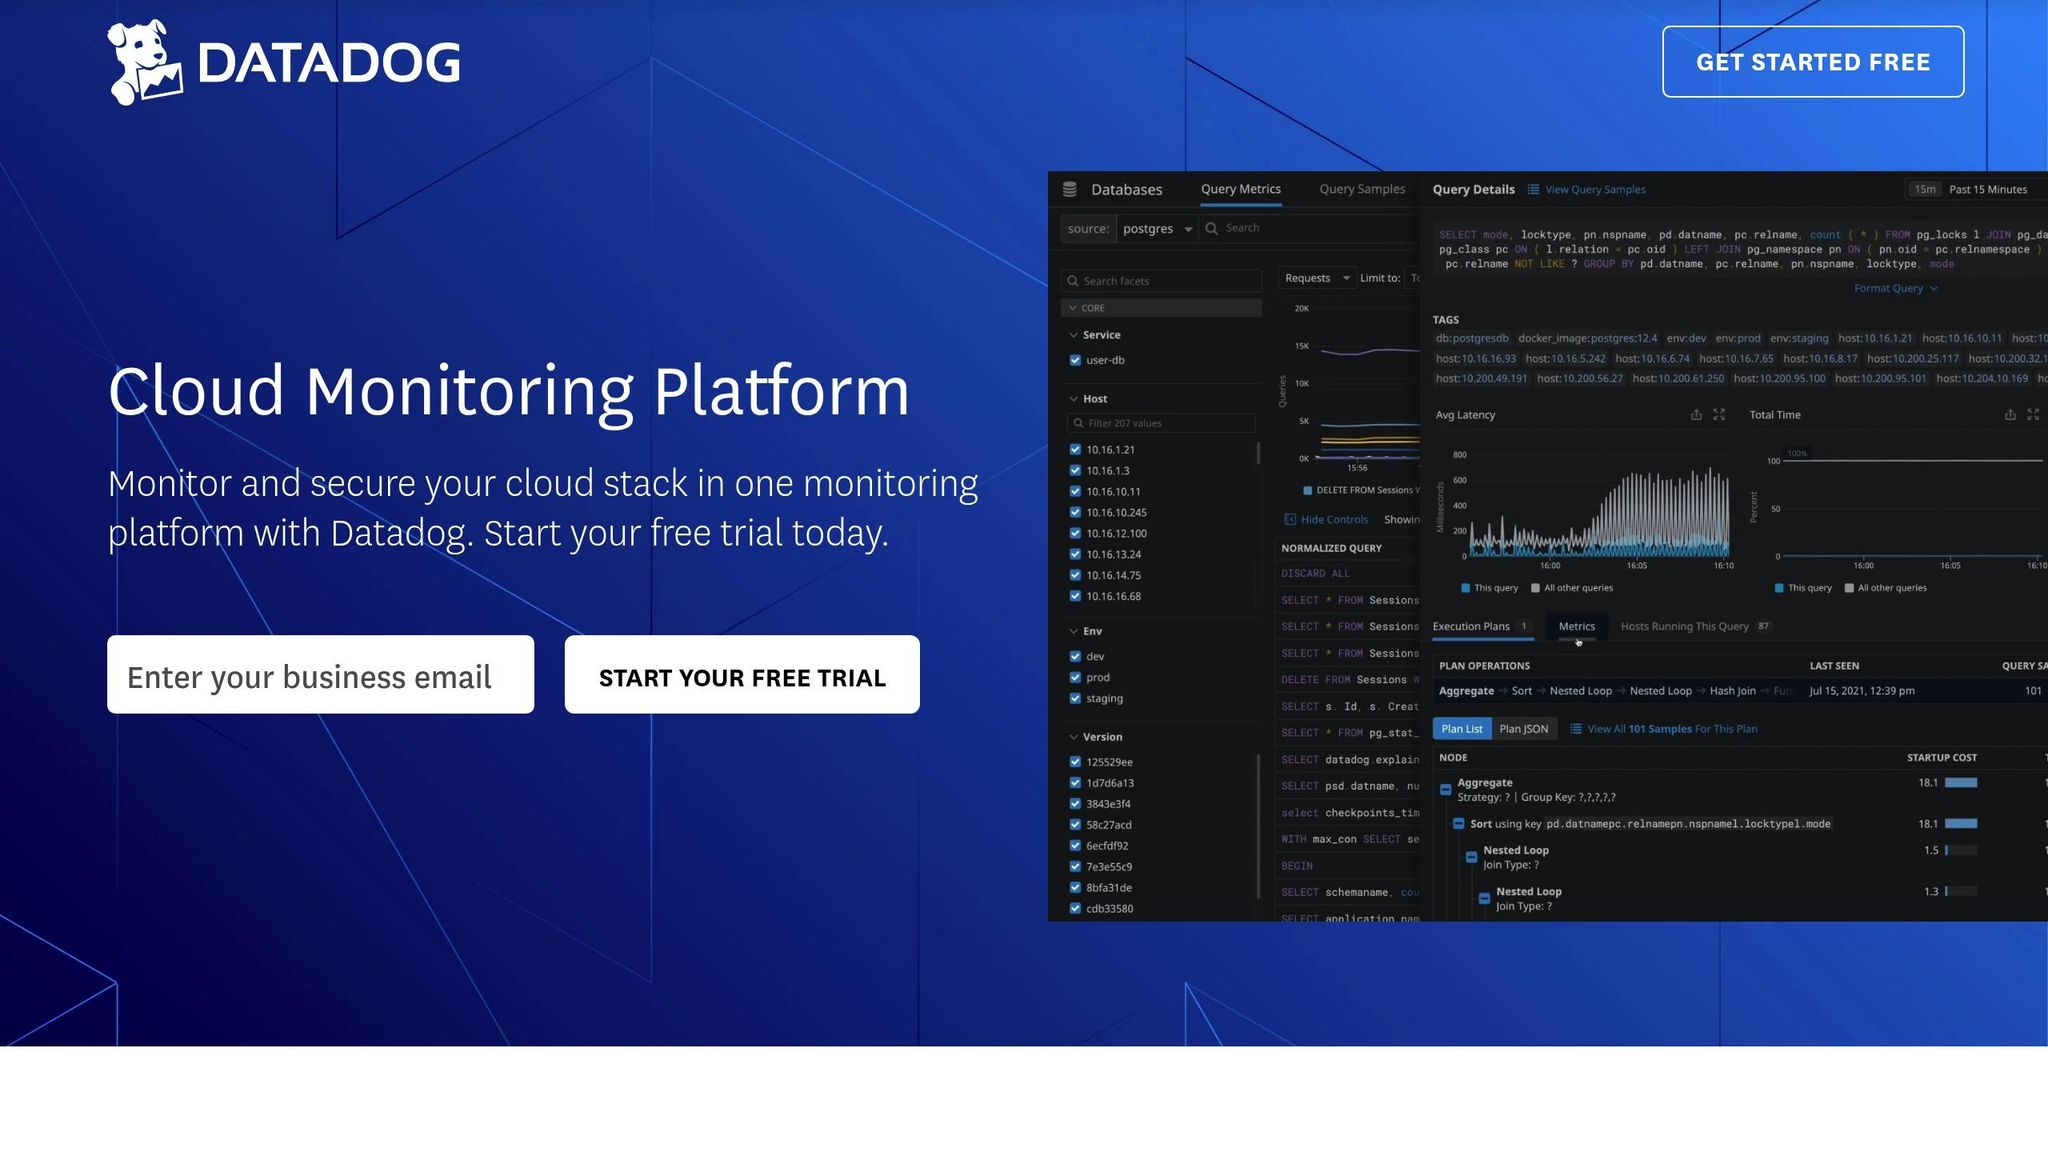
Datadog Universal Service Monitoring Demo
Setup Requirements for PaaS Monitoring
Before integrating Datadog for PaaS monitoring, it's important to gather the necessary tools and permissions. This preparation ensures a smooth setup process and allows you to effectively monitor your platform services.
Basic Setup Checklist
To get started, make sure you have the following accounts and credentials ready:
- Datadog Account: Ensure you have an active Datadog account with the right subscription tier for your needs.
- API Key: Obtain an organization-level API key. Note that Datadog integrations do not support application keys or user-scoped API keys.
- PaaS Platform Access: Administrative permissions on your PaaS platform are required.
- Site Compatibility: Confirm that your PaaS platform is compatible with your Datadog site.
"Make sure to create an API key for your organization. The Datadog integration doesn't support using an application key or a user-scoped API key." - Render Documentation
Additionally, configure your log intake endpoints based on your Datadog site:
| Datadog Site | Log Intake Endpoint |
|---|---|
| US1 (Default) | intake.logs.datadoghq.com:10516 |
| EU | tcp-intake.logs.datadoghq.eu:443 |
Once this setup is complete, you’ll be ready to monitor your platform and track performance effectively.
Main Metrics to Track
To maintain the health and efficiency of your PaaS, focus on monitoring key performance metrics.
System Health Metrics:
- CPU usage trends
- Memory availability and usage
- Disk I/O performance
- Network throughput
Application Performance Metrics:
- Response times (aim for under 100ms)
- Error rates, such as 5xx responses
- Request throughput
- Number of active connections
Setting Up Datadog with Vercel, Heroku, and Render
Connecting to Vercel
You can link Datadog to your Vercel projects using the Vercel Marketplace.
-
Install Datadog Integration:
In your Vercel dashboard, head to the Integrations section. Search for Datadog, click on "Add Integration", and authorize the connection. -
Configure API Settings:
Provide your Datadog API key in the configuration panel. Then, select the appropriate Datadog site (US1 or EU) to ensure metrics are sent to the correct endpoint.
With Vercel set up, let’s move on to Heroku.
Connecting to Heroku
Heroku integrates with Datadog using the Datadog Buildpack, which collects performance metrics from your dynos.
-
Install Datadog Buildpack:
First, enable runtime dyno metadata and add the Datadog Buildpack by running these commands in your terminal:heroku labs:enable runtime-dyno-metadata -a $APPNAME heroku config:add DD_DYNO_HOST=true -a $APPNAME heroku buildpacks:add --index 1 https://github.com/DataDog/heroku-buildpack-datadog.git -
Configure Monitoring Settings:
Add specific integration configurations based on your setup:Integration Type Configuration Command Redis DD_ENABLE_HEROKU_REDIS=truePostgres DD_ENABLE_HEROKU_POSTGRES=trueAPM Tracing DD_APM_ENABLED=true
With Heroku ready, let’s finalize your setup by connecting Render.
Connecting to Render
Render works seamlessly with Datadog to track system metrics and database performance. The setup process depends on your specific service.
-
Configure Log Streaming:
Choose the correct Datadog site endpoint based on your region:Datadog Site Log Intake Endpoint US1 (Default) intake.logs.datadoghq.com:10516 EU tcp-intake.logs.datadoghq.eu:443 -
Enable Database Monitoring:
Render automatically tracks PostgreSQL metrics, such as CPU usage, memory consumption, disk I/O, and network statistics. Key metrics include:Metric Description system.cpu.system Percentage of CPU time spent on kernel operations system.mem.used Current memory usage system.mem.total Total available memory
After updating monitoring settings, restart your PostgreSQL instance during a low-traffic window to apply the changes smoothly.
Building Custom Monitoring Dashboards
Making Your Dashboard
Datadog's drag-and-drop interface makes creating dashboards straightforward. Start with Datadog templates, then tweak them to fit your PaaS setup.
For effective PaaS monitoring, divide your dashboard into these key sections:
| Dashboard Section | Key Metrics to Display |
|---|---|
| Infrastructure Overview | CPU usage, memory consumption, disk I/O |
| Application Performance | Response times, error rates, request counts |
| Database Health | Query performance, connection pools, cache hits |
| Business Metrics | User sessions, conversion rates, API calls |
At TelusHealth, the cloud infrastructure team used Datadog's tagging system to simplify visualizations for new stacks. Chris Lee, Director of Cloud Strategy & Architecture at TelusHealth, shared:
"When we spin up a new stack, it's instantly available in Datadog. Our tagging comes through, and we can slice and dice the data and use pre-built dashboards to start to visualize the different solutions."
Once your dashboard is set up, the next step is configuring alerts to act on the data insights.
Setting Up Alert Rules
Alerts should be precise - enough to catch critical issues without overwhelming the team with noise. Tailor your alert rules to match the specific needs of your PaaS platform.
| Alert Type | Threshold Example | Response Time |
|---|---|---|
| Critical Performance | CPU > 80% for 10 min | Immediate notification |
| Resource Usage | Disk usage > 85% | Within 30 minutes |
| Business Impact | Error rate > 5% | Within 5 minutes |
Calvin French-Owen, CTO & Co-Founder of Segment, highlights the value of intuitive alerting:
"The clean, easy to use interface allows anyone on our development team to create a Datadog dashboard, start sending metrics from their program, and really understand in fine-grain detail what that program is doing."
For dynamic environments, leverage features like tag-based alerts, composite monitors, and severity-based policies to maintain flexibility.
David Buonasera, CTO at SpringServe, describes how custom dashboards enhance his team's workflow:
"Dashboarding is amazing - we can put whatever we want on here and have our own custom view. I have this open all day long, and I know other engineers do, too."
When setting up alert notifications, include:
- Direct links to affected services
- Relevant metrics and graphs for context
- Suggested troubleshooting steps to guide resolution
- Escalation paths for critical issues
This setup ensures your team can quickly pinpoint and resolve problems, minimizing user disruption.
Fixing Common PaaS Monitoring Issues
Finding Lost Metrics
If you're struggling to locate missing metrics, start by ensuring your API and APP keys are properly configured. Here are some common issues and their solutions:
| Issue | Solution | Impact |
|---|---|---|
| Timestamp Errors | Confirm POSIX time is within 10 minutes in the future or 1 hour in the past | Avoids data gaps |
| Agent Status | Run the datadog-agent info command |
Verifies connectivity |
| Port Access | Check that ports 443 and 8125 are open | Maintains data flow |
For those using EC2 instances, confirm that your IMDS version is up-to-date and ensure EC2 tags are syncing correctly. Once metrics are addressed, move on to resolving log streaming issues to ensure uninterrupted data flow.
Fixing Log Problems
After tackling metric issues, focus on resolving log-related challenges. Logs are essential for complementing your metrics, so it's crucial to ensure proper configurations and authentication.
Start by verifying your Datadog API key and site settings. For US1, use intake.logs.datadoghq.com:10516, and for EU, use tcp-intake.logs.datadoghq.eu:443. To keep your data secure, enable TCP log forwarding with TLS encryption.
Reducing Monitoring Costs
Cutting down on monitoring expenses doesn't mean sacrificing performance. Here are some practical ways to optimize costs while maintaining efficiency:
| Service | Rate | Optimization Strategy |
|---|---|---|
| Log Management | $0.10 per GB ingested | Use log sampling and retention filters |
| Infrastructure Monitoring | $15 per host/month | Consolidate workloads onto fewer instances |
| APM | $31 per host/month | Opt for consumption-based pricing for ephemeral loads |
-
Optimize Log Collection
Use log retention filters and sampling in development or test environments to minimize unnecessary data ingestion. -
Manage Custom Metrics
Simplify your metrics by reducing high-cardinality tags and consolidating redundant data. Avoid sending instance-specific metrics unless absolutely necessary. -
Implement Smart Scheduling
For Kubernetes setups, increase pod density and integrate autoscalers like Karpenter. This fine-tunes node usage, reducing monitoring costs while keeping performance intact.
Conclusion: Next Steps for PaaS Monitoring
Now that you’ve established the basics of PaaS monitoring, the next step is to refine and improve. Start by automating tasks like resource scaling and service restarts during traffic surges or errors. This not only reduces downtime but also lessens the burden of manual intervention.
To get the most out of your monitoring efforts, concentrate on these critical areas:
| Focus Area | Action Items | Expected Outcome |
|---|---|---|
| Performance Tracking | Set and monitor service-level objectives (SLOs) | Improved service reliability |
| Cost Management | Optimize resource usage | Up to 30% reduction in costs |
| Security | Activate threat detection | Real-time insights into security risks |
These focus areas are the backbone of a dependable monitoring strategy.
Take it a step further by correlating metrics, logs, and traces for a complete view of your system. This approach speeds up root cause analysis and provides a clearer understanding of your PaaS environment’s overall health.
Leverage machine learning-powered tools like Watchdog to catch anomalies before they escalate into bigger issues. With access to over 850 partner-backed integrations, you can scale your monitoring capabilities as your infrastructure grows. Combine these tools with custom dashboards and alert rules to create a robust, all-encompassing monitoring strategy.
FAQs
How can I integrate Datadog with Vercel, Heroku, and Render, and what are the key setup steps for each platform?
Integrating Datadog with Vercel, Heroku, and Render requires specific steps tailored to each platform, ensuring your applications are effectively monitored. While the general approach involves connecting Datadog through APIs or environment variables, the details differ slightly depending on the platform:
- Vercel: Set up Datadog by configuring environment variables for your Datadog API key and enabling log forwarding. This allows Datadog to collect and analyze data from your Vercel projects.
- Heroku: Simplify the process by installing the Datadog add-on directly from the Heroku marketplace. This add-on automatically connects your Heroku app to Datadog, making setup straightforward.
- Render: Link Datadog to your Render service by adding the necessary environment variables and enabling metrics collection. This ensures Datadog can monitor and report on your application's performance.
After completing the integration, you’ll be able to track performance metrics, create custom dashboards, and set up alerts tailored to your application's specific needs. For detailed instructions, check Datadog's official documentation for each platform.
What are the most important metrics to monitor on PaaS platforms with Datadog, and why do they matter?
When you're using Datadog to keep an eye on PaaS platforms like Vercel, Heroku, or Render, it's crucial to zero in on the metrics that matter most for maintaining performance and efficient resource usage. Here are some key metrics to monitor:
- Request volume: This shows the number of incoming requests, giving you a clear picture of traffic trends and helping you spot sudden surges.
- Error rates: Tracks HTTP errors or failed requests, which can point to performance issues or application glitches.
- Function performance: Includes data like memory usage, execution time, and invocation counts for serverless functions - helping you fine-tune resource use and fix inefficiencies.
By keeping tabs on these metrics, you can not only resolve issues faster but also take steps to enhance your application's reliability and the overall user experience. Plus, Datadog’s log monitoring adds another layer of insight, offering real-time visibility into how your system is behaving.
How can businesses reduce monitoring costs with Datadog while maintaining performance and accuracy?
To lower monitoring expenses with Datadog while maintaining performance and accurate data, businesses can focus on a few key strategies. Begin by filtering out unneeded logs and refining metric cardinality to prevent unnecessary data collection. Adjust log retention policies to retain only the data that's critical for your operations.
Make thoughtful use of custom metrics, and employ tags or filters to simplify data collection processes. Enable trace sampling and use log patterns to reduce the volume of ingested data. It's also important to regularly review your Datadog configuration to pinpoint and disable components that aren't being used, ensuring you're not paying for unused features. Lastly, make the most of Datadog's anomaly detection and alerting tools to efficiently manage resources and keep costs optimized over time.

