How to Monitor API Rate Limits in Datadog
Learn how to effectively monitor API rate limits in Datadog to prevent disruptions, optimize usage, and enhance system reliability.
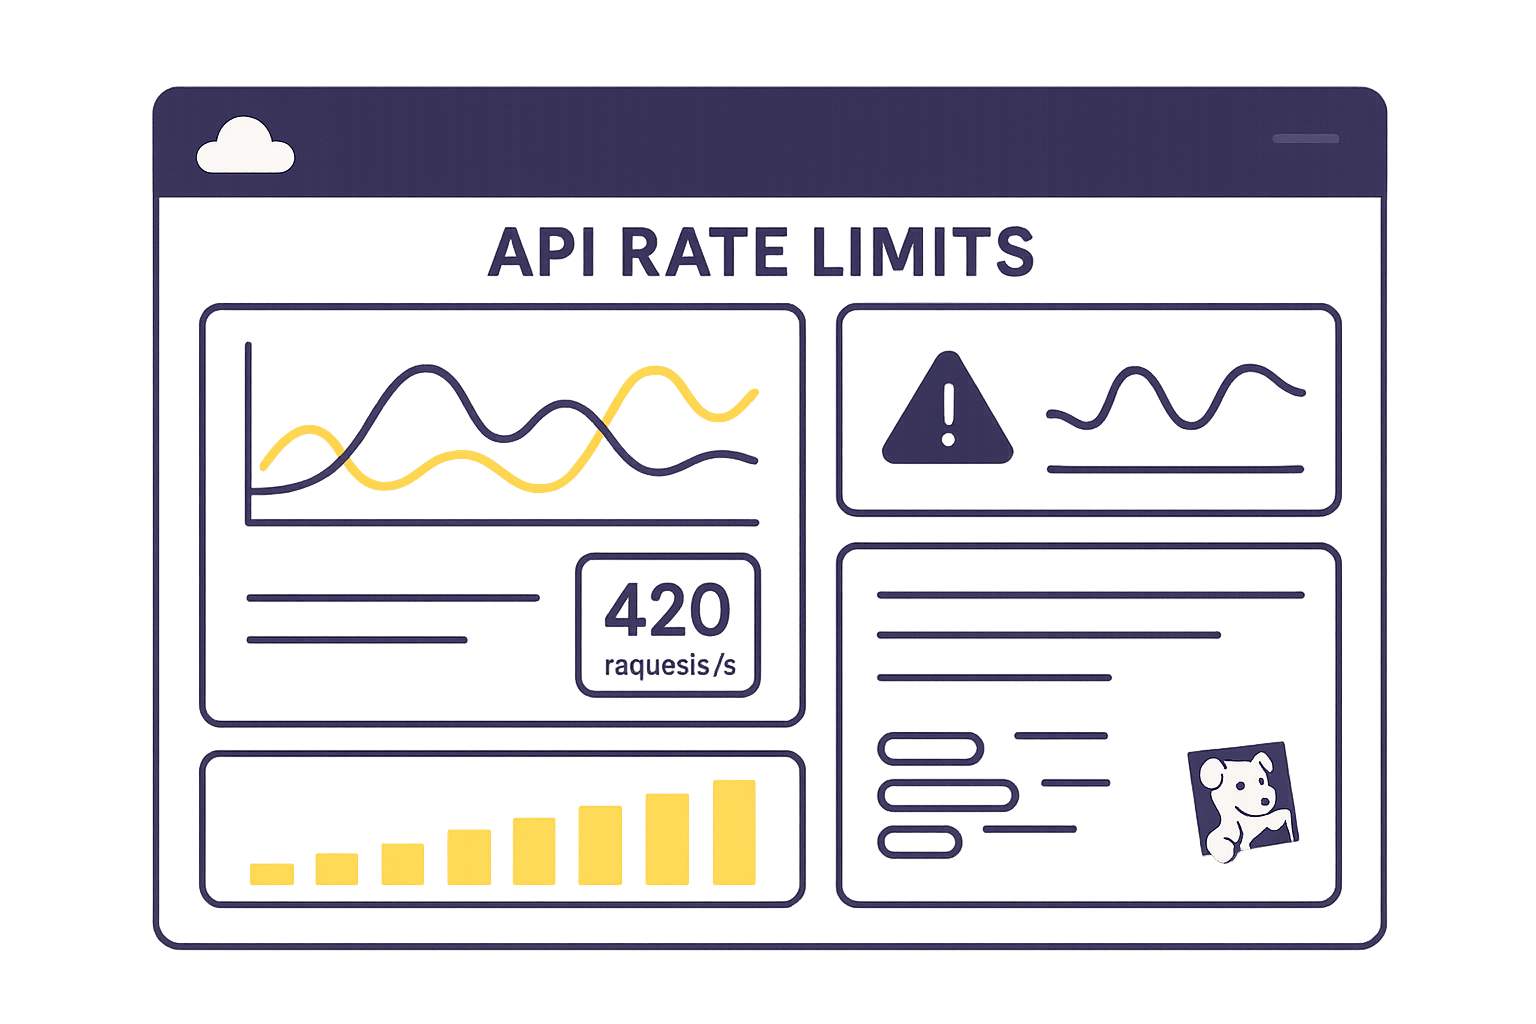
Monitoring API rate limits in Datadog is crucial to prevent disruptions and ensure smooth operations. Here's a quick overview of what you need to know:
Key Takeaways:
- API Rate Limits: Datadog enforces limits on API requests to prevent system overload. For example, the free tier allows 100 requests per minute, while the Pro tier allows 1,000 requests per minute.
- Common Errors: Exceeding these limits results in HTTP 429 Too Many Requests errors, which can disrupt monitoring during critical times.
- Metrics to Track: Use API response headers like
X-RateLimit-Limit,X-RateLimit-Remaining, andX-RateLimit-Resetto monitor your usage in real-time. - Optimization Tips: Reduce API calls by batching requests, caching data, and adjusting polling intervals.
- Dashboards and Alerts: Set up Datadog dashboards and alerts to visualize usage trends and get notified before hitting limits.
Why It Matters: Properly managing API usage helps avoid costly downtime, like the 2024 Salesforce outage, which caused estimated losses of $2.5 million per hour. By monitoring rate limits, you can ensure reliable integrations and faster issue resolution.
This guide will show you how to track, optimize, and visualize API rate limits in Datadog to keep your systems running smoothly.
Understanding API Rate Limits in Datadog
What Are API Rate Limits?
API rate limits control how many requests your applications can send to Datadog's servers within a set timeframe. This ensures no single organization overwhelms the system, keeping things running smoothly for everyone.
"API rate limiting involves using a mechanism to control the number of requests an API can handle in a certain time period. It's a key process for ensuring that APIs perform to a high level, provide a quality user experience, and protect the system from overload." – Kong
For small and medium-sized businesses (SMBs) running automated workflows, managing API usage is crucial. Dashboards, alerts, and custom integrations often share the same request allowance, so coordination is key.
Datadog applies different rate limits to various endpoints based on how resource-intensive they are. For instance:
- Metric retrieval is capped at 100 requests per hour per organization.
- Event submission allows up to 500,000 events per hour per organization.
These limits help avoid overloading systems, efficiently manage server resources, and prevent unexpected costs caused by sudden spikes in usage. Without these safeguards, your API infrastructure could face denial-of-service attacks, leaving your monitoring tools unavailable when you need them most.
Identifying Rate Limit Errors
If your applications exceed Datadog's rate limits, you'll encounter HTTP 429 "Too Many Requests" errors. Keeping an eye on these errors is essential to maintain uninterrupted service.
You can monitor real-time usage through response headers:
| Rate Limit Header | Description |
|---|---|
| X-RateLimit-Limit | Maximum requests allowed within the time period |
| X-RateLimit-Period | Time interval for the limit (in seconds) |
| X-RateLimit-Remaining | Requests still available in the current period |
| X-RateLimit-Reset | Time (in seconds) until the counter resets |
By tracking these headers, you can spot when you're nearing the limit and adjust your request frequency to avoid hitting a 429 error. If you do exceed the limit, reduce your request rate and plan accordingly.
For a deeper understanding, consult Datadog's API rate limit documentation to fine-tune your monitoring strategy.
Finding Datadog's Rate Limit Documentation
Datadog provides detailed documentation on API rate limits, which is invaluable for SMBs managing automated workflows. These resources explain endpoint-specific limitations, helping you plan effectively. For example:
- The Graph a Snapshot API is limited to 60 requests per hour per organization.
- The Log Configuration API allows 6,000 requests per minute per organization.
This clarity is critical for keeping monitoring workflows efficient and uninterrupted. If your needs grow, you can request higher limits by reaching out to Datadog support.
For organizations using the Datadog Cluster Agent, keep in mind that it aggregates up to 35 metrics per call, with calls made every 30 seconds by default. Understanding these details lets you estimate your API usage accurately and design a monitoring setup that scales with your business. Since rate limits are shared across your organization, it's important to coordinate API use across teams, prioritizing critical systems during high-traffic periods to avoid disruptions.
Extracting and Monitoring API Rate Limit Metrics
Getting Rate Limit Metrics from API Headers
Every API response comes with rate limit headers, which are critical to monitor. The key headers to watch include:
- X-RateLimit-Limit: Your maximum allowed requests.
- X-RateLimit-Remaining: The number of requests you have left.
- X-RateLimit-Reset: The time (in seconds) until your limit resets.
- X-RateLimit-Period: The duration of the rate limit window in seconds.
Here’s a Python example for handling rate limits with an exponential backoff strategy:
import requests
import time
import random

def make_api_request_with_backoff(url, headers, payload=None, max_retries=5):
    retries = 0
    while retries < max_retries:
        response = requests.post(url, headers=headers, json=payload) if payload else requests.get(url, headers=headers)
        if response.status_code == 429:  # Too Many Requests
            # Extract rate limit information
            limit = response.headers.get('X-RateLimit-Limit', 'Unknown')
            remaining = response.headers.get('X-RateLimit-Remaining', 'Unknown')
            reset = int(response.headers.get('X-RateLimit-Reset', 60))
            print(f"Rate limit hit: {remaining}/{limit} requests remaining. Reset in {reset} seconds.")
            # Calculate backoff time with jitter
            backoff_time = min(2 ** retries + random.uniform(0, 1), reset)
            print(f"Backing off for {backoff_time:.2f} seconds")
            time.sleep(backoff_time)
            retries += 1
        else:
            return response
    raise Exception(f"Failed after {max_retries} retries due to rate limiting")
This method ensures you avoid overloading Datadog's servers and automatically adjusts for temporary rate limit issues.
Displaying Rate Limit Metrics in Datadog
To monitor rate limit metrics effectively, send the extracted data to Datadog as custom metrics. This can be done using the Datadog API, the Datadog Agent, or DogStatsD.
A well-structured tagging system is essential. Include tags like the API endpoint, application name, and environment to make filtering and analysis straightforward.
"The Datadog API gives you the full picture, collecting metrics, logs, and traces in real time. This comprehensive view helps teams quickly spot issues, fix them, and make smarter decisions." - Adrian Machado, Engineer
For example, you can send metrics like api.rate_limit.remaining and api.rate_limit.limit to Datadog. Organizations that implement proper tagging report a 40% boost in operational efficiency, while teams using detailed dashboards experience a 50% improvement in situational awareness.
Once the metrics are visualized, you can analyze historical trends to better understand and optimize your API usage.
Tracking Usage Patterns and Bottlenecks
With visualized metrics in place, dive into historical rate limit data to identify usage patterns and prevent bottlenecks. Look for spikes in API activity across different times of the day, week, or month to better plan your requests.
Focus on endpoints with the highest traffic. Analyzing API usage trends helps ensure your infrastructure can handle peak loads. By understanding how your applications interact with Datadog's API, you can make smarter choices about when and how to send requests, including batching them more efficiently.
"API analytics reveal specific performance bottlenecks that developers can immediately address to improve response times. By transforming raw data into actionable insights, these tools help prioritize optimization efforts where they'll have the greatest impact, enabling faster identification of issues and more efficient resource allocation." - Adrian Machado, Engineer
Use historical data percentiles to establish normal operating ranges for alerting. This minimizes false alarms from temporary spikes while still catching real issues. Predictive anomaly detection algorithms applied to logs can identify up to 90% of potential failures before they occur.
Track key metrics like response times, error rates, and throughput alongside rate limit data. This broader perspective not only tells you when you're hitting limits but also helps uncover the root causes of usage patterns and their impact on overall performance.
Building Dashboards for API Rate Limit Monitoring
Once you've collected API rate limit metrics, the next step is to visualize and analyze them effectively. This is where Datadog dashboards come into play. A well-structured dashboard not only provides clarity but also ensures timely alerts, helping you make informed decisions about API usage.
Setting Up Custom Dashboards
To get started, navigate to Datadog's dashboard section and click "+ New Dashboard". Name it something descriptive like "API Rate Limit Monitoring" and choose a layout.
You’ll typically decide between two formats: Timeboards or Screenboards. For monitoring API rate limits, Timeboards are ideal since they excel at tracking metrics over time - such as remaining requests and reset intervals.
When building your dashboard, consider adding these widgets to visualize your data:
| Widget Type | Metric | Display Type | Title |
|---|---|---|---|
| timeseries | avg:api.rate_limit.remaining{*} | line | API Rate Limit Remaining Over Time |
| toplist | top(avg:api.rate_limit.usage{*}, 10, 'mean', 'desc') | N/A | Top 10 APIs by Rate Limit Usage |
| heatmap | avg:api.request.count{*} by {endpoint} | N/A | API Request Count by Endpoint |
For each widget, define queries based on your custom metrics and set appropriate time frames. For example, use a 1-hour window for real-time monitoring or a 24-hour window to identify trends. To make the data more intuitive, apply clear color coding - for instance, green for safe levels, yellow for warnings, and red for critical thresholds.
Gauge widgets are another useful addition. These can display rate limit utilization as percentages, providing a quick snapshot of how close you are to reaching your limits for specific API endpoints.
Once your widgets are ready, organize the layout to ensure important insights are easy to spot.
Organizing Data for Clarity
A clear dashboard layout is critical for effective monitoring. Start by grouping similar metrics together and placing the most critical widgets - like current rate limit status or error spikes - at the top.
Arrange your dashboard in a way that prioritizes key information. For instance, begin with an overview of API health, followed by detailed breakdowns for individual endpoints or services. Use annotations to note planned maintenance windows or known issues that could impact rate limits.
Dropdown filters are incredibly helpful for narrowing down your view. Set up filters for environments (e.g., production, staging, development), service names, or API endpoints. These allow team members to focus on specific areas without needing separate dashboards.
Take advantage of template variables like $environment and $service to make your dashboard dynamic. These variables let users filter the entire dashboard with a single selection, keeping the view clean and reducing the need for constant updates.
For a logical workflow, position real-time monitoring widgets in the top row, followed by historical trend analysis in the second row. More detailed breakdowns, such as endpoint-specific data, can go in subsequent rows. This structure mirrors common troubleshooting processes, ensuring that potential issues - like rate limit breaches - are immediately visible and actionable.
Regularly review and update your dashboard to reflect changes in your infrastructure or API usage patterns.
Lastly, make your dashboard accessible to all relevant team members. Use shared dashboards with proper permissions and include direct links in incident response documentation. This ensures everyone has quick access during outages or performance issues, streamlining your response process.
Setting Up Alerts for Rate Limit Thresholds
Automated API rate limit alerts help you respond quickly and avoid service disruptions. With Datadog's monitoring tools, you can catch potential issues early and keep your systems running smoothly.
Defining Alert Conditions
To set up effective alert conditions, you need to understand your API usage patterns and set thresholds that make sense for your system. Start by navigating to Monitors in your Datadog dashboard and selecting "+ New Monitor" to create a new alert.
Choose Metric as your monitor type since you'll be tracking numerical values like remaining API calls or usage percentages. For your metric query, use the custom metrics you've been collecting, such as avg:api.rate_limit.remaining{*} or avg:api.rate_limit.usage{*}.
A two-tier warning system can help you stay ahead of potential issues. For example, if your API allows 1,000 requests per hour, set a warning alert when you’ve used about 70% of your capacity and a critical alert at 85%. These thresholds give your team time to act before hitting the limit.
Adjust the evaluation window based on your traffic patterns to minimize false alarms without sacrificing responsiveness. Additionally, consider creating separate monitors for different API categories or services. This approach helps you identify specific issues and ensures alerts are sent to the right teams.
Once your thresholds are in place, configure notifications to keep your team informed and ready to respond.
Choosing Notification Channels
Datadog supports a variety of notification channels, so you can tailor alerts to your team's needs. Options include email, Slack, PagerDuty, and SMS, and you can configure them based on the severity of the alert.
For warning-level alerts, email is often sufficient. These alerts signal potential issues that require attention but aren’t urgent. Send these to your development team or API owners so they can monitor trends and optimize API usage.
Critical alerts demand immediate action. Slack notifications are ideal for teams actively monitoring during business hours, while PagerDuty or SMS is better for round-the-clock coverage of production systems. You can also set up escalation policies to ensure no alert goes unanswered. For example, during business hours, route alerts to Slack, and after hours, escalate them to PagerDuty or SMS.
With alerts and notifications configured, you can focus on fine-tuning your system to reduce noise and improve response times.
Best Practices for Effective Alerts
To maintain reliable monitoring without overwhelming your team, follow these best practices:
- Suppress alerts during maintenance or deployments: This prevents unnecessary notifications when API usage spikes temporarily.
- Use composite conditions: Instead of triggering an alert for every minor threshold breach, require the condition to persist for a set duration - like 3 consecutive minutes - before sending an alert.
- Filter alerts by tags: Tags such as
environment:production,service:payment-api, orteam:backendensure that alerts reach the right people and avoid waking up engineers for non-critical issues in test environments. - Set up alert dependencies: If your main API service goes down, suppress related rate limit alerts to avoid redundant notifications.
"Effective rate limiting ensures optimal performance, preventing system overloads and enhancing user experience." - Reginald Martyr, Marketing Manager
Regularly review and adjust your alert thresholds based on actual usage trends. As your application grows or patterns shift, refine these settings to stay effective.
Link runbooks to your alerts to provide clear, actionable steps for resolving rate limit issues. For example, include instructions for checking current usage, identifying high-traffic endpoints, and applying temporary rate limiting.
Finally, implement acknowledgment workflows so team members can take ownership of critical alerts. This ensures issues are resolved promptly, even during busy times. Use alert analytics to track false positives and fine-tune your thresholds. If warning alerts often don’t correlate with real problems, consider raising the threshold or extending the evaluation window. Also, set up recovery notifications to let your team know when usage returns to normal, closing the loop on incidents and confirming that your adjustments worked.
Optimizing API Usage to Prevent Rate Limit Breaches
After setting up monitoring and alerts, the next step is to fine-tune your API usage to stay within limits. By optimizing how you interact with APIs, you can maintain reliable service and keep costs in check. These strategies work hand-in-hand with monitoring to proactively reduce rate limit breaches.
Batching and Reducing API Calls
One of the simplest ways to cut down on API usage is batching. Instead of sending individual API requests for every operation, group multiple operations into one call. This reduces overhead and helps you stay comfortably within rate limits.
For example, if you need to update 50 user records, send a single batch request that handles all 50 updates instead of firing off 50 separate calls. Many APIs support batch operations that can process dozens - or even hundreds - of items in one go.
Another effective approach is caching frequently accessed data locally. By storing commonly requested information in memory or a local database, you can avoid sending duplicate requests. Refresh the cache only when necessary, especially for data that doesn’t change often, like user permissions or configuration settings.
Take a close look at your application logic to identify redundant requests. It’s not uncommon for different parts of your code to request the same data within a short time frame. Consolidating these requests or implementing a short-term cache can significantly reduce API usage.
Finally, use exponential backoff for retries when you hit rate limits. This technique introduces progressively longer pauses between retry attempts, helping to minimize unnecessary traffic.
For tools like Datadog, where API request caps are in place, managing these limits becomes critical. During high-demand periods, request queuing can help spread out API calls, ensuring smoother operations.
Adjusting Polling Intervals
Another way to cut API usage is by tweaking how often you collect data. Polling intervals should align with your specific needs and the nature of the metrics you're tracking. For critical metrics, frequent polling might make sense, but for more stable data, longer intervals can suffice.
Shorter polling intervals provide near real-time updates but can increase noise and trigger false alarms from temporary spikes. For instance, polling every 30 seconds might catch issues quickly but could also lead to unnecessary alerts. On the other hand, longer intervals reduce noise but might miss brief, critical events.
The ideal polling interval depends on how quickly your data changes and how much delay you can tolerate for alerts. For example, metrics like CPU usage, which fluctuate rapidly, might need updates every minute. In contrast, more stable metrics, like disk space, can be checked every 15 minutes.
A good starting point is a 5-minute polling interval. From there, you can adjust based on trends in your data. Striking the right balance between timely updates and resource efficiency is key - more frequent polling increases API calls, costs, and system load, both on your infrastructure and on platforms like Datadog.
Vendor documentation can also be a valuable resource. For example, Datadog provides specific recommendations on polling intervals for various integrations, helping you make informed adjustments.
Comparing Optimization Methods
To summarize, strategies like batching, caching, adjusting polling intervals, and implementing backoff logic all work together to reduce API call frequency.
These methods can lead to tangible improvements. For example, businesses that optimize their API usage report 37% fewer support tickets related to scheduling issues and higher employee satisfaction with digital tools. Moreover, well-optimized systems can achieve up to 99.99% API availability, avoiding the outages that often plague unprotected systems during peak usage.
Conclusion
Keeping track of API rate limits in Datadog is crucial for maintaining smooth operations and managing costs effectively. By building a strong monitoring system, you can fine-tune API usage and stay ahead of potential performance issues.
The process starts with gathering API response metrics and displaying them through custom dashboards. These dashboards help identify usage trends and pinpoint bottlenecks, allowing for quick and informed action. Setting up well-calibrated alerts ensures you're notified promptly when action is needed.
For small and medium-sized businesses (SMBs), this proactive approach prevents HTTP 429 errors, improves system efficiency, and ensures you're making the most of your Datadog investment. Combined, these practices create a reliable monitoring framework that supports both current needs and future growth.
The strategies we discussed - like batching API calls and tweaking polling intervals - work hand-in-hand with monitoring to reduce API overuse. These adjustments can significantly boost system reliability and performance.
Keep in mind that API endpoint limits can vary. Tailoring your thresholds to match these limits is essential for setting up effective alerts and planning API usage wisely. Understanding these specifics ensures you're prepared to manage your resources efficiently.
As your system evolves, the framework you've implemented will continue to deliver value. Regularly reviewing API usage patterns and leveraging dashboard insights will help you make smarter decisions about scaling infrastructure and refining workflows. This data-driven approach ensures your monitoring setup stays efficient and cost-conscious as your business grows.
For SMBs eager to get the most out of Datadog, resources like Scaling with Datadog for SMBs offer additional tips. The ultimate goal is to maintain a clear view of your API usage while staying flexible enough to adapt as your monitoring needs evolve.
FAQs
How do I set up alerts in Datadog to stay within API rate limits?
To prevent API rate limit breaches in Datadog, you can set up monitors to keep track of API usage and receive alerts before hitting the limits. By defining thresholds for API call volumes or error rates, you can establish alert conditions that notify you as usage nears critical levels. This allows you to act in advance and avoid potential issues.
For a clearer picture, consider building dashboards to observe API call patterns and error rates in real time. If necessary, you can automate actions to manage usage or reach out to support for a rate limit increase. Consistent monitoring helps you maintain smooth operations and avoid disruptions.
How can I monitor and manage API rate limits effectively in Datadog?
To keep API rate limits in check within Datadog, start by analyzing your API usage patterns to spot trends and potential problem areas. This will help you understand where adjustments might be needed. Consider setting up alerts to warn you when your usage nears the rate limit, so you can act before any issues arise.
You can also improve efficiency by batching requests to cut down on the total number of API calls. If you encounter rate limit errors, use exponential backoff for retries, and tweak your application's request frequency based on live usage data. Sharing clear information about rate limits with your team can further minimize unnecessary or excessive API calls.
By staying vigilant and using these strategies, you can maintain steady API performance and avoid disruptions caused by hitting rate limits.
How can I monitor and visualize API rate limit usage with Datadog dashboards?
To keep an eye on and visualize API rate limit usage in Datadog, start by building custom dashboards that focus on important metrics like API request volumes and error rates. These metrics are crucial for spotting when you're approaching rate limits or dealing with a spike in errors.
You should also configure alerts to notify your team if rate limits are about to be hit or if there's any unusual API activity. Incorporate real-time graphs and widgets into your dashboards to display these metrics clearly, making it easier to detect patterns or anomalies. Staying on top of your API usage helps you maintain system efficiency and avoid potential disruptions.

