How to Monitor Connection Pooling in Datadog
Learn how to effectively monitor database connection pooling with Datadog to optimize performance, prevent bottlenecks, and avoid costly downtime.
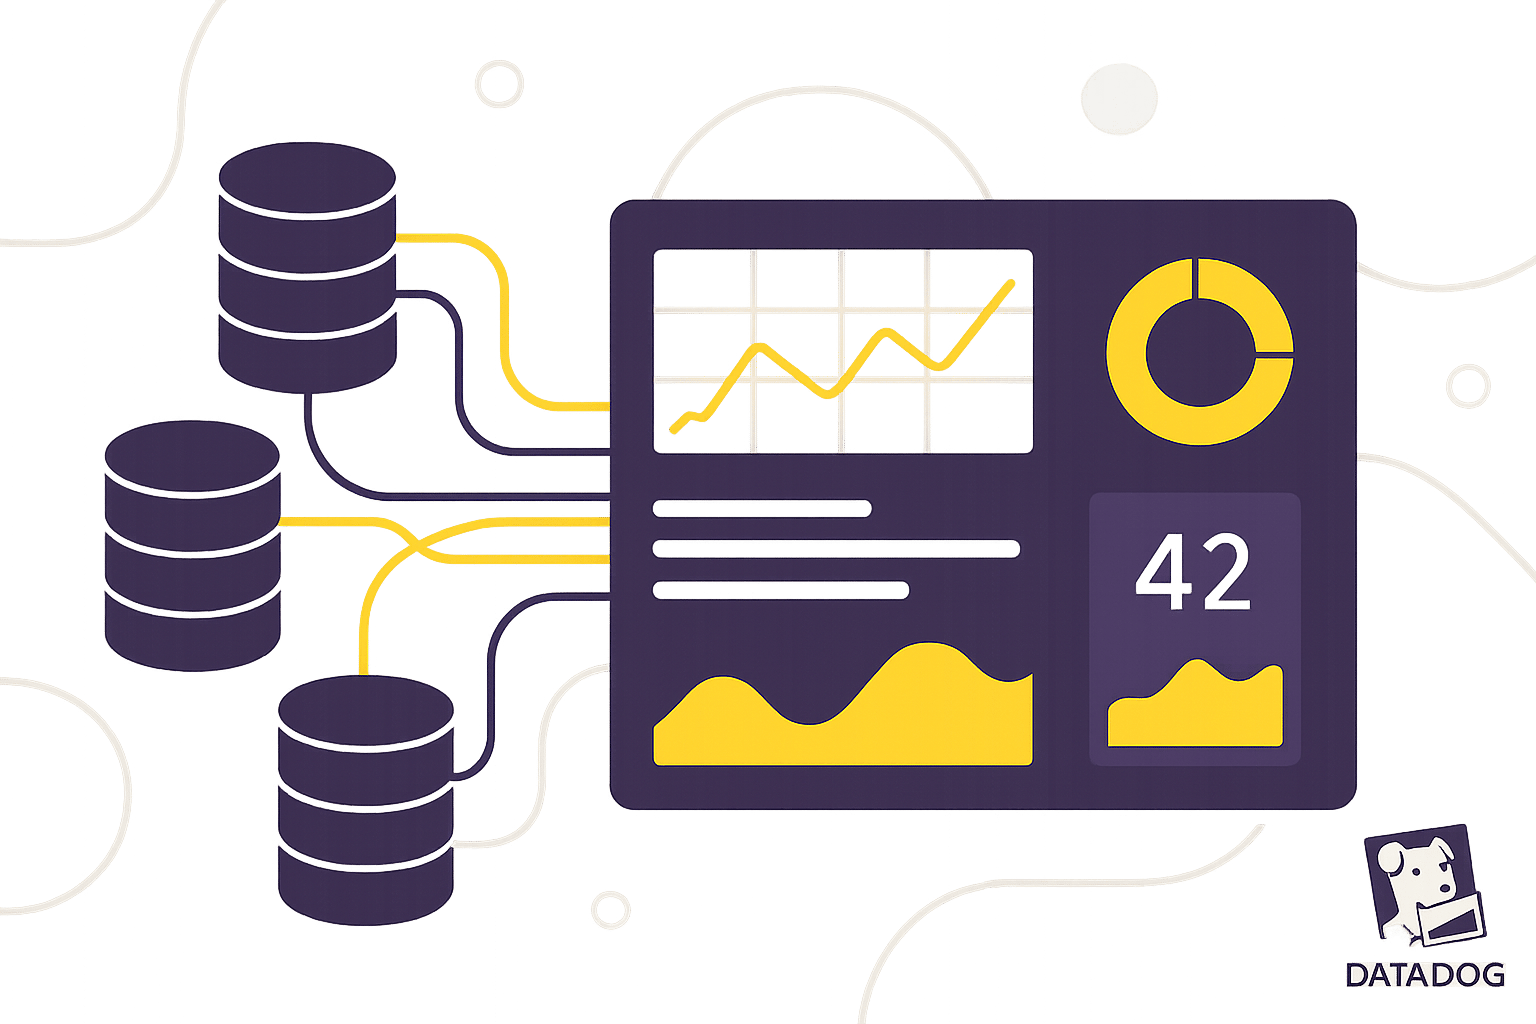
Database connection pooling boosts performance by reusing database connections, cutting latency, and reducing resource usage. But without monitoring, issues like connection leaks and pool exhaustion can disrupt your system. Datadog simplifies monitoring with tools like Network Performance Monitoring (NPM) and Universal Service Monitoring (USM), helping you track key metrics, prevent bottlenecks, and optimize performance.
Key Takeaways:
- Monitor these metrics: Active connections, idle connections, connection wait times, and errors.
- Set up alerts: Warn when pool usage hits 70–80% or wait times exceed 10 ms.
- Optimize settings: Adjust pool size, timeouts, and detect connection leaks using Datadog's dashboards and alerts.
- Use integrations: Datadog supports tools like HikariCP and PgBouncer for seamless connection pool monitoring.
Stay proactive by leveraging Datadog's insights to maintain smooth database performance and avoid costly downtime.
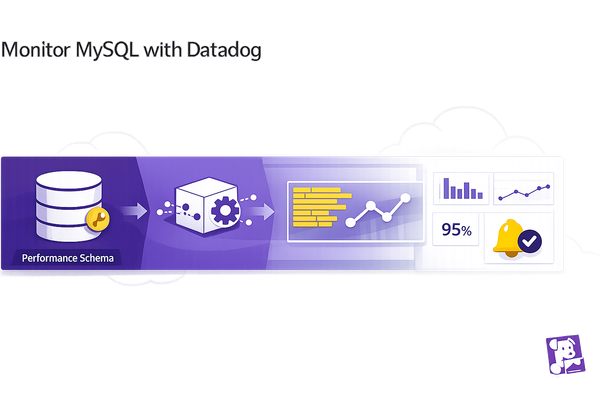
Datadog integration with MySQL
What is Database Connection Pooling
Database connection pooling is a method used to reuse existing database connections instead of creating a new one for every request. Think of it as a shared taxi service - connections are pre-established and reused as needed, saving time and resources.
Here’s how it works: your application maintains a pool of database connections. Some of these connections are active (handling current requests), while others are idle (ready to be used). When your application needs to execute a query, it borrows an available connection from the pool, uses it, and then returns it for future use. A pool manager oversees this process, allocating connections when available or creating new ones if needed - up to a set maximum. This system not only simplifies resource management but also sets the stage for the performance and efficiency benefits discussed below.
Benefits of Connection Pooling
Connection pooling delivers major performance and cost-saving benefits, especially for businesses with growing traffic demands. One key advantage is reduced memory usage. For instance, each new PostgreSQL connection can consume around 1.3MB of memory. In high-traffic scenarios, this can quickly add up. By reusing connections, the system minimizes this overhead, making better use of your existing hardware.
Applications that use connection pooling can perform up to 20 times faster compared to those that create a new connection for every request. This improvement comes from skipping the repetitive steps involved in establishing a connection, such as handshakes, authentication, and setup.
Another essential benefit is how pooling helps manage traffic spikes. Instead of overwhelming the database with hundreds of simultaneous connection requests - which could lead to crashes - the pool maintains a controlled number of active connections and queues additional requests. This ensures smoother performance during peak usage, enhancing the user experience while keeping operational costs in check.
Popular Connection Pooling Frameworks
There are several frameworks available to implement connection pooling, each offering specific features and metrics for monitoring.
For Java applications, HikariCP is a top choice. It’s known for its speed, simplicity, and dependability, and it’s the default connection pool for Spring Boot applications.
For PostgreSQL databases, PgBouncer is a lightweight, external connection pooler that acts as middleware between your application and the database. It’s designed to use minimal memory and supports three pooling modes:
- Session pooling: Maintains one connection per user session.
- Transaction pooling: Returns connections after each transaction.
- Statement pooling: Returns connections after each SQL statement.
These modes influence how you monitor performance and set up dashboards using tools like Datadog.
Other popular options in Java environments include Apache Commons DBCP2 and Tomcat JDBC, both of which offer various configuration and performance options. The choice between internal (application-level) and external (middleware) pooling also plays a role. External options like PgBouncer are often easier to manage, as they can pool connections for multiple client instances, providing a centralized monitoring point.
For those seeking additional features like replication, load balancing, and high availability, pgpool-II is another PostgreSQL option. While it offers more capabilities than PgBouncer, it does require higher memory resources. Each framework provides unique metrics that can be tracked to optimize performance and ensure smooth operation.
Setting Up Database Monitoring in Datadog
Once you've embraced the benefits of connection pooling, the next step is to monitor your database effectively using Datadog. This involves preparing Datadog, installing necessary components, setting up integrations, and ensuring everything is running smoothly.
What You Need Before Starting
To get started, ensure you have an active Datadog account with the right permissions for configuring integrations and accessing monitoring features.
You'll also need the Datadog Agent, which is responsible for collecting metrics from your database systems. This agent should be installed and running either on the same host as your database or on a host that can connect to your database server over the network. It acts as the bridge between your database and Datadog.
Make sure your database permissions and network access are properly configured. Each database system has specific requirements. For example:
- PostgreSQL: You'll typically need access to system tables and statistics views.
- MySQL: Access to performance schema tables is usually required.
Additionally, confirm that the Datadog Agent can reach your database server over the appropriate ports. For instance:
- PostgreSQL: Port 5432
- MySQL: Port 3306
Setting Up Database Integrations
Datadog offers tailored integrations for popular database systems, including PostgreSQL, MySQL, SQL Server, Oracle, Amazon DocumentDB, and MongoDB. Each integration has specific steps based on the database's structure and monitoring needs.
Here’s how to set up an integration:
- Start by creating a dedicated monitoring user with the necessary permissions in your database.
- Log in to the Datadog web interface, go to the Integrations section, and search for your database type.
- Use the configuration wizard to input details like hostname, port, database name, username, and password.
Pay close attention to the custom metrics section during setup. This is where you can define specific queries to collect metrics related to connection pooling that aren't included in the default metrics. For example, you might track:
- Active connections
- Idle connections
- Connection wait times specific to your pooling framework
You can also configure collection intervals. For monitoring connection pools, shorter intervals (like 15-30 seconds) are ideal during peak traffic to capture rapid changes in usage patterns.
Checking Your Setup
Once your integration is configured, the next step is to ensure metrics are being collected properly. Start by checking the Agent status to confirm it’s successfully communicating with your database.
If you’re using a containerized environment, you can debug the agent by running the command:
docker exec -it <CONTAINER_NAME> agent status
This will show the agent’s health and highlight any connection issues.
In the Datadog web interface, head to the Infrastructure List and locate your database host. A green status indicator confirms that the agent is reporting successfully. Clicking on the host will provide detailed information about the integrations running on that system.
Use the Metrics Explorer to verify that database metrics are being collected. Search for metrics like postgresql.connections.active or mysql.performance.threads_connected. If you see data points in the graphs, the integration is functioning as expected.
If you’ve enabled database log collection, check the Logs section for additional insights. Logs can be especially helpful for understanding connection pool behavior, such as errors pointing to connection timeouts or pool exhaustion.
For connection pool-specific metrics, look for metrics tied to your pooling framework:
- HikariCP: Metrics like
hikaricp.connections.active - PgBouncer: Metrics such as
pgbouncer.pools.cl_active(active client connections)
If you notice missing metrics, review the Agent logs for error messages. Common issues include incorrect database credentials, network connectivity problems, or insufficient permissions. The logs often provide detailed error messages to help pinpoint the problem.
Once everything is verified, you’re ready to start tracking connection pool usage in Datadog.
Tracking Connection Pool Metrics in Datadog
With your database monitoring in place, it’s time to zero in on the metrics that reveal how your connection pool is performing. Keeping an eye on these metrics ensures you can spot problems early and tweak settings before they affect your users.
Key Connection Pool Metrics
One of the most important metrics to monitor is active connections - the number of connections your applications are currently using. This metric gives you a clear picture of how much of your pool is being utilized. Keep an eye on it as both an absolute number and as a percentage of your pool's maximum capacity. If active connections creep up to 70–80% of that limit, it’s a red flag to investigate bottlenecks or consider increasing the pool size.
Idle connections, on the other hand, are open connections not currently handling requests. While some idle connections are normal and help with performance, sudden spikes might indicate connection leaks or inefficient management.
Connection wait times measure how long it takes for an application to grab a connection from the pool. Ideally, this should stay under 10 ms for deployments in the same region. If wait times consistently exceed this, it might mean your pool size isn’t keeping up with demand or connections are being held for too long.
Maximum connections reached is another key metric. This happens when the pool hits its configured limit, which can lead to applications failing to connect. Monitoring this helps you avoid a complete connection freeze.
Finally, connection errors - failed attempts, timeouts, or authentication issues - should be tracked. Establish a baseline for what’s normal so you can quickly detect any unusual spikes.
| Metric Type | What It Measures | Healthy Range | Warning Signs |
|---|---|---|---|
| Active Connections | Connections currently in use | Well below 70–80% of maximum | Approaching or exceeding 70–80% of maximum |
| Idle Connections | Open but unused connections | Some idle connections are normal | Sudden spikes may indicate connection issues |
| Connection Wait Time | Time to acquire a connection | Under 10 ms | Consistently longer wait times |
| Connection Errors | Failed connection attempts and timeouts | Consistent with baseline rates | Sustained increase above the baseline |
Once you understand these metrics, the next step is to configure Datadog to start collecting them.
Setting Up Metrics Collection
Datadog simplifies connection pool monitoring by offering built-in integrations for popular frameworks.
For HikariCP, a widely-used Java connection pool, Datadog can automatically collect metrics like hikaricp.connections.active, hikaricp.connections.idle, and hikaricp.connections.pending. To enable these metrics, ensure your application exposes JMX metrics and configure the Datadog Agent with JMX integration. Add the HikariCP configuration to the Agent’s conf.d/jmx.d/conf.yaml file, specifying the correct MBean patterns.
For PgBouncer, a PostgreSQL connection pooler, Datadog captures metrics such as pgbouncer.pools.cl_active (active client connections) and pgbouncer.pools.sv_active (active server connections). To enable this, configure the Datadog Agent to connect to PgBouncer’s admin interface, which typically runs on port 6432.
If the default metrics don’t cover your needs, you can define custom queries against your application’s metrics endpoint or database system tables to track pool-specific stats.
Datadog's Network Performance Monitoring (NPM) and Universal Service Monitoring (USM) tools add another layer of insight. Using eBPF, they monitor kernel events without requiring app changes, helping you track connection churn, TCP socket latency, and pinpoint network-related connection issues.
When setting up collection intervals, adjust based on traffic patterns. Shorter intervals (15–30 seconds) are ideal during high-traffic periods to capture rapid changes, while longer intervals work during stable times.
With your metrics flowing into Datadog, you can move on to building dashboards that make your connection pool health easy to monitor.
Creating Connection Pool Dashboards
A well-organized dashboard is essential for understanding your connection pool’s health at a glance. Start with a high-level overview that highlights critical metrics across all your pools.
Use time series graphs to display trends in active and idle connections. Differentiate these metrics with colors and include horizontal reference lines to mark your maximum capacity and warning thresholds.
Gauge widgets can be helpful for showing current utilization, with color zones to indicate warning and critical levels based on your pool’s configuration.
Heatmaps are another useful tool, especially for visualizing connection wait times over time. They can reveal patterns or specific periods when delays spike.
To understand the broader impact of connection pool usage, include query performance metrics alongside pool data. Track execution times by query type and monitor cache hit rates. For OLTP workloads, aim for a cache hit rate of 99% or higher, while 90%+ is generally acceptable for read-heavy analytical tasks.
Overlaying events like database updates, application releases, or infrastructure changes on your graphs can help you connect performance shifts to specific actions.
Consider creating separate dashboards for each major service or application using connection pooling. This allows teams to focus on the metrics most relevant to their systems while still keeping an eye on overall database health.
For troubleshooting, build detailed diagnostic dashboards that include metrics like connection error rates, lock wait times, and storage I/O stats. For example, keep in mind that database performance can degrade if average I/O latency exceeds 10 ms for SSDs or 20 ms for HDDs. These detailed views can help you quickly pinpoint and resolve connection pool issues.
Creating Alerts for Connection Pool Problems
Setting up alerts is a smart way to catch connection pool issues before they spiral out of control and disrupt your applications. The goal is to strike a balance - alerts should give you enough time to act without drowning your team in unnecessary notifications.
Examples of Alert Configurations
Here’s how you can configure some key alerts to keep tabs on your connection pool:
- Pool utilization alerts: Set a warning when active connections hit 70% of the maximum, and a critical alert at 85%.
- Wait time alerts: Trigger a warning at 50 ms and a critical alert at 100 ms.
- Connection error monitoring: First, establish a baseline for error rates during normal operations. Then alert your team if errors spike 50% above the baseline within a 5-minute window.
- Pool exhaustion alerts: These should activate immediately if the pool hits its maximum capacity or if applications start receiving "connection unavailable" errors.
- TCP latency and churn: Alert when TCP latency exceeds certain thresholds, as this could signal resource exhaustion caused by rapid connection cycling. Similarly, monitor connection churn (the rate of opening and closing TCP connections), as it can strain CPU resources and slow down new connection requests.
A postmortem from March 16, 2025, revealed a web application suffered HTTP 500 errors for 80% of users due to database connection pool exhaustion. The issue stemmed from a misconfigured ORM framework, where the connection pool limit was set to 150 instead of 300. The immediate fix involved increasing the limit to 300 and restarting the database.
These foundational alerts are a great starting point, but you can enhance them with trend-based monitoring for even earlier detection.
Early Warning Systems
Early warnings are all about catching issues before they reach critical levels. Trend-based alerts are particularly useful here. For example, configure alerts to trigger if connection pool usage shows a steady increase over 15–30 minutes, even if it hasn’t yet hit dangerous thresholds. This can help you spot resource leaks or increasing traffic loads early.
To minimize false positives, combine multiple metrics into composite alerts. For instance, only trigger a high-severity alert if connection wait times exceed 100 ms and active connections surpass 80% of capacity. This ensures alerts point to real problems rather than temporary fluctuations.
Keep an eye on database-specific metrics alongside your pool metrics. For example:
- Track
Threads_connectedto avoid hitting the "Too many connections" error by ensuring it stays below your configuredmax_connectionslimit. - Monitor
Aborted_connectsto identify failed connection attempts, and dig deeper into metrics likeConnection_errors_max_connectionsandConnection_errors_internalto pinpoint the root cause.
Escalation and Automation
Establish clear escalation policies to ensure timely responses. Start by notifying the on-call engineer, and escalate the alert if it isn’t acknowledged quickly. Use multiple notification channels - like email, SMS, or Slack - to make sure critical alerts reach the right people.
Automated responses can also help mitigate issues immediately. For example, you can set up auto-scaling rules to temporarily increase connection pool sizes when utilization alerts are triggered. This buys you time to investigate the root cause while keeping your services running.
Fine-Tuning Alerts
Adjust your alert thresholds based on traffic patterns. During peak hours, you might need more sensitive thresholds since problems can escalate faster. During quieter periods, slightly more lenient thresholds can reduce noise while still catching real issues.
Adding health checks is another proactive step. Monitor the overall health of your data pipeline, including metrics like throughput, processing latency, and error rates. Establishing baselines for these metrics will help you detect spikes that could signal bottlenecks before they start affecting your connection pools.
Improving Connection Pool Settings with Datadog Data
Once you've set up reliable monitoring and alerting, the next step is using that data to fine-tune your connection pool settings. The metrics you collect reveal how your applications interact with the database, and understanding these patterns enables smarter pool configuration decisions.
Tuning Pool Size and Timeouts
Datadog metrics are key to adjusting pool size and timeout settings effectively. Instead of reacting to isolated spikes, focus on long-term trends in your data to guide changes.
Start by analyzing connection utilization patterns. A properly configured pool reduces the need to open new connections during API requests, which can save valuable time since establishing connections may take milliseconds - or even seconds.
"Doing connection pooling allows us to keep and reuse already open connections for other requests. Open once, query multiple times." - Kévin Maschtaler
Optimizing pool size becomes easier when you examine traffic behavior. Use Datadog's dashboards to spot connection churn during peak times and adjust your settings accordingly. Here are some key metrics to watch:
- Frequent connection recycling: If connections are frequently opened and closed, your pool might be too small for high-demand periods.
- Maxed-out pools: If active connections regularly hit the maximum limit, increasing the pool size may be necessary.
- Excess idle connections: Too many unused connections sitting idle for long periods could indicate over-provisioning.
When it comes to timeout settings, pay close attention to TCP socket latency metrics. High latency paired with mismatched established and closed connections often signals timeout misconfigurations. If your logs show frequent timeouts, it’s worth revisiting your connection acquisition timeout settings.
You might also consider increasing the idle timeout duration to maintain connections for longer, but be mindful of resource usage. The knex documentation, for instance, suggests setting min: 0 to allow all idle connections to terminate, stating that "the default value of min is 2 only for historical reasons. It can result in problems with stale connections".
Another useful technique is background connection pool warmup, which prepares connections in advance to handle sudden traffic spikes. This minimizes the latency caused by creating new connections during high-demand periods.
Lastly, ensure the combined maximum connections across all database consumers don’t exceed your database's capacity. Use Datadog's database monitoring alongside connection pool metrics to avoid overwhelming your database server.
With these adjustments in place, you can turn your attention to another critical area - connection leaks.
Finding and Fixing Connection Leaks
After fine-tuning pool size and timeouts, it’s vital to address connection leaks, as they can degrade performance over time and even lead to service failures. Datadog’s monitoring tools make it much easier to detect and resolve these issues early.
Spotting leak patterns begins with monitoring memory usage trends. Look for gradual memory increases that don’t align with traffic growth or legitimate usage. A steady rise in active connections without a corresponding drop in idle connections often points to a leak.
Datadog’s Network Performance Monitoring (NPM) and Universal Service Monitoring (USM) tools are particularly helpful here. Using eBPF technology, they track kernel-level events like network traffic without requiring changes to your application. NPM provides insights into established and closed connections, latency, round-trip times, and error rates.
For more precise memory leak detection, combine Datadog's continuous profiler with connection pool metrics. The profiler highlights resource-heavy parts of your code, while connection metrics indicate whether database connections are contributing to the issue.
Set up automated leak detection alerts to notify you of sustained increases in active connections over 15-30 minutes, especially when traffic levels don’t justify the growth. These alerts can give you a heads-up before leaks escalate into outages.
Fixing leaks depends on their root cause. Common culprits include unbounded resource creation, long-lived references, and improper cleanup of database connections. Use connection timeouts and review logs for errors related to unreleased connections or timeouts.
Implement connection validation mechanisms to automatically close or reclaim idle or unresponsive connections. This ensures small leaks don’t snowball into major problems.
In the meantime, load balancing and throttling can help manage the impact of leaks. Distribute database load across multiple pools and throttle incoming requests during peak times to prevent pool exhaustion.
Leverage Datadog’s metrics to establish baselines for normal connection behavior, and use anomaly detection to flag unusual patterns. Combining proactive monitoring with automated responses gives you the best chance of catching and resolving leaks before they affect your users. These adjustments are part of an ongoing effort to maintain smooth database performance.
Conclusion
Effective connection pool monitoring relies on the strategies we’ve discussed. Datadog’s monitoring tools take performance management to the next level by shifting from a reactive approach to a proactive one. With integrated setups, dashboards, and alerts, you can stay ahead of potential issues and fine-tune your connection pools for optimal performance.
According to Datadog's documentation, high connection churn often signals an unhealthy distributed system. Managing connections comes with CPU and memory costs, which can directly impact overall system performance.
For small and medium-sized businesses (SMBs) with limited resources, proactive monitoring can lead to faster transactions and better cost management. Applications using well-monitored connection pools can see transaction speeds improve by up to five times, especially in multi-cloud setups.
The steps outlined here - tracking active and closed connections, identifying leaks, and more - offer the visibility needed to address performance issues before they affect users. Datadog’s Network Performance Monitoring (NPM) and Universal Service Monitoring (USM) leverage eBPF technology to gather kernel-level metrics, simplifying the process and delivering deeper insights. This allows for precise adjustments that keep your system running smoothly.
However, monitoring is only useful if it drives action. Use the metrics you collect to adjust pool sizes, tweak timeouts, and identify services causing unexpected connection churn. Set alerts for critical indicators like high TCP socket latency or request bottlenecks, and act on them with targeted optimizations.
FAQs
How do I detect and resolve database connection leaks with Datadog?
When it comes to spotting and fixing database connection leaks with Datadog, the Database Monitoring feature is your go-to tool. It tracks essential metrics like active, idle, and pending connections, giving you a clear picture of your connection pool's health. This makes it easier to identify problems like timeouts or too many idle connections.
If your application uses connection pooling tools like HikariCP or PgBouncer, Datadog's integration checks can monitor their performance. These checks help uncover irregularities in how your connection pool operates. And if you suspect memory leaks might be tied to the issue, Datadog’s Continuous Profiler can analyze memory usage patterns and link them to connection behavior, helping you zero in on the root cause.
With these Datadog features, you can stay ahead of potential connection issues and address leaks before they start affecting your app’s performance.
How can I set effective alert thresholds to monitor connection pool usage in Datadog?
To set up alert thresholds for monitoring connection pool usage in Datadog, start by examining historical data to establish a baseline for what "normal" looks like. This step helps you spot unusual patterns, like sudden spikes in active connections or extended wait times.
Whenever possible, take advantage of dynamic thresholds using Datadog's anomaly detection tools. These thresholds adjust automatically to real-time changes, ensuring alerts are only triggered when there are meaningful deviations. Pay close attention to critical metrics such as active connections, wait times, and churn rates to identify potential bottlenecks or resource constraints.
Make it a habit to periodically revisit and adjust your thresholds as your application demands and database performance change. This ongoing refinement keeps your alerts accurate and ensures your database runs smoothly, minimizing the risk of downtime.
How do Datadog's Network and Service Monitoring tools improve connection pool performance?
Datadog's Network Performance Monitoring (NPM) and Universal Service Monitoring (USM) work hand in hand to deliver valuable insights into your connection pool performance, ensuring your applications stay efficient and reliable.
With NPM, you can track essential network metrics like connection churn and latency. This makes it easier to pinpoint bottlenecks or slowdowns that might disrupt your database connections. By addressing issues such as connection failures or resource limitations early, you can prevent performance hiccups before they escalate.
USM takes it a step further by automatically identifying services across your infrastructure and monitoring how they interact. It provides key connection metrics - like active, idle, and pending connections - so you can fine-tune connection pool usage and maintain seamless availability. Together, these tools give you the visibility and control needed to stay ahead of connection pool challenges.

