How to Monitor Fly.io Apps with Datadog Using Sidecar or API Integration
Learn how to efficiently monitor your applications with Datadog using sidecar deployment or API integration on Fly.io.
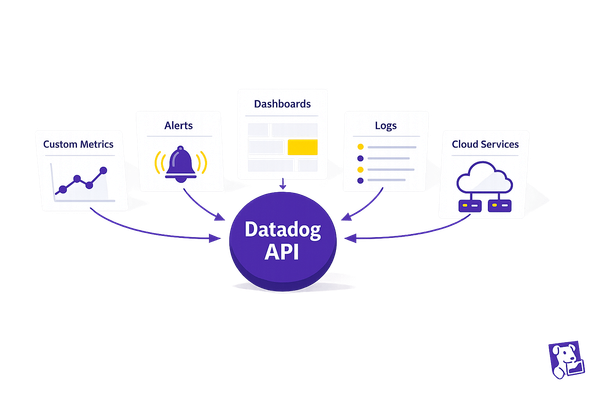
Want to monitor your Fly.io apps efficiently? Here’s how you can use Datadog to track performance, resource usage, and error rates with two integration methods: sidecar deployment or API integration. Both approaches help you stay on top of your app’s health and performance across Fly.io’s 35 global regions.
Key Takeaways:
- Sidecar Deployment: Run the Datadog agent as a sidecar container for detailed system metrics like CPU, memory, and logs.
- API Integration: Use Datadog’s APIs and SDKs for lightweight monitoring, perfect for apps with limited resources.
What You’ll Need:
- Credentials: Datadog API key, Fly.io token, and environment variables.
- Tools: Docker, Fly.io CLI, and Datadog SDK (for API integration).
- Configuration: Secure API key storage, network security rules, and optimized data settings.
Quick Comparison:
| Method | Best For | Setup Complexity | Resource Usage |
|---|---|---|---|
| Sidecar Deployment | Detailed system metrics | Moderate | Higher |
| API Integration | Lightweight apps, custom metrics | Simple | Lower |
This guide covers step-by-step instructions for both methods, including setup, configuration, and troubleshooting tips. Let’s dive in!
How to register for Datadog - Monitoring as a service & install agents on Windows and Linux machines
Setup Requirements
To integrate Datadog with your Fly.io applications, you'll need to prepare the necessary accounts, credentials, and technical components.
Required Accounts
You'll need active accounts on both Fly.io and Datadog, each with the appropriate permissions:
| Platform | Required Access Level | Key Permissions |
|---|---|---|
| Fly.io | Standard Account | App deployment, container management |
| Datadog | Administrative/Integration Access | API key generation, agent configuration |
Make sure your Datadog account has administrative or integration access, and your Fly.io account supports app deployment and container management tasks.
Setup Checklist
Before proceeding, confirm that you have the following credentials and technical prerequisites ready.
Required Credentials
- Datadog API key
- Datadog application key (for API integration)
- Fly.io authentication token
- Datadog site URL (commonly
datadoghq.com)
Technical Prerequisites
- Docker (v19.03 or later) installed locally
- Fly.io CLI (
flyctl) installed and configured - A basic understanding of container orchestration
- Access to a code repository for managing deployments
Environment Configuration
- Ensure secure and uninterrupted access to Datadog's ingestion endpoints.
- Enable HTTPS for communication.
- Prepare environment variables to securely store sensitive data.
For enhanced security, use Fly.io's secret management system to store API keys instead of embedding them in your code. This reduces the risk of exposing sensitive information and simplifies credential updates.
Additionally, configure your network to allow secure communication between your Fly.io applications and Datadog's endpoints. Validate your environment variables by setting and testing them with the following example:
DD_API_KEY=<your_api_key>
DD_SITE=datadoghq.com
DD_ENV=production
DD_SERVICE=<your_service_name>
These settings are essential for both sidecar and API integration methods, ensuring your monitoring setup can effectively collect and transmit performance data.
Sidecar Setup Guide
Deploy the Datadog Agent as a sidecar to monitor your Fly.io application. With Fly.io's Docker support, you can run the Datadog Agent alongside your app to maintain clear separation between your application and monitoring services. Follow these steps to configure and deploy your sidecar container.
Sidecar Container Setup
Begin by updating your Fly.io configuration file (fly.toml) to enable a multi-container setup. Here's an example configuration:
[[services]]
  internal_port = 8126
  protocol = "tcp"
  [services.ports]
    handlers = ["http"]
    port = 8126
You can modify this example to fit your specific application requirements. Keep in mind that Fly Machines can scale down to zero when idle, so configure accordingly.
Datadog Agent Configuration
To set up the Datadog Agent, use the official Docker image and define the necessary environment variables:
FROM datadog/agent:latest

ENV DD_APM_ENABLED=true
ENV DD_LOGS_ENABLED=true
ENV DD_PROCESS_AGENT_ENABLED=true
ENV DD_SYSTEM_PROBE_ENABLED=true

COPY datadog.yaml /etc/datadog-agent/datadog.yaml
Next, customize the datadog.yaml file to enable essential monitoring features:
# datadog.yaml
apm_config:
  enabled: true
  apm_non_local_traffic: true

logs_config:
  container_collect_all: true

process_config:
  enabled: true
This configuration ensures that APM, logs, and process monitoring are active, providing a thorough view of your application's performance.
Network Security
For secure communication, configure your firewall with the following rules:
- Allow internal access only on port 8126 for APM traffic.
- Restrict port 8125 to internal use for StatsD metrics.
- Ensure port 443 is open for secure external communication with Datadog.
You can adjust these settings based on your application's needs. For more details, refer to Fly.io's documentation on firewall configuration.
API Setup Guide
Integrating an API allows Fly.io apps to be monitored without using a sidecar container. This approach is perfect for lightweight applications or when you need more control. It works alongside sidecar monitoring, providing a streamlined alternative.
Code Integration Steps
Start by installing the correct Datadog SDK.
For Node.js, use the following setup:
// Install the package
npm install dd-trace --save

// Initialize at the entry point
const tracer = require('dd-trace').init({
  service: 'your-fly-app-name',
  env: 'production',
  url: 'https://http-intake.logs.datadoghq.com/api/v2/logs',
  apiKey: process.env.DD_API_KEY
});

// Add custom metrics
const { metrics } = require('dd-trace');
metrics.gauge('app.performance', value, ['region:us-east']);
For Python, you can track metrics like this:
from datadog import statsd

# Track response times
statsd.histogram('fly_app.response_time', response_time,
                 tags=['endpoint:/checkout'])

# Monitor active connections
statsd.gauge('fly_app.database_connections', active_connections,
            tags=['database:postgres'])
Once the code is integrated, make sure your API keys are securely stored to protect credentials and maintain integration reliability.
API Key Management
To secure your API keys, use Fly.io's CLI:
- Store keys using:
flyctl secrets set DD_API_KEY=your_datadog_api_key - Rotate keys every 90 days with:
flyctl secrets unset/set - Use separate configuration files for environment-specific keys.
With the keys secured, you can proceed to optimize your data transfer settings.
Data Transfer Settings
For efficient monitoring, fine-tune your API's data transfer settings. Here's an example for Node.js:
const tracer = require('dd-trace').init({
  sampleRate: 0.5,        // Sample 50% of traces
  bufferSize: 10000,      // Local trace buffer size
  flushMinSpans: 1000,    // Minimum spans before flush
  compression_level: 6    // GZIP compression (0-9)
});
You can also apply resource-based rate limits in Go:
tracer.Start(
  tracer.WithResourceUlimits(
    tracer.ResourceUlimits{
      CPULimit: 0.5,                // 50% CPU cap
      MemoryLimit: 100 * 1024 * 1024, // 100MB memory limit
    },
  ),
)
Here’s a quick overview of data transfer settings to consider:
| Data Type | Batch Size | Flush Interval | Compression |
|---|---|---|---|
| Metrics | 100 points | 10 seconds | Enabled (level 6) |
| Traces | 1000 spans | 5 seconds | Enabled (level 6) |
| Logs | 100 entries | 30 seconds | Enabled (level 6) |
These settings help ensure your monitoring process is both efficient and resource-conscious.
Common Issues and Fixes
Once your setup is configured, it's a good idea to prepare for troubleshooting some common challenges.
Sidecar Issues
If you're encountering sidecar-related problems, here are some steps to address them:
# Create a dedicated Datadog Agent app
flyctl launch --name dd-agent-app

# Set required environment variables
flyctl secrets set DD_API_KEY=your_api_key
flyctl secrets set DD_SITE="datadoghq.com"
flyctl secrets set DD_APM_NON_LOCAL_TRAFFIC=true
For resource management, ensure your VM allocation is sufficient. Here's an example configuration:
# fly.toml
[processes]
app = "./run.sh"
  [processes.resources]
    memory = 512
    cpu = 1
This setup helps prevent memory or CPU shortages from disrupting your application.
API Connection Problems
API issues, such as metric delays, authentication errors, and connection timeouts, are fairly common. Here’s a quick reference to troubleshoot these problems:
| Issue | Cause | Solution |
|---|---|---|
| Metric Delays | Rate limiting | Use exponential backoff |
| Authentication Failures | Expired API keys | Rotate keys on a regular basis |
| Connection Timeouts | Network constraints | Adjust timeout settings |
To keep an eye on API health, you can integrate error tracking into your application:
const dd = require('dd-trace');
dd.tracer.init({
  analytics: true,
  errorHandler: (error) => {
    console.error(`API Connection Error: ${error.message}`);
    // Apply retry logic here
  }
});
Once these connectivity issues are under control, you can refine your dashboards to provide more actionable insights.
Dashboard Setup Tips
A well-organized dashboard is key to effective monitoring. Focus on critical metrics and set clear alert thresholds. For instance:
# dashboard.yaml
templates:
  - name: "Fly.io App Performance"
    widgets:
      - title: "Error Rate"
        query: "sum:trace.errors{service:fly-app} / sum:trace.requests{service:fly-app}"
        alert:
          threshold: 0.05
          window: "5m"
Additionally, you can enhance log categorization by configuring source attribution in your Vector setup:
[transforms.add_metadata]
type = "remap"
inputs = ["source"]
source = '''
  .source = get_env_var("FLY_APP_NAME") ?? "undefined"
'''
This approach ensures your logs are properly categorized, making it easier to troubleshoot issues across your Fly.io applications efficiently.
Setup Checklist and Tips
To ensure a smooth and thorough setup, use this checklist and these tips to avoid missing any critical steps. Keeping dedicated applications for monitoring will help maintain system performance and reliability.
Start by configuring your Datadog Agent with the necessary environment variables:
# fly.toml for Datadog Agent
[env]
  DD_SITE = "datadoghq.com"
  DD_APM_NON_LOCAL_TRAFFIC = "true"
When setting up log forwarding, make sure to assign a valid source identifier. This helps prevent undefined source issues:
[transforms.metadata]
type = "remap"
inputs = ["source"]
source = '''
  .app_name = get_env_var("FLY_APP_NAME")
  .environment = get_env_var("FLY_ENVIRONMENT", "production")
'''
Once you've configured your logs and metadata, go through the following checklist to verify everything is working correctly:
| Component | Verification Step | Common Issue |
|---|---|---|
| Agent Deployment | Check agent status in Fly.io dashboard | Misconfigured agent settings |
| Log Forwarding | Verify logs appear with correct source | Missing app name attribution |
| API Integration | Test metric submission rates | Rate limiting exceeded |
| Security | Confirm API keys in Fly.io secrets | Exposed credentials in configs |
For optimal setup, keep separate applications for your primary service, Datadog Agent, and log shipper. Use automated deployments through CI/CD pipelines to maintain consistent configurations across your monitoring setup.
Lastly, focus on collecting only the metrics that are absolutely necessary. This approach helps you manage costs effectively without sacrificing insight.
FAQs
What are the pros and cons of using sidecar deployment versus API integration to monitor Fly.io apps with Datadog?
When it comes to monitoring Fly.io apps with Datadog, you’ve got two solid options: sidecar deployment and API integration. Each comes with its own perks and challenges, so the right choice will depend on your app’s needs and your setup.
Sidecar Deployment
- Advantages: This method lets you monitor your app in real-time, offers tighter integration with your app's runtime, and allows you to gather highly detailed metrics and logs straight from the app environment.
- Challenges: It does require extra configuration and can make your deployment process a bit more complex.
API Integration
- Advantages: If you’re looking for something easier to set up, this is your go-to. It’s lightweight and works great if you’re just after high-level metrics or already have existing APIs for monitoring.
- Challenges: The trade-off here is less detailed data and a lack of real-time insights compared to a sidecar setup.
For many small to medium-sized businesses, sidecar deployment is the way to go for deeper, more comprehensive monitoring. On the other hand, API integration is perfect for simpler needs or when you want to keep the setup quick and straightforward.
How can I keep my API keys and sensitive data secure when integrating Datadog with Fly.io?
To keep your API keys and sensitive data secure when integrating Datadog with Fly.io, consider these key practices:
- Store API keys in environment variables rather than embedding them directly in your code. This approach reduces the risk of accidentally exposing sensitive information in your codebase.
- Limit API key permissions to only what’s necessary for your specific tasks. For instance, restrict access to certain services or metrics to prevent potential misuse.
- Regularly rotate your API keys and immediately revoke any that might have been compromised.
On top of that, ensure your Fly.io deployment uses encrypted communication protocols like TLS. You might also want to configure monitoring alerts in Datadog to detect any unusual activity involving your API keys. These measures can help secure your integration and protect your data.
What challenges might I face when setting up Datadog to monitor Fly.io apps, and how can I resolve them?
When configuring Datadog to monitor your Fly.io applications, a few issues might crop up along the way. One common problem involves misconfigured API keys, which can stop Datadog from gathering metrics properly. Make sure your API key is correctly entered in your environment variables or configuration files - this is often the first thing to check.
Another potential snag is network connectivity issues between your Fly.io app and Datadog’s servers. Confirm that your Fly.io app has the required outbound network permissions to connect with Datadog. It’s also a good idea to review your firewall or proxy settings to rule out any blocking.
If you’re using a sidecar deployment for monitoring, keep an eye out for resource limitations like insufficient memory or CPU. These constraints can hurt performance, so monitoring your app’s resource usage and tweaking limits as needed can help keep things running smoothly.
Still stuck? The Datadog documentation and Fly.io support are great resources for troubleshooting specific to your setup.

