How to Optimize Datadog for Your Business
Learn how to optimize Datadog for efficient monitoring, cost reduction, and improved performance tailored to your business needs.
Struggling to make Datadog work efficiently for your business? Here's how small businesses can fine-tune Datadog to reduce costs, improve system monitoring, and get the most out of its features.
Key Takeaways:
- Focus on Key Metrics: Track metrics like throughput, error rates, and resource utilization to monitor performance effectively.
- Control Costs: Filter unnecessary logs, use sampling, and adjust log retention policies to avoid overspending.
- Set Smart Alerts: Configure alerts with thresholds and recovery rules to reduce noise and focus on critical issues.
- Build Better Dashboards: Create clear, organized dashboards to visualize system health and trends at a glance.
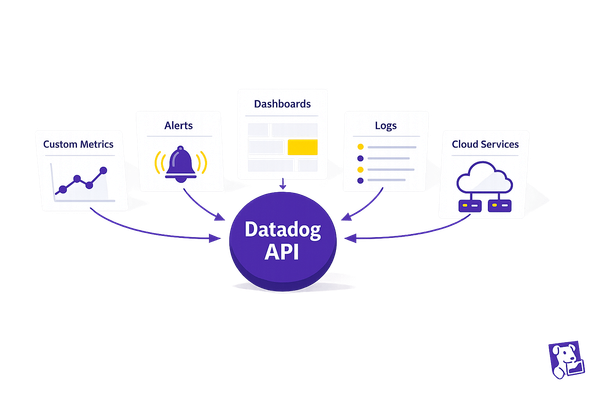
- Integrate Essential Tools: Connect cloud services like AWS or Google Cloud and communication tools like Slack to streamline workflows.
With these steps, you’ll improve monitoring efficiency, reduce expenses, and ensure Datadog aligns with your business needs.
How to Reduce Your Datadog Costs by Optimizing Metric ...
Step 1: Focus Data Collection on Key Business Metrics
To collect data effectively, start by identifying and tracking the metrics that directly impact your business. This approach helps reduce costs while maintaining comprehensive monitoring.
Pick the Right Metrics
Efficient monitoring focuses on work and resource metrics that influence system performance. Work metrics reveal how well your system is functioning overall, while resource metrics help pinpoint underlying issues.
Here are the key metric categories to focus on:
| Metric Type | What to Monitor | Why It Matters |
|---|---|---|
| Work Metrics | • Throughput (requests/sec) • Success rates • Error percentages • Performance times |
Shows system health and user experience |
| Resource Metrics | • Resource utilization • System saturation • Error rates • System availability |
Diagnoses performance issues |
| Events | • System changes • Deployments • Configuration updates |
Explains performance changes |
Focus on metrics that generate useful alerts and allow for quick troubleshooting. While gathering data is relatively cheap, missing critical information when issues arise can be expensive. Instrument your system to capture insights that reveal how it behaves under different conditions.
Once you've selected the metrics, configure your Datadog agents to collect this data.
Configure Agent Settings
Setting up your agents properly ensures you gather the necessary data without creating unnecessary overhead. Here's how to fine-tune your agent settings:
-
Work Metrics: For web servers, track:
- Requests per second to measure throughput
- Percentage of successful responses
- Error response rates
- 90th percentile response time to monitor performance
-
Resource Metrics: For data stores, monitor:
- Queries per second
- Query success rates
- Exception percentages
- Data staleness rates
- Query response times
- Event Tracking: Capture events to provide context for performance changes. Configure agents to log system changes, deployments, and configuration updates.
Step 2: Create Smart Alert Rules
Once your data collection setup is complete, the next step is crafting alert rules that address real problems without bombarding your team with unnecessary notifications. This ensures your systems stay healthy without overwhelming your team with noise.
Set Alert Limits
Striking the right balance between early warnings and avoiding false alarms is key to setting effective thresholds. Here's a quick guide:
| Alert Type | Threshold Setting | Monitoring Period |
|---|---|---|
| CPU Usage | Over 80% sustained | 10–15 minutes |
| Disk Space | Over 85% usage | 15–20 minutes |
To minimize false positives, try the following:
- Extend Evaluation Windows: Only trigger alerts if the issue persists for a set time, avoiding alerts for brief spikes.
- Add Recovery Thresholds: Use slightly lower thresholds for recovery to avoid constant switching between alert states.
- Use Dynamic Thresholds: Adjust limits based on historical performance trends.
"Alert fatigue occurs when an excessive number of alerts are generated by monitoring systems or when alerts are irrelevant or unhelpful, leading to a diminished ability to see critical issues."
With well-defined thresholds, the next step is creating clear response plans to handle alerts efficiently.
Create Alert Response Plans
Here’s how to manage alerts effectively:
- Define Severity Levels: Not all alerts are equal. Escalate critical issues immediately, while addressing less severe ones during routine hours.
- Set Up Team Routing: Make sure alerts go to the right teams based on the service affected and the time of day.
- Implement Alert Grouping: Combine related alerts into a single notification to prevent overwhelming your team (e.g., one alert for high CPU usage across a cluster).
- Schedule Maintenance Windows: Silence alerts during planned updates or deployments to avoid unnecessary noise.
"It's easier to find information because everything's all in one place and documented throughout the process. If you have a problem today, you can look and see when a similar issue happened before, helping you resolve that issue faster." - Ben Edmunds, Staff Engineer at SeatGeek
Regularly review and adjust your alert settings based on team input and system performance. Companies like Aha! have improved their processes by integrating alerting tools into their workflows:
"When Datadog released On-Call and Incident Management, we saw the benefit of using these tools alongside APM to give engineers one place to monitor performance, schedule our rotations, and streamline our workflow." - Chris Waters, CTO at Aha!
Step 3: Build Clear Performance Dashboards
Layout Best Practices
A well-organized dashboard is key to quickly understanding data. Datadog's updated dashboard system uses a responsive grid that adjusts to any screen size, making it easier to create clean and effective monitoring setups.
Here are some tips to improve your dashboard layout:
-
Arrange Widgets Strategically
Focus on placing the most important metrics at the top. The grid system supports:- The "Row" option for easy alignment of multiple widgets.
- Grouping related widgets with
shift+clickor lasso selection. - Using
cmd+Gto organize related metrics into groups.
-
Create a Logical Flow
Design the dashboard layout to guide users through data in a meaningful way:Position Purpose Top Row Key performance indicators Middle Section Trends and ongoing metrics Bottom Area Detailed analytics and insights -
Leverage Advanced Tools
Take advantage of Datadog’s layout features to maximize efficiency:- "High density mode" lets you view two widgets side by side.
- Partial width groups optimize screen space.
- Use the clipboard to duplicate and reuse effective configurations.
Combine Overview and Detail Views
Once your layout is set, combine high-level summaries with detailed data for a complete understanding of system performance. Strike a balance between broad overviews and access to deeper insights.
Here’s how to structure your dashboard effectively:
| Visualization Type | Best Use Case | Key Benefit |
|---|---|---|
| Time Series | Track CPU or memory trends | See changes over time |
| Heat Maps | Show request distribution | Spot patterns or outliers |
| Stacked Graphs | Manage resource allocation | Understand component usage |
When building your views, consider these tools:
- Screenboards for a mix of real-time monitoring and static historical data.
- Timeboards for troubleshooting and exploring detailed metrics.
- Conditional Formatting to highlight important values.
- Distribution Widgets to provide a snapshot of system health.
Datadog offers pre-built dashboards for technologies like Kubernetes, MongoDB, and Redis. You can use these as a starting point and then tailor them to fit your specific needs. This approach helps clarify system performance while aligning with your organization’s goals for cost management and responsiveness.
Step 4: Reduce Log Management Costs
Cutting down log management expenses is essential for maintaining visibility while keeping costs under control. Research shows that businesses optimize less than 1% of their logs, leaving substantial savings untapped.
Adjust Log Batch Settings
Data reveals that info logs make up 94.1% of indexed logs. To optimize log batch configurations effectively, follow these recommendations:
| Log Type | Suggested Action | Benefit |
|---|---|---|
| Debug Logs | Exclude from indexing | Immediate cost savings |
| Health Checks | Convert to metrics | Better storage efficiency |
| High-volume Services | Apply sampling | Reduce volume significantly (up to 80–90%) |
| Critical Operations | Retain fully | Ensure complete visibility |
-
Set Up Intelligent Sampling
Focus on high-volume services and implement intelligent sampling to reduce unnecessary logs. -
Configure Volume Alerts
Use monitors to track usage metrics by service and source. Set daily quotas and warning thresholds to catch unexpected spikes early, preventing budget overruns.
These batching strategies should be applied before implementing strict log retention policies.
Set Smart Log Retention Rules
Once batching is optimized, enforce retention rules to further cut costs. For example, switching from a 15-day to a 3-day retention policy can save over 37%. Here's how to refine your retention settings:
- Use Flex Logs for high-volume storage at just $0.05 per million logs per month.
- Define index-specific retention periods based on data importance.
- Route excluded logs to archives for future reference if needed.
- Set up a catch-all index to capture logs that don’t match higher-priority filters.
Segment logs into value-based groups for better efficiency:
| Priority Level | Retention Period | Storage Type | Use Case |
|---|---|---|---|
| Critical | 15+ days | Standard Index | Active troubleshooting |
| Important | 3–15 days | Standard Index | Ongoing monitoring |
| Historical | 30+ days | Flex Logs | Compliance or analysis |
| Low Value | Archive only | Cloud Storage | Long-term storage |
Limit index changes to unit leads or central administrators. Pay close attention to your top 10 indexes, as they typically account for 80% of logs and 90% of total costs.
For long-term storage, consider using Datadog's archiving feature. This allows you to maintain auditability without the expense of standard indexing, making it a practical solution for compliance and cost management.
Step 5: Connect Your Essential Tools
Link Cloud Services
Use Datadog's one-click integration to connect your cloud infrastructure. This setup automatically collects metrics and tags, giving you instant insights into how your infrastructure is performing.
| Cloud Platform | Key Integration Features | Integration Priority |
|---|---|---|
| AWS Services | Prebuilt dashboards and automatic tag syncing | Essential |
| Google Cloud | Private Service Connect and cost tracking | High |
| Hybrid Systems | Unified monitoring across platforms | Medium |
The Datadog Agent enhances these integrations by gathering detailed metrics and metadata. This includes:
- Real-time performance tracking
- Automatic service discovery
- Custom metric collection
- Metadata for infrastructure components
When setting up cloud integrations, start with the most critical services. For instance, if you're using Google Cloud, prioritize connecting tools like Google Kubernetes Engine and Cloud Run. These come with preconfigured dashboards, giving you instant access to actionable insights.
After setting up your cloud services, move on to integrating your team's communication tools.
Add Team Communication Tools
Integrating Datadog with Slack helps streamline incident response and manage alerts effectively.
Here’s how to set up your communication tools:
-
Configure Alert Channels
Create dedicated Slack channels for various alert types and severity levels. This ensures teams see only the notifications relevant to them, avoiding clutter in general channels. -
Set Up Command Integration
Use the/datadog incidentcommand in Slack to declare incidents quickly. This feature automatically creates dedicated incident channels and syncs timelines between Datadog and Slack."Together with Datadog Incident Management, the Datadog Slack integration helps teams streamline their handling of incidents by minimizing context-switching and simplifying collaboration." – Datadog
-
Establish Alert Priorities
Configure alerts to route based on their severity. Critical notifications should reach the appropriate teams immediately, while lower-priority alerts can be directed to less urgent channels. This setup reduces noise and keeps communication clear.
Enable features like automatic incident channel creation and bookmark sharing to make incident management even smoother.
Conclusion: Main Points for Success
Getting the most out of Datadog involves regular reviews and a structured plan. Here are the key strategies to keep in mind:
Fine-Tune Data Collection
Set up data collection to focus on the most important metrics and ensure proper tagging practices are in place.
Improve Alert Management
Develop clear alert guidelines. Use self-service tools to automatically inform developers about new flaky tests or performance issues.
Track Performance Trends
Compile detailed quarterly reports highlighting each repository's flaky tests and performance regression patterns. These insights help leadership make better decisions.
FAQs
What are the key metrics small businesses should monitor with Datadog to optimize performance?
To optimize performance with Datadog, small businesses should focus on two key types of metrics:
-
Work metrics: These measure the overall health and output of your system. Key areas include:
- Throughput: How much work your system is processing.
- Success rates: The percentage of successful operations.
- Error rates: The frequency of failed operations.
- Performance: How efficiently your system is running.
-
Resource metrics: These help you understand your system's capacity and diagnose issues. Important metrics include:
- Utilization: How much of a resource (e.g., CPU, memory) is being used.
- Saturation: How close your system is to its limits.
- Errors: Problems affecting resource performance.
When setting up alerts, aim to alert broadly but notify selectively - focus on symptoms impacting users rather than underlying causes. This ensures your team is informed about critical issues without being overwhelmed by unnecessary notifications.
What are the best practices for setting up alerts in Datadog to reduce noise and quickly address critical issues?
To effectively manage alerts in Datadog, focus on minimizing unnecessary noise while ensuring critical issues are prioritized. Start by configuring alerts that highlight user-facing problems or significant system disruptions. Use tiered alerting to route notifications based on severity - send low-priority issues via email or chat, while paging on-call engineers for urgent incidents.
Regularly review and refine your alerts to prevent alert fatigue by identifying and adjusting noisy or overly frequent alerts. You can also use evaluation windows and recovery thresholds to avoid false positives and ensure alerts are triggered only by consistent, meaningful behavior. For planned maintenance, schedule downtimes to suppress unnecessary alerts.
Lastly, consider grouping related alerts to reduce clutter and streamline responses. By leveraging these practices, you can maintain a focused and efficient alerting system tailored to your business needs.
How can my business lower Datadog log management costs without losing key insights?
To reduce log management costs in Datadog while retaining valuable insights, focus on optimizing how logs are processed and stored. Start by filtering out unnecessary logs before they are sent to Datadog. You can also aggregate logs to reduce volume and adjust log retention policies to align with your compliance and operational needs.
Datadog provides powerful tools like exclusion filters to prevent specific logs from being indexed, which can help cut costs related to storage and indexing. For less frequently accessed logs, consider using Flex Logs as a cost-effective option for long-term storage. By tailoring these strategies to your business needs, you can significantly reduce expenses while maintaining critical data visibility.

