How to Set Up Cloud Monitoring with Datadog
Learn how to effectively set up cloud monitoring with a comprehensive guide covering installation, alerts, and best practices for efficient resource management.
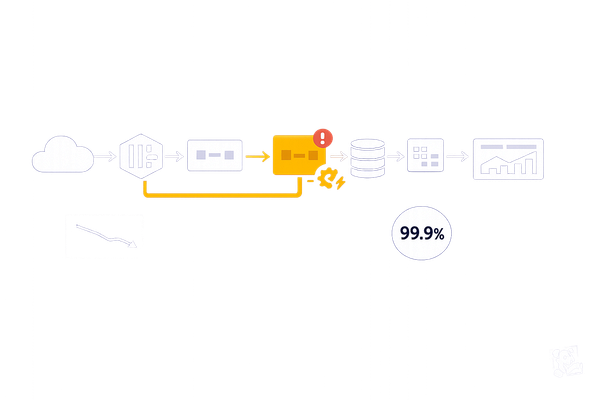
Cloud monitoring is crucial for keeping your systems running smoothly and managing costs effectively. Datadog simplifies this process by combining metrics, logs, and performance data into one platform. Here's what you'll learn in this guide:
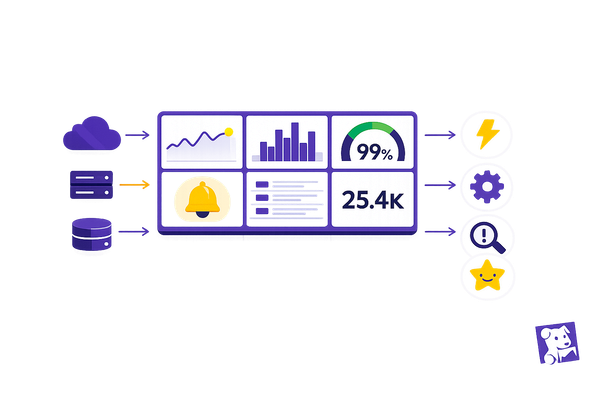
- Why Datadog is ideal for SMBs: Unified dashboards, automated alerts, resource tracking, and performance analytics.
- How to install Datadog: Step-by-step instructions for Windows, Linux, and cloud integrations (AWS, Azure, GCP).
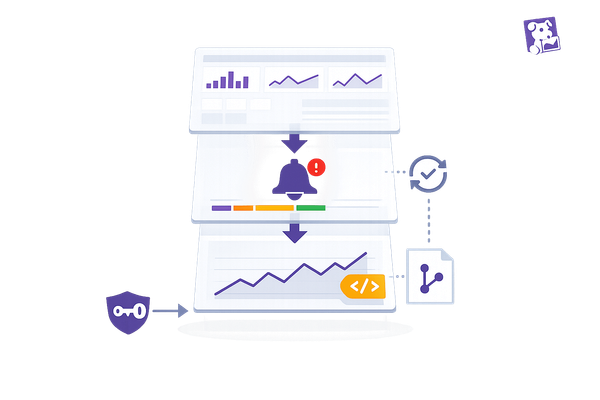
- Setting up monitoring: Create metric monitors, configure alerts, and build dashboards.
- Best practices for SMBs: Tagging resources, controlling costs, and strengthening security.
Quick Start:
- Install the Datadog Agent using your system's instructions.
- Connect your cloud platforms (AWS, Azure, GCP) for full visibility.
- Set up alerts for key metrics like CPU, memory, and disk usage.
- Create dashboards to monitor performance trends and business metrics.
For more details, keep reading to optimize your cloud monitoring setup with Datadog.
How to register for Datadog - Monitoring as a service & install ...
Setup Requirements and Installation Steps
Here's a guide to the requirements and steps for setting up Datadog monitoring.
System Requirements
Before installing Datadog, make sure your system meets these minimum requirements:
| Component | Minimum Specifications |
|---|---|
| Operating System | Windows Server 2012 R2+, Linux kernel 2.6.23+, macOS 10.12+ |
| CPU | 2 cores |
| Memory | 1GB RAM |
| Disk Space | 500MB free space |
| Network | Outbound HTTPS (port 443) access |
| Cloud Access | Admin-level credentials for your cloud platform |
Install Datadog Agent
Follow these steps to install the Datadog Agent on your system:
1. Windows Installation
Download the Agent installer from your Datadog account. Then, open PowerShell as Administrator and run the following commands:
$env:DD_API_KEY="your-api-key"
Start-Process -Wait msiexec -ArgumentList '/qn /i datadog-agent-7-latest.amd64.msi'
2. Linux Installation
For Linux systems, execute this command in your terminal:
DD_API_KEY=your-api-key DD_SITE="us" bash -c "$(curl -L https://s3.amazonaws.com/dd-agent/scripts/install_script.sh)"
3. Cloud Platform Integration
If you're integrating Datadog with a cloud platform like AWS, ensure you grant the necessary permissions. For example, use the following policy for AWS:
{
    "Version": "2012-10-17",
    "Statement": [
        {
            "Effect": "Allow",
            "Action": [
                "cloudwatch:Get*",
                "cloudwatch:List*"
            ],
            "Resource": "*"
        }
    ]
}
Check Installation Status
Once installed, verify the Agent is running and connected:
-
Agent Status Check
- On Windows, run:
& "C:\Program Files\Datadog\Datadog Agent\bin\agent\agent.exe" status - On Linux, execute:
sudo datadog-agent status
- On Windows, run:
-
Platform Connection
- Log in to your Datadog dashboard.
- Go to Infrastructure > Hosts and confirm your systems appear.
The Agent should begin collecting metrics within about 5 minutes. If no data appears, check your firewall settings or ensure the Agent service is active.
Finally, test the setup by creating a CPU alert at 80%. Once metrics start flowing, you can proceed to connect your cloud services.
Connect Cloud Services to Datadog
Link your cloud services to Datadog by setting up authentication and organizing your resources effectively.
Add Cloud Provider Connections
Here's how to integrate AWS, Azure, and Google Cloud with Datadog:
1. AWS Integration
Set up an IAM role in your AWS account and configure the trust relationship with the following policy:
{
  "Version": "2012-10-17",
  "Principal": {
    "AWS": "arn:aws:iam::464622532012:root"
  },
  "Action": "sts:AssumeRole",
  "Condition": {
    "StringEquals": {
      "sts:ExternalId": "[YOUR-EXTERNAL-ID]"
    }
  }
}
In your Datadog dashboard, go to Integrations > AWS, and provide your AWS Account ID and External ID.
2. Azure Integration
Register an app in Azure and assign it the Reader role at the subscription level. You'll need these details:
- Application (client) ID
- Directory (tenant) ID
- Client Secret
Enter this information in the Azure integration tile on Datadog's Integration page.
3. Google Cloud Integration
Create a service account and assign these roles: Compute Viewer, Monitoring Viewer, and Cloud Asset Viewer.
Download the JSON key file and upload it through Datadog's GCP integration page.
Once the cloud providers are connected, organize resources for better monitoring by tagging them.
Set Up Resource Tags
Tagging your resources helps streamline monitoring. Use the following structure:
| Tag Category | Example Tags | Purpose |
|---|---|---|
| Environment | env:production, env:staging |
Differentiate deployment environments |
| Business Unit | team:marketing, team:engineering |
Track resource usage by department |
| Cost Center | cost:marketing-2025, cost:dev-ops |
Monitor spending by business units |
| Application | app:website, app:api |
Group related resources |
| Service Tier | tier:critical, tier:standard |
Prioritize monitoring efforts |
Best practices for tagging:
- Keep naming conventions consistent across all cloud providers.
- Apply tags during resource creation using Infrastructure as Code tools.
- Enforce automatic tagging with cloud provider policies.
- Use tag-based views in Datadog dashboards to simplify monitoring.
For automated tagging in Datadog, configure rules like this:
# Example tag mapping rule
mapping:
  - name: "service"
    pattern: "^(?P<service>[^-]+).*$"
    apply_to: "host"
This rule extracts service names from resource identifiers and assigns them as tags.
Set Up Monitoring and Alerts
Monitor and Alert Basics
Start by identifying the key performance indicators (KPIs) that matter most for your cloud infrastructure. Tools like Datadog can track these metrics in real time and trigger alerts when specific thresholds are crossed.
Here are the core components of monitoring:
- Metrics: Measurable data points such as CPU usage, memory consumption, and response times.
- Thresholds: Predefined values that, when exceeded, activate an alert.
- Alert Priority: Levels of urgency that dictate how quickly and to whom notifications are sent.
These elements form the groundwork for creating detailed configurations.
Set Up Metric Monitors
Focus on the most critical metrics for your infrastructure and use the following recommended thresholds to guide your setup:
| Metric Type | Warning Threshold | Critical Threshold | Evaluation Window |
|---|---|---|---|
| CPU Usage | 70% | 85% | 5 minutes |
| Memory Usage | 75% | 90% | 5 minutes |
| Disk Usage | 80% | 90% | 15 minutes |
| Error Rate | 2% | 5% | 10 minutes |
| API Latency | 500ms | 1000ms | 5 minutes |
To set up a metric monitor, follow these steps:
- Go to Monitors > New Monitor > Metric in your monitoring tool.
- Use the query builder to select the metric you want to monitor.
- Define the alert conditions and thresholds based on your needs.
- Specify the evaluation window and configure how the monitor handles missing data.
- Add a notification message and choose the recipients who should be alerted.
For more complex scenarios, you can use composite monitors to combine multiple metrics into a single alert. Here's an example:
# Example composite monitor
avg(last_5m):avg:system.cpu.user{*} > 80 &&
avg(last_5m):avg:system.memory.used{*} > 85
Once your metric monitors are in place, you can fine-tune the alert settings for better alignment with your team's workflow.
Configure Alert Settings
After setting up metric monitors, customize alert settings to ensure they fit your team's processes and priorities.
- Notification Channels
-
Time-Based Routing
Adjust alert routing based on time zones to ensure the right team members are notified during their working hours. For example:
# Alert routing example notifications: business_hours: "09:00-17:00 America/New_York" primary_team: "@slack-ops-team" after_hours: "@pagerduty-oncall" -
Alert Message Template
Craft clear and actionable alert messages to reduce response times. Here's a sample format:
[SEVERITY] Monitor Alert: {{monitor.name}}
Metric: {{metric.name}}
Value: {{value}} {{unit}}
Threshold: {{threshold}}
Environment: {{host.environment}}
Actions: [Runbook Link] [Dashboard Link]
With these settings, your alerts will be well-organized, actionable, and tailored to your team's requirements.
Create and Modify Dashboards
Build Monitoring Dashboards
To create a dashboard that works well, group related metrics together. Start by navigating to Dashboards > New Dashboard in your Datadog console.
1. Layout and Structure
Organize metrics into logical sections for clarity:
- System Health: CPU, Memory, Disk Space
- Application Performance: Response Times, Error Rates, Request Volume
- Business Metrics: Transactions, Active Users, Revenue Impact
2. Widget Selection
Choose the right widget type for each metric:
| Widget Type | Purpose |
|---|---|
| Time Series | Tracks resource usage trends |
| Query Value | Displays current status metrics |
| Heat Maps | Shows distribution patterns |
| Top List | Highlights resource consumption |
3. Data Visualization
Assign clear and specific queries to your widgets for accurate data representation:
# Example widget query
avg:system.cpu.user{environment:production} by {host}.rollup(avg, 60)
Once your dashboard layout is complete, fine-tune the settings to suit your team's needs.
Adjust Dashboard Settings for Teams
After setting up your custom dashboard layout, refine its settings to enhance team collaboration and usability.
1. Time Zone Configuration
Set a time zone and refresh settings to keep dashboards relevant:
dashboard_settings:
  timezone: "America/New_York"
  refresh_interval: 300
  default_timeframe: "1h"
2. Access Controls
Define permissions to ensure the right people have appropriate access:
| Role | View Access | Edit Access | Share Access |
|---|---|---|---|
| Admin | All Dashboards | Full Control | Yes |
| Team Lead | Team Dashboards | Limited Edit | Team Only |
| Developer | Service Dashboards | View Only | No |
3. Template Variables
Use template variables to make dashboards dynamic and reusable:
template_variables:
  - name: "environment"
    prefix: "env"
    default: "production"
  - name: "service"
    prefix: "service"
    default: "all"
Keep dashboards concise by limiting them to 25–30 widgets. Critical metrics should update every 30 seconds, while less urgent ones can refresh every 5 minutes.
SMB Monitoring Guidelines
These SMB-focused tips build on your existing Datadog setup to improve alerts, manage costs, and strengthen security measures.
Improve Alert and Dashboard Usage
Set alert thresholds carefully to ensure they remain effective and avoid overwhelming your team.
| Alert Priority | Response Time | Notification Channel | SMB-Specific Threshold |
|---|---|---|---|
| Critical | Less than 15 minutes | Phone, SMS, Email | CPU > 90% for 5 minutes |
| Warning | Less than 2 hours | Email, Slack | Memory > 75% for 15 minutes |
| Info | Daily review | Dashboard only | Disk usage > 60% |
To keep alerts aligned with your team’s capacity, consider this configuration for routing and escalation:
alert_settings:
  business_hours: "9:00 AM - 5:00 PM EST"
  on_call_rotation: true
  escalation_delay: 30
  recovery_window: 15
Once alerts are fine-tuned, focus on keeping costs under control as your infrastructure expands.
Control Costs and Growth
As your monitoring needs grow, take steps to manage Datadog costs effectively:
- Resource Tagging Strategy: Use a clear tagging system to track usage and allocate resources efficiently.
tag_structure:
  environment: [prod, staging, dev]
  team: [backend, frontend, ops]
  cost_center: [infrastructure, application]
- Optimize Metric Collection: Prioritize essential metrics to reduce unnecessary data collection.
| Metric Category | Collection Interval | Retention Period |
|---|---|---|
| Infrastructure | 15 seconds | 15 days |
| Application | 30 seconds | 30 days |
| Business KPIs | 5 minutes | 90 days |
- Custom Metrics Management: Regularly review and adjust custom metrics to avoid waste.
metric_review:
  frequency: monthly
  retention_rules:
    unused_metrics: archive after 30 days
    low_value_metrics: evaluate quarterly
By managing costs effectively, you’ll have more resources to dedicate to critical security measures.
Meet Security Standards
Strengthen your security practices while ensuring compliance with U.S. regulations using Datadog's tools.
- Access Control Configuration: Implement role-based access control (RBAC) to define permissions clearly.
security_roles:
  admin:
    permissions: ["write_all", "read_all"]
    mfa_required: true
  developer:
    permissions: ["read_all", "write_logs"]
    ip_restriction: true
- Data Privacy Settings: Set up configurations to meet compliance requirements.
| Requirement | Configuration | Verification |
|---|---|---|
| HIPAA | PHI Filtering | Monthly Audit |
| PCI DSS | Card Data Masking | Quarterly Check |
| SOC 2 | Log Encryption | Annual Review |
- Audit Trail Setup: Enable audit logging to track key events and changes.
audit_settings:
  log_retention: 365
  event_types: ["login", "config_change", "api_access"]
  export_frequency: "daily"
These measures ensure your data stays secure and compliant, providing peace of mind as your SMB scales.
Next Steps
Once you've set up core monitoring, consider enhancing your system with these steps:
-
Refine Alert Configurations
Regularly review your alert settings to ensure you're tracking both system performance and key business metrics. Adjust thresholds as your environment changes to maintain accuracy. -
Expand Monitoring Gradually
Begin with basic infrastructure monitoring, then layer in application-level insights and custom metrics to handle more complex needs effectively. -
Schedule Routine Maintenance
Keep your setup current by updating dashboards, removing outdated monitors, and checking security settings on a regular basis. -
Optimize Resource Usage
Create a plan to manage data retention, sampling rates, and costs. This will help you balance performance and budget effectively.
For more expert advice, check out Scaling with Datadog for SMBs.
FAQs
What advantages does Datadog offer SMBs for monitoring cloud infrastructure?
Datadog provides small and medium-sized businesses (SMBs) with a powerful platform to monitor and optimize their cloud infrastructure. It offers real-time insights into system performance, helping businesses identify and address issues before they impact operations.
With Datadog, SMBs can streamline their monitoring processes, improve system efficiency, and make data-driven decisions to support growth. Its user-friendly dashboards and automated alerts ensure that even smaller teams can manage complex cloud environments effectively.
How can I keep my Datadog setup cost-effective as my business grows?
To ensure your Datadog setup remains cost-effective as your business scales, start by regularly reviewing your usage and identifying underutilized features or unnecessary integrations. Tagging and grouping resources can help you track costs more effectively and allocate them to specific teams or projects.
Additionally, consider setting up custom alerts to monitor usage spikes and resource consumption. This will allow you to address inefficiencies early and avoid unexpected expenses. Finally, make use of Datadog’s built-in cost analysis tools to gain insights into your spending and optimize your monitoring configuration accordingly.
What security features should I enable in Datadog to meet U.S. compliance requirements?
To align with U.S. compliance standards, you can leverage several security features available in Datadog. Start by enabling role-based access control (RBAC) to ensure only authorized users can access sensitive data. Configure audit logs to track user activity and system changes, which is essential for compliance monitoring. Additionally, use encryption for data in transit and at rest to protect sensitive information.
For specific regulatory requirements, such as HIPAA or SOC 2, review Datadog’s compliance documentation and consult with your legal or compliance team to ensure all necessary configurations are in place. These steps will help safeguard your cloud infrastructure while meeting U.S. regulations.