
How to Set Up Log Management in Datadog
Learn how to set up log management in Datadog for effective monitoring and troubleshooting of your infrastructure with this comprehensive guide.
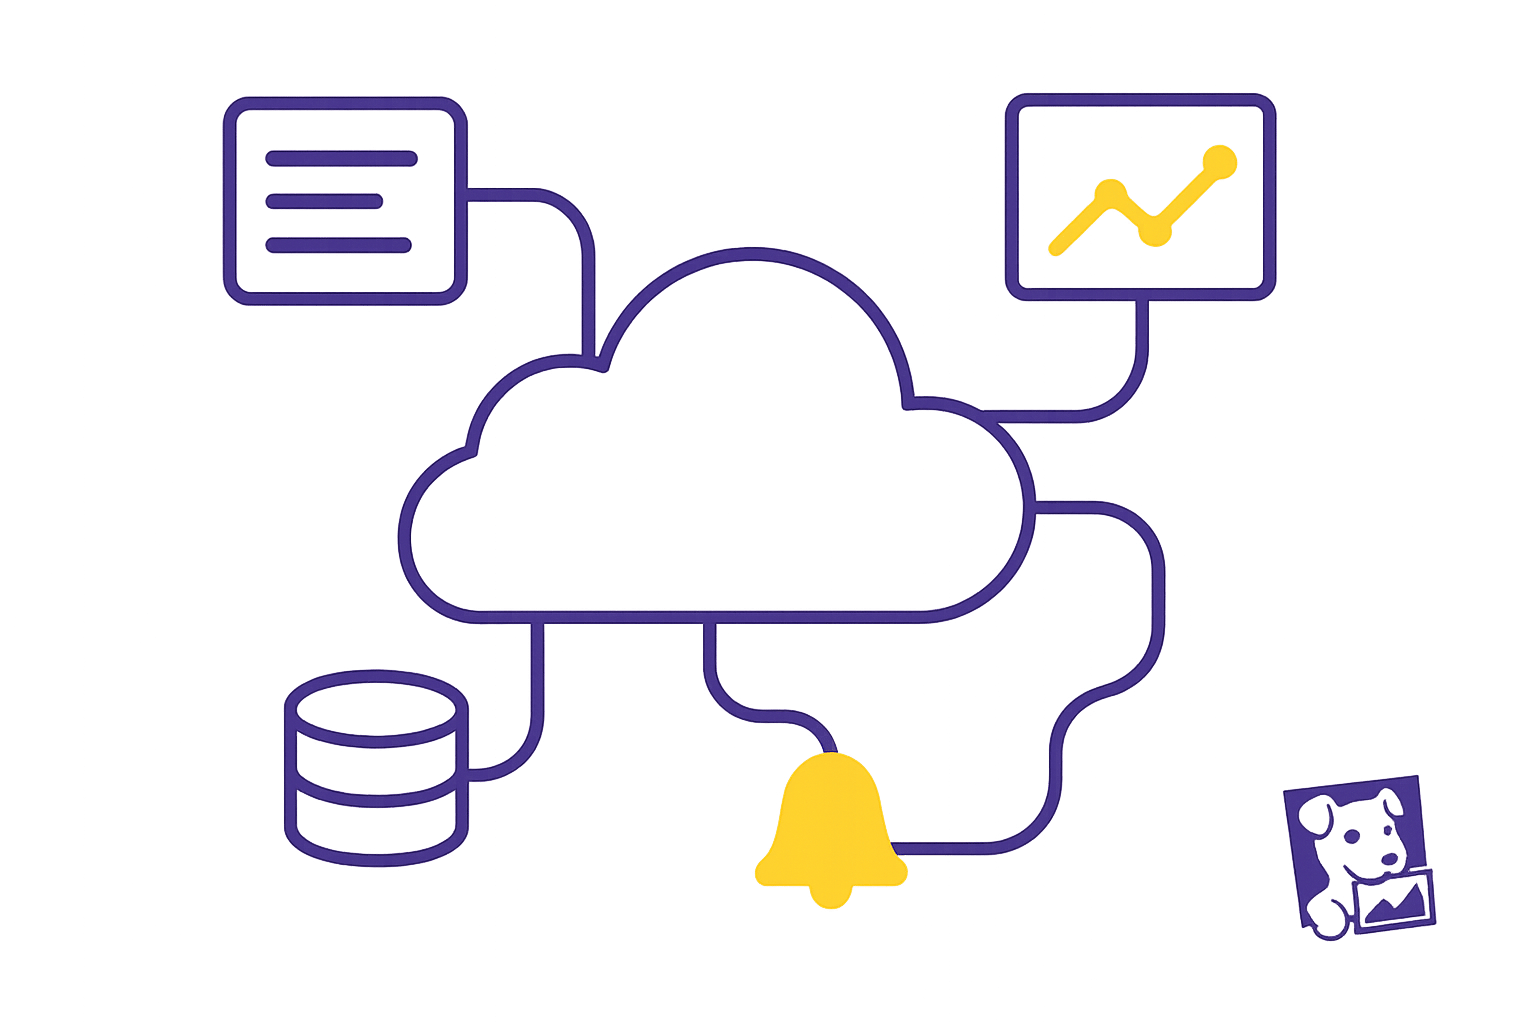
Managing logs in Datadog is essential for monitoring and troubleshooting your infrastructure. Here's how you can set up log management quickly:
- Install the Datadog Agent: Use the provided installation command, ensuring your API key is included.
- Enable Log Collection: Modify the
datadog.yamlfile to turn on log collection and set up processing rules. - Configure Log Sources:
- For applications: Define log paths and formats (e.g., JSON).
- For system logs: Add configurations for files like
/var/log/syslog. - For containers: Use Docker labels or Kubernetes annotations.
- Analyze Logs: Parse data, filter key insights, and create dashboards for real-time tracking.
- Control Costs: Use filtering rules to exclude unnecessary logs and manage log retention.
Why use Datadog for logs?
- Real-time monitoring
- Centralized dashboard
- Automated parsing
- Cost management
This guide is perfect for DevOps engineers, system admins, and IT teams looking to streamline their logging processes. Follow these steps to ensure a smooth setup and gain actionable insights from your logs.
How to Send Logs from EC2 to Datadog | Full Log Collection ...
Initial Setup Steps
Before diving into log management, make sure you’ve got everything in place.
Before You Begin
To set up log management in Datadog, ensure you have the following:
- An active Datadog account with log management enabled
- Administrator-level access to your servers or cloud infrastructure
- SSH or similar remote management access
- A basic understanding of your system’s logging setup
Install and Set Up Datadog Agent
The Datadog Agent is essential for collecting and sending logs to your Datadog account. Here’s how to get it up and running:
-
Install the Agent
Use SSH to access your server and run the installation command specific to your system. For Linux, use this command:
DD_API_KEY=<YOUR_API_KEY> DD_SITE="datadoghq.com" bash -c "$(curl -L https://s3.amazonaws.com/dd-agent/scripts/install_script.sh)" -
Configure Log Collection
Open the Agent configuration directory and modify the
datadog.yamlfile to enable log collection:logs_enabled: true logs_config: processing_rules: - type: mask_sequences name: mask_credentials pattern: (?:\\s*(?:password|secret|token)\\s*[=:])\\s*\\S+ replacement: "\\1 [MASKED]" -
Verify Installation
Confirm the Agent is installed and running by executing:
Check the output for the "Logs Agent" section to ensure it’s active.datadog-agent status
Keep an eye on the Agent's performance during the initial setup to make sure it’s running efficiently. Once the Agent is installed and configured, you can move on to setting up your log sources.
Set Up Log Sources
Set up your infrastructure to collect and manage logs effectively.
Collect Application Logs
To gather logs from your applications, configure the log paths in your application’s configuration files.
- Configure Log Paths
Create a configuration file in the /etc/datadog-agent/conf.d/ directory specific to your application. For instance, for a Python app:
logs:
  - type: file
    path: /var/log/myapp/*.log
    service: myapp
    source: python
    log_processing_rules:
      - type: multi_line
        pattern: \d{4}\-\d{2}\-\d{2}\s\d{2}:\d{2}:\d{2}
        name: new_log_start_pattern
- Set Log Format
Use JSON formatting for easier parsing and analysis:
{
  "timestamp": "2025-05-03 14:30:00",
  "level": "ERROR",
  "message": "Database connection failed",
  "service": "user-auth"
}
Now let’s move to system logs, which are crucial for monitoring your infrastructure.
Monitor System Logs
System logs provide insights into the health and performance of your infrastructure. Here’s how to configure them:
- Enable System Logs
Add this configuration to /etc/datadog-agent/conf.d/system.d/conf.yaml:
logs:
  - type: file
    path: /var/log/syslog
    service: system
    source: syslog
  - type: file
    path: /var/log/auth.log
    service: security
    source: auth
- Set Permissions
Ensure the Datadog Agent has the necessary read permissions to access system logs:
sudo usermod -a -G adm dd-agent
sudo usermod -a -G syslog dd-agent
For containerized environments, follow the steps below to collect container logs.
Track Container Logs
To capture logs from containers, use the following configurations:
- Docker Configuration
Add these labels to your Docker containers:
labels:
  com.datadoghq.ad.logs: '[{"source": "java", "service": "myapp"}]'
- Kubernetes Setup
Annotate your Kubernetes pods with the following:
apiVersion: apps/v1
kind: Deployment
metadata:
  name: myapp
spec:
  template:
    metadata:
      annotations:
        ad.datadoghq.com/containers.logs: '[{
          "source": "java",
          "service": "myapp",
          "log_processing_rules": [{
            "type": "multi_line",
            "name": "stack_trace",
            "pattern": "^[\\s]+"
          }]
        }]'
After applying these changes, restart the Datadog Agent to activate the configurations:
sudo systemctl restart datadog-agent
Once set up, check the Datadog Logs Explorer dashboard to confirm that logs are being collected successfully. This should only take a few minutes.
Process and Analyze Logs
Once your logs are coming in, the next step is to process them and extract insights you can act on.
Parse and Extract Log Data
Set up processors to pull out the most important details from your logs. Here's an example configuration:
logs:
  - type: file
    service: payment-service
    source: python
    log_processing_rules:
      - type: grok
        pattern: "%{TIMESTAMP_ISO8601:timestamp} %{WORD:level} %{GREEDYDATA:message}"
      - type: attribute_remapper
        sources:
          level: severity
For more specific needs, you can add custom processors. For instance, to parse user activity data:
processors:
  - type: user-info-parser
    sources:
      message: user_data
    grok:
      patterns:
        - "User %{WORD:user.id} performed %{WORD:action} at %{TIMESTAMP_ISO8601:action.timestamp}"
Filter and Sort Logs
To focus on the logs that matter most, define queries like this:
service:payment-service status:error
@http.status_code:[500 TO 599]
Save common queries as reusable views. Here's a quick example:
| View Name | Query | Purpose |
|---|---|---|
| Critical Errors | status:error priority:P1 |
Keep an eye on urgent issues |
| Payment Failures | service:payment-service status:error |
Track payment-related problems |
| Security Events | source:auth level:warn OR level:error |
Watch for security concerns |
These saved views can serve as the backbone of your dashboards.
Create Log Dashboards
Dashboards let you visualize key metrics. Here are a few ideas to get started:
-
Log Volume Analysis
- Add a timeseries widget to display log volume by service.
- Include filters for error rates and response times.
- Configure alerts for unexpected spikes.
-
Error Tracking
- Show the most frequent error messages.
- Group errors by service and severity.
- Monitor how long it takes to resolve issues.
Here’s an example JSON snippet for an error tracking dashboard:
{
  "title": "Error Tracking Dashboard",
  "widgets": [
    {
      "definition": {
        "type": "toplist",
        "requests": [{
          "q": "top(sum:errors.count{*} by {service}, 10, 'sum', 'desc')",
          "conditional_formats": []
        }]
      }
    }
  ]
}
- Performance Monitoring
- Track latency trends over time.
- Keep tabs on resource usage.
- Spot bottlenecks before they escalate.
To make your dashboards more effective:
- Group related metrics together for clarity.
- Use color coding to highlight severity levels.
- Add clear titles and annotations for context.
- Set time ranges and enable auto-refresh to keep data current.
These steps will help you transform raw logs into actionable insights that drive better decisions.
Manage Logs at Scale
As your system usage grows, managing logs effectively becomes critical for maintaining performance and controlling costs. Building on log processing and dashboard creation, these methods help ensure your infrastructure stays efficient as it scales.
Control Log Volume
Use filtering rules to capture only the most important log data. Here's an example:
logs:
  - type: file
    service: web-app
    source: nginx
    log_processing_rules:
      - type: exclude_at_match
        name: exclude_healthchecks
        pattern: "GET /health HTTP/1.1"
      - type: exclude_at_match
        name: exclude_static
        pattern: "\.(jpg|jpeg|gif|png|ico|css|js)$"
This setup helps eliminate unnecessary logs, saving on storage costs while keeping essential monitoring intact.
Set Up Log Automation
Automating log monitoring reduces manual effort and ensures quick responses to issues. For example:
monitors:
  - name: error_spike_alert
    type: log alert
    query: "logs(\"status:error\").index(\"*\").rollup(\"count\").last(\"5m\") > 100"
    message: "Error rate exceeded threshold. Check application status."
    escalation_message: "Error rate still high after 15 minutes"
This monitor flags error spikes immediately, allowing you to address problems before they escalate.
Additionally, schedule reports to keep track of system performance over time:
reports:
  - name: weekly_error_summary
    schedule: "0 9 * * 1"  # Every Monday at 9 AM
    query: "status:error"
    aggregation: count
    group_by: ["service", "error_type"]
With automated alerts and scheduled reports, you can stay on top of performance trends and quickly identify issues.
Summary
Managing logs effectively with Datadog involves a structured approach. Here's a roadmap to guide you through the key steps:
| Phase | Focus Area | Key Actions |
|---|---|---|
| Initial Setup | Foundation | Configure the agent, ensure connectivity |
| Source Integration | Data Collection | Connect critical log sources, confirm data flow |
| Processing | Data Quality | Define parsing rules, apply filters |
| Automation | Efficiency | Set up alerts, schedule regular reports |
| Optimization | Resource Usage | Track log volume, tweak retention settings |
Make it a habit to review your log setup periodically. This helps fine-tune processes and manage costs effectively.
FAQs
How do I verify that my Datadog Agent is set up correctly and working efficiently after installation?
To ensure your Datadog Agent is properly configured and running efficiently, start by checking its status. Run the datadog-agent status command in your terminal to confirm that the agent is active and collecting data. Look for any warnings or errors in the output that might indicate configuration issues.
Next, review your integration settings in the Datadog dashboard to ensure all necessary services are connected. Verify that logs, metrics, and traces are being sent to your account as expected. If you’re part of a small team, focus on prioritizing key integrations that align with your current monitoring needs to avoid unnecessary complexity.
Finally, adjust resource usage settings if needed to optimize performance for your environment. This is especially important for small and medium-sized businesses with limited resources. Regularly monitoring the agent’s performance and updating configurations as your needs evolve can help you maintain efficiency and scalability.
What are the best practices for managing log volume and reducing costs in Datadog's log management system?
To effectively manage log volume and control costs in Datadog, consider these best practices:
- Set up exclusion filters: Use exclusion filters to prevent unnecessary logs from being indexed. This helps reduce storage costs while keeping essential logs accessible.
- Leverage log retention policies: Adjust retention settings to store logs only for the duration you truly need them. Shorter retention periods can lower costs without compromising critical insights.
- Enable log rehydration: Archive logs to cost-effective storage solutions like Amazon S3 and rehydrate them in Datadog only when needed. This ensures you have access to historical logs without incurring high storage fees.
- Group logs with facets and tags: Organize logs using facets and tags to filter and analyze data more efficiently. This can help reduce the volume of logs you need to process.
By implementing these strategies, you can optimize your log management approach while maintaining visibility into your systems and staying within budget.
How do I set up custom log processing rules in Datadog to get the most valuable insights?
To customize log processing rules in Datadog, start by navigating to the Log Configuration section in your Datadog account. From there, you can define parsing rules, create exclusion filters, and apply tags to organize your logs effectively. These rules help you extract the most relevant insights by focusing on the data that matters most to your team.
For small teams with limited resources, it’s crucial to prioritize key log sources and streamline your setup. By tailoring your log processing rules, you can reduce noise, improve system performance, and ensure your team has actionable information at their fingertips. Remember to test your configurations regularly to confirm they are delivering the insights you need.


