Install Datadog Agent with Docker Compose
Learn to effortlessly set up the Datadog Agent with Docker Compose for comprehensive monitoring of applications and systems.
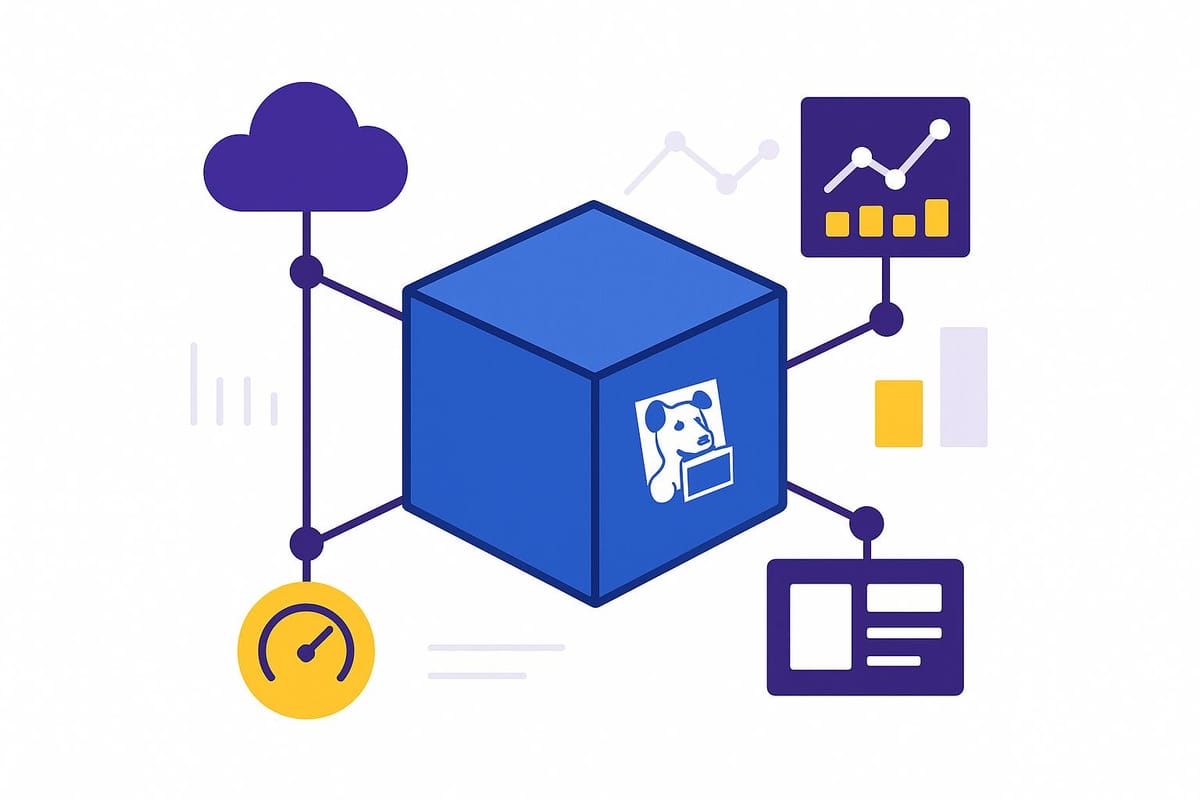
Want to monitor your applications and systems with ease? Using Docker Compose, you can quickly set up the Datadog Agent to track metrics, logs, and performance data in just a few steps. Here's how to get started:
- Prerequisites: Install Docker and Docker Compose, and get your Datadog API key.
- Setup: Create a
docker-compose.ymlfile to deploy the Datadog Agent as a container. - Configuration: Add environment variables for your API key, enable features like log collection and APM, and configure volume mounts for host-level metrics.
- Autodiscovery: Use Docker labels to automatically monitor dynamic services like Redis or PostgreSQL.
- Deployment: Start the Agent with
docker-compose up -dand verify its status with simple commands.
This setup is ideal for small and medium-sized businesses, starting at $15 per host per month (billed annually). With features like auto-scaling and real-time monitoring, you’ll have everything you need to keep your systems running smoothly. Ready to dive in? Let’s break it down step-by-step.
Autodiscovery with Docker Labels updated for Agent v6
Prerequisites for Installing Datadog Agent
Before diving into the installation process, make sure your environment is properly set up with the required tools and credentials. Taking care of these steps beforehand will save you time and help ensure everything runs smoothly.
Install Docker and Docker Compose
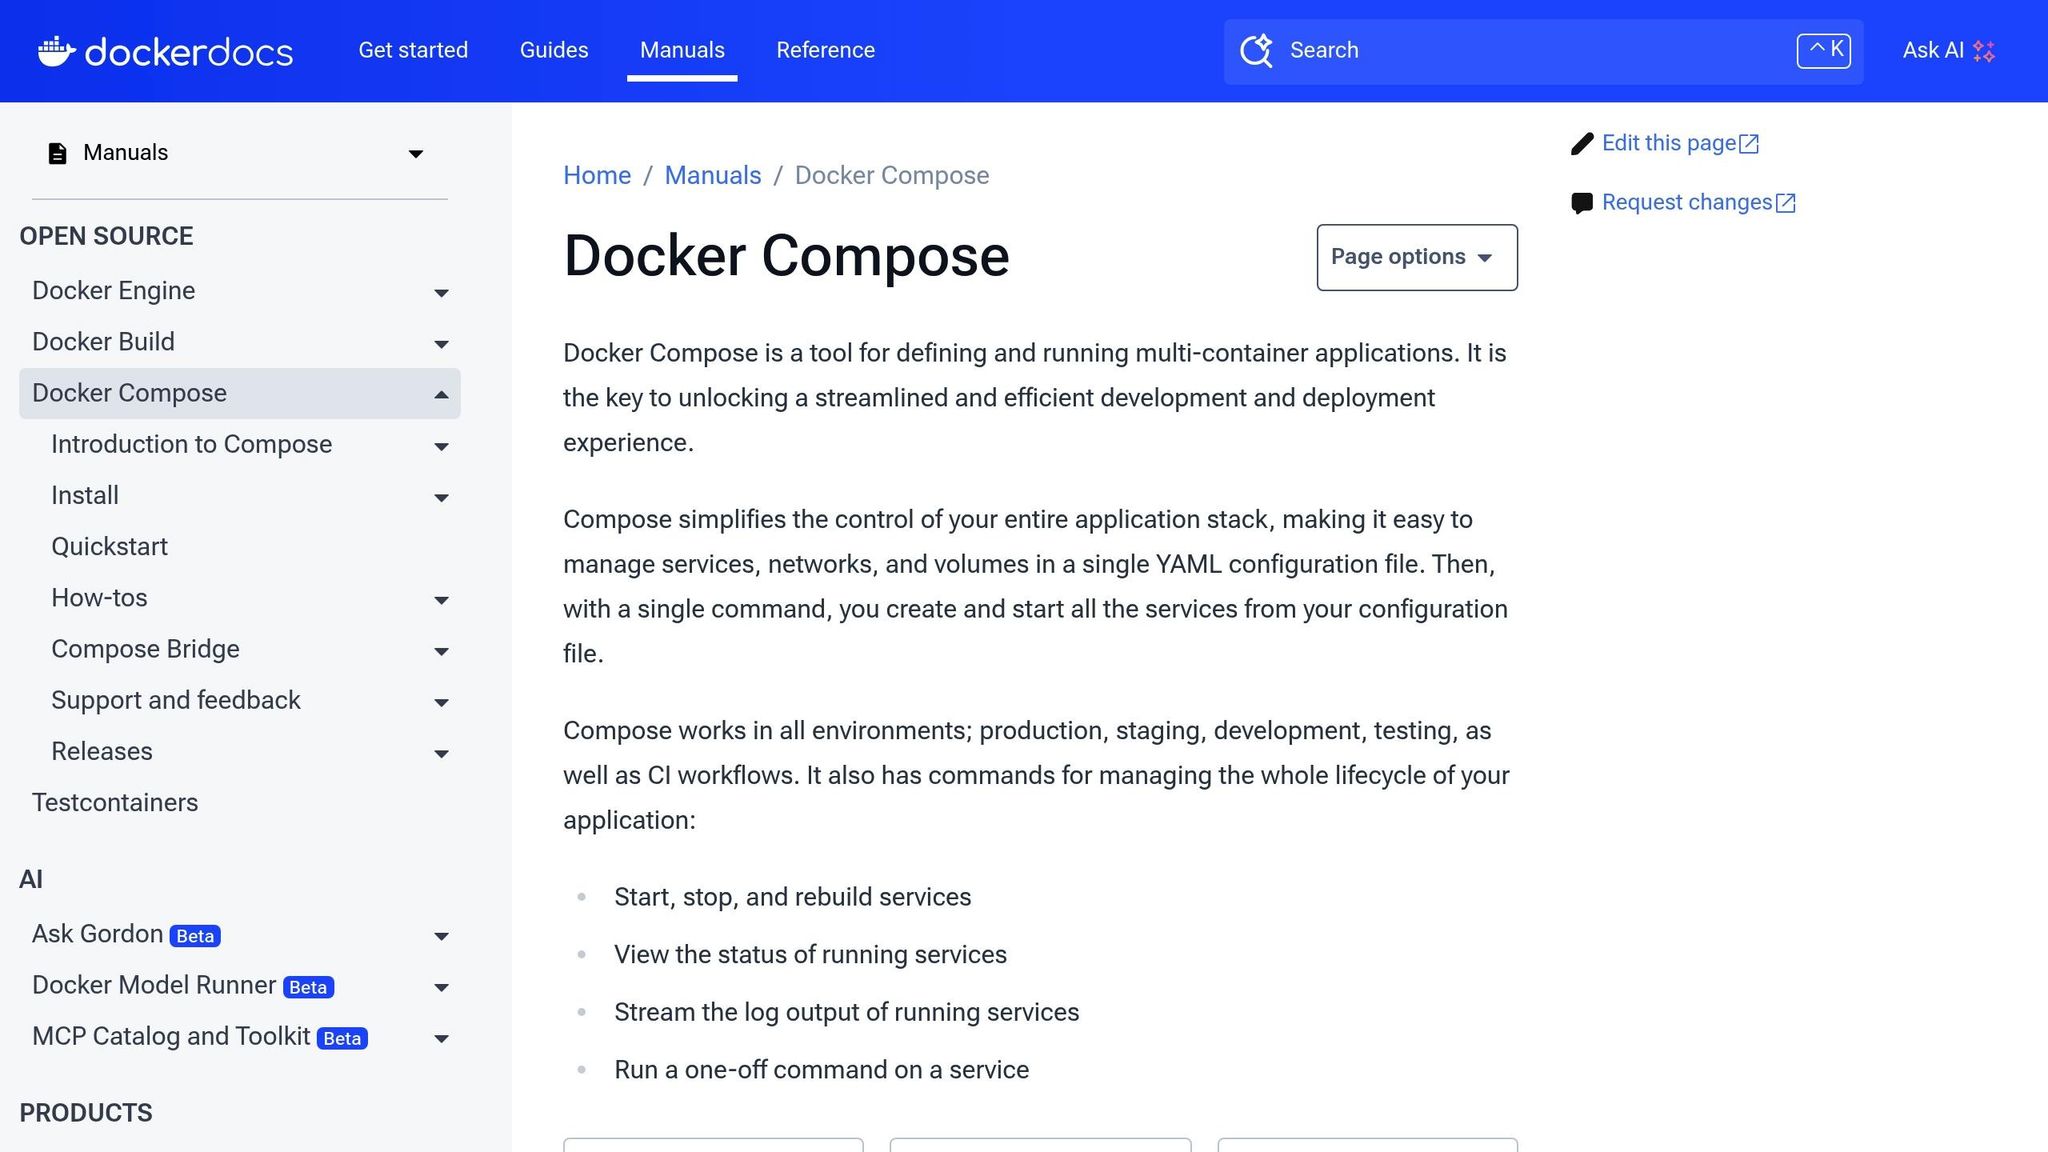
Docker and Docker Compose form the backbone of this setup, enabling you to run the Datadog Agent as a containerized service.
Start by checking if Docker is installed and running on your system. Open your terminal and type:
docker --version
This command should display the installed Docker version. If Docker isn’t installed, head over to the official Docker website, download the installer for your operating system, and follow the provided instructions.
Next, verify that Docker Compose is installed by running:
docker-compose --version
If you don’t see a version number, you may need to install Docker Compose separately. However, most modern Docker installations include it by default.
Make sure the Docker daemon is up and running before proceeding. On Windows and macOS, this typically involves starting Docker Desktop. For Linux users, you may need to start the Docker service manually with:
sudo systemctl start docker
Once both Docker and Docker Compose are confirmed to be working, you can move on to obtaining your Datadog API key.
Get Your Datadog API Key
The Datadog API key is a critical piece for connecting your agent to your Datadog account. Without it, the agent won’t be able to send any data.
To get your API key, log in to your Datadog account and navigate to Organization Settings > API Keys. Click on "New Key" to generate one. Use a descriptive name that reflects its purpose, such as "Docker-Compose-Production" or "Development-Environment-Agent."
Keep your API key safe by storing it in an environment variable. Create a file named .env in your project directory and add the key like this:
DATADOG_API_KEY=your_actual_api_key_here
For security purposes, it’s a good idea to rotate your API keys periodically to reduce the risk of exposure.
Once your API key is secured, make sure your system meets the basic requirements.
Check System Requirements
The Datadog Agent is designed to operate efficiently with minimal resource usage. Under normal conditions, it typically uses around 0.08% of your CPU.
With these steps completed, you’re all set to configure your Docker Compose file and proceed with the installation.
Creating the Docker Compose Configuration
Now that you have Docker, Docker Compose, and your API key ready, it's time to set up the docker-compose.yml file. This file outlines how the Datadog Agent will integrate with your services for monitoring.
Set Up the Datadog Agent Container
Start by creating a file named docker-compose.yml in your project directory. Use the official datadog/agent image, which comes equipped with essential monitoring tools:
version: '3.8'

services:
  datadog-agent:
    image: datadog/agent:latest
    container_name: datadog-agent
    restart: unless-stopped
The restart: unless-stopped policy ensures the agent will automatically restart if it crashes or when your system reboots, keeping your monitoring uninterrupted. While the latest tag ensures you’re using the most up-to-date version, you can also specify a particular version for consistency.
Next, you'll need to set up environment variables to connect the Datadog Agent to your account.
Add Environment Variables
Environment variables are critical for linking the Datadog Agent to your account and defining what data to monitor. The most essential ones are DD_API_KEY and DD_SITE.
Update your configuration to include these variables:
services:
  datadog-agent:
    image: datadog/agent:latest
    container_name: datadog-agent
    restart: unless-stopped
    environment:
      - DD_API_KEY=${DATADOG_API_KEY}
      - DD_SITE=datadoghq.com
      - DD_LOGS_ENABLED=true
      - DD_APM_ENABLED=true
      - DD_PROCESS_AGENT_ENABLED=true
      - DD_DOCKER_LABELS_AS_TAGS=true
The DD_API_KEY variable pulls its value from a .env file to keep sensitive information secure. Set DD_SITE to match your Datadog region - use datadoghq.com for US1, datadoghq.eu for EU, or us3.datadoghq.com for US3.
Additional environment variables like DD_LOGS_ENABLED=true enable log collection, while DD_APM_ENABLED=true activates application performance monitoring. Using DD_DOCKER_LABELS_AS_TAGS=true automatically converts Docker labels into Datadog tags, helping you organize and filter metrics with ease.
With the environment variables in place, the next step is to configure volume mounts and networking.
Set Up Volume Mounts and Networking
To ensure the Datadog Agent can access host-level metrics, you'll need to define volume mounts. These mounts allow the agent to monitor system processes, Docker containers, and cgroup data.
Here’s how you can configure it:
services:
  datadog-agent:
    image: datadog/agent:latest
    container_name: datadog-agent
    restart: unless-stopped
    environment:
      - DD_API_KEY=${DATADOG_API_KEY}
      - DD_SITE=datadoghq.com
      - DD_LOGS_ENABLED=true
      - DD_APM_ENABLED=true
      - DD_PROCESS_AGENT_ENABLED=true
      - DD_DOCKER_LABELS_AS_TAGS=true
    volumes:
      - /var/run/docker.sock:/var/run/docker.sock:ro
      - /proc/:/host/proc/:ro
      - /sys/fs/cgroup/:/host/sys/fs/cgroup:ro
      - /var/lib/docker/containers:/var/lib/docker/containers:ro
    networks:
      - datadog-network

networks:
  datadog-network:
    driver: bridge
- Docker Socket Access: The
/var/run/docker.sock:/var/run/docker.sock:romount lets the agent monitor Docker containers and collect container metrics. The:roflag ensures the access is read-only for added security. - Process Data: The
/proc/:/host/proc/:romount provides the agent with visibility into process-level metrics like CPU and memory usage. - Cgroup Data: The
/sys/fs/cgroup/:/host/sys/fs/cgroup:romount allows the agent to gather resource usage data from containerized environments. - Log Collection: By mounting
/var/lib/docker/containers:/var/lib/docker/containers:ro, the agent can access and collect logs from your containers.
Finally, creating a dedicated network (datadog-network) ensures the Datadog Agent can communicate with your other services while maintaining network isolation. This setup allows for automatic service discovery and secure monitoring.
With all these components in place, your docker-compose.yml file is ready to provide comprehensive monitoring for your containerized infrastructure. It balances functionality, security, and visibility, offering a reliable way to track and manage your system's performance.
Configuring Agent Integrations and Autodiscovery
Setting up Autodiscovery allows you to automatically detect and monitor your containerized services. This feature eliminates the hassle of manually configuring monitoring for each service, which is especially useful in environments where containers are constantly starting and stopping.
Autodiscovery relies on templates that define how the Datadog Agent monitors specific services. The Agent tracks active services and adjusts monitoring configurations as containers come and go.
Enable Autodiscovery
To enable Autodiscovery, you can use Docker labels. These labels let the Datadog Agent identify your containers and apply the right monitoring setup.
For example, here's how you can configure a Redis container with Autodiscovery labels:
services:
  redis:
    image: redis:latest
    labels:
      - "com.datadoghq.ad.check_names=[\"redisdb\"]"
      - "com.datadoghq.ad.init_configs=[{}]"
      - "com.datadoghq.ad.instances=[{\"host\":\"%%host%%\",\"port\":\"%%port%%\"}]"
    networks:
      - datadog-network

  datadog-agent:
    # ... your existing agent configuration
In this setup, the labels prefixed with com.datadoghq.ad. define Autodiscovery settings. Placeholders like %%host%% and %%port%% are automatically replaced with the container's actual IP address and port.
For PostgreSQL, you can include authentication details in the configuration:
services:
  postgres:
    image: postgres:13
    environment:
      POSTGRES_PASSWORD: mypassword
    labels:
      - "com.datadoghq.ad.check_names=[\"postgres\"]"
      - "com.datadoghq.ad.init_configs=[{}]"
      - "com.datadoghq.ad.instances=[{\"host\":\"%%host%%\",\"port\":\"%%port%%\",\"username\":\"postgres\",\"password\":\"mypassword\"}]"
    networks:
      - datadog-network
If you're monitoring services that require JMX (like Kafka or Cassandra), make sure to use a JMX-enabled image and set SD_JMX_ENABLE=yes.
The Datadog Agent follows a specific order when looking for Autodiscovery templates: it checks Kubernetes annotations first, then key-value stores, and finally files. This hierarchy ensures dynamic configurations take priority over static ones.
To get a more complete view of your applications, you can also integrate log collection alongside metrics.
Set Up Log Collection
Log collection provides deeper insights into your application’s behavior and can help with troubleshooting. If you’ve already enabled DD_LOGS_ENABLED=true in your Agent configuration, the next step is to configure individual services to send their logs to Datadog.
Here’s an example of adding log configuration labels to services:
services:
  nginx:
    image: nginx:latest
    labels:
      - "com.datadoghq.ad.logs=[{\"source\":\"nginx\",\"service\":\"web-server\"}]"
    networks:
      - datadog-network

  app:
    image: myapp:latest
    labels:
      - "com.datadoghq.ad.logs=[{\"source\":\"python\",\"service\":\"my-application\",\"log_processing_rules\":[{\"type\":\"multi_line\",\"name\":\"log_start_with_date\",\"pattern\":\"\\\\d{4}-(0?[1-9]|1[012])-(0?[1-9]|[12][0-9]|3[01])\"}]}]"
    networks:
      - datadog-network
In this configuration:
- The
sourceattribute tells the Datadog Agent which parsing rules to apply. - The
serviceattribute groups logs by application. - For multi-line logs, such as stack traces, you can use
log_processing_rulesto handle them correctly.
For applications that write logs to stdout or stderr, Docker captures these streams, making them accessible through mounted volumes. If your services write logs to files instead, you’ll need to mount the log directories:
services:
  app-with-file-logs:
    image: myapp:latest
    volumes:
      - ./app-logs:/var/log/myapp
    labels:
      - "com.datadoghq.ad.logs=[{\"source\":\"python\",\"service\":\"file-logger\",\"path\":\"/var/log/myapp/*.log\"}]"
    networks:
      - datadog-network
In this case, the path attribute should match the internal directory structure of the container.
Deploying and Checking the Datadog Agent
Set up the Datadog Agent and confirm that it’s running smoothly. This involves starting the necessary containers and performing checks to ensure everything is connected and functioning as expected.
Start the Agent with Docker Compose
Getting the Datadog Agent up and running with Docker Compose is simple. Navigate to the directory where your docker-compose.yml file is located, then use the following command to start the services:
docker-compose up -d
The -d flag runs the containers in detached mode, meaning they’ll continue running in the background. If the required Docker images aren’t already on your system, this command will pull them automatically before starting the services. Once the Agent starts, it connects to Datadog’s servers.
To confirm the containers are running, you can use the following command:
docker ps
If you need to restart the Agent later, you can reference the full path to your docker-compose.yml file like this:
docker-compose -f /opt/datadog/docker-compose.yml up -d
After starting the Agent, it’s time to verify that everything is functioning as it should.
Check Agent Status
Once the Agent is deployed, it’s important to confirm it’s operational and communicating with Datadog. Use the commands below to check the Agent’s status and troubleshoot if needed.
| Check | Command | Expected Result |
|---|---|---|
| Container is running | `docker ps | grep datadog-agent` |
| Check logs for errors | docker logs --tail 50 datadog-agent |
No authentication or connection errors |
| Verify API key | `docker exec -it datadog-agent env | grep DD_API_KEY` |
| Test Datadog connectivity | docker exec -it datadog-agent sh -c 'curl -v "https://api.datadoghq.com/api/v1/validate?api_key=$DD_API_KEY"' |
Response: 200 OK |
| Check network reachability | docker exec -it datadog-agent curl -v https://app.datadoghq.com |
Successful connection |
| Ensure metrics are sent | `docker exec -it datadog-agent agent status | grep -A10 "Forwarder"` |
| Send a test metric | docker exec -it datadog-agent agent telemetry send test.metric 1 |
Metric appears in Datadog UI |
Start by ensuring the Agent container is active. Use the docker ps command to verify that the container is up and running. If it’s not listed, something went wrong during the startup process.
Next, review the logs for any issues like connection errors or API key authentication failures. The logs provide detailed information about what might be preventing the Agent from functioning properly.
API key validation is critical. If the API key is incorrect or missing, the Agent won’t be able to send data to Datadog. Running the environment variable check ensures the key is set correctly within the container.
For connectivity testing, the curl command checks whether the Agent can communicate with Datadog’s servers. A successful test will return a 200 OK status. If you see a 403 Forbidden error, it usually means the API key is incorrect. Network-related errors, on the other hand, may indicate DNS issues or connectivity problems.
The Forwarder status confirms that metrics and logs are being sent to Datadog. Look for a message like "Transactions flushed: successfully: X, errors: 0" to verify that data is flowing without issues.
Finally, use the telemetry command to send a test metric. After running the command, open your Datadog dashboard, go to Metrics Explorer, and search for test.metric. If everything is working, the metric should appear within a couple of minutes.
If any of these checks fail, you can restart the Agent with the following command:
docker-compose -f /opt/datadog/docker-compose.yml restart datadog-agent
Then review the logs to pinpoint and resolve any errors.
Fixing Common Issues
When working with Datadog, you might run into problems like container startup failures, authentication hiccups, or missing data. Here’s a practical guide to troubleshoot and address these common challenges. Start by identifying whether the issue is related to container startup, authentication, or data collection, and then use the targeted solutions below.
Fix Container Startup Problems
If your container isn’t starting, the first step is to check the logs for clues. Run this command:
docker logs --tail 50 datadog-agent
Review the logs for errors such as syntax issues in configuration files, missing environment variables, or dependency problems. To rule out YAML formatting errors, validate your docker-compose.yml file using an online YAML validator. Also, double-check that all volume paths and required environment variables are correctly defined.
Another common issue is hostname detection failures. This happens when Docker assigns dynamic hostnames that frequently change. To fix this, set a static hostname in your Docker Compose configuration:
services:
  datadog-agent:
    hostname: your-server-name
    environment:
      - DD_HOSTNAME=your-server-name
Additionally, if your setup requires a proxy, configure it using these environment variables:
environment:
  - DD_PROXY_HTTP=http://proxy-server:port
  - DD_PROXY_HTTPS=https://proxy-server:port
Solve Authentication and Connection Problems
For authentication errors, start by verifying your API key. Use this command to check if the key is correctly set:
docker exec -it datadog-agent env | grep DD_API_KEY
If the API key is missing or appears incomplete, update your docker-compose.yml file with the correct key from your Datadog account dashboard.
Site configuration issues can also cause authentication failures. For example, a Stack Overflow user in July 2024 encountered a 403 Forbidden error while using the datadog-api-client-go package. The issue was resolved by changing the DD_SITE environment variable from "datadoghq.com" to "datadoghq.eu" to match their Datadog site.
To avoid similar problems, ensure the DD_SITE variable matches your account’s region:
- For EU accounts, set
DD_SITE=datadoghq.eu. - For US accounts, use
DD_SITE=datadoghq.comor leave the variable unset (it defaults to the US site).
Test your API key with this command:
docker exec -it datadog-agent sh -c 'curl -v "https://api.datadoghq.com/api/v1/validate?api_key=$DD_API_KEY"'
A successful response will return 200 OK. If you get a 403 Forbidden error, the API key is incorrect or lacks the necessary permissions. Generate a new API key from your Datadog account dashboard and update your configuration.
If authentication issues persist, test your network connectivity to Datadog’s servers:
docker exec -it datadog-agent curl -v https://app.datadoghq.com
If this fails, check your firewall settings to ensure outbound HTTPS traffic is allowed. You may need to open specific outbound connections with a command like:
sudo ufw allow out to api.datadoghq.com
Fix Missing Metrics or Logs
If your metrics or logs aren’t showing up, start by checking the Forwarder status:
docker exec -it datadog-agent agent status | grep -A10 "Forwarder"
Look for any errors and address them by verifying network connectivity, API key accuracy, and outbound HTTPS traffic permissions.
For missing logs or metrics, confirm that log collection is enabled and that Docker labels for autodiscovery are correctly applied. To test data transmission, send a manual metric:
docker exec -it datadog-agent agent telemetry send test.metric 1
Then, check your Datadog dashboard in the Metrics Explorer for test.metric. If it doesn’t appear within a few minutes, there may be a connectivity or configuration issue.
Finally, restart the Agent to apply any changes and monitor the logs for additional errors:
docker-compose -f /opt/datadog/docker-compose.yml restart datadog-agent
Keep an eye on the startup logs to identify any lingering configuration problems.
Conclusion: Building a Monitoring Foundation for SMBs
By setting up the Datadog Agent with Docker Compose, small and medium-sized businesses can establish a solid monitoring system that adapts to their growth. In this guide, you’ve explored how to install prerequisites, configure the agent, enable autodiscovery, and troubleshoot common issues. Using a containerized approach not only simplifies deployment but also makes managing monitoring tools more efficient.
There are several advantages to building your setup with Docker Compose. It automates repetitive tasks, reduces the chances of configuration errors, and optimizes resource usage with lightweight containers. Plus, it allows you to replicate setups consistently across development, staging, and production environments.
The stakes for real-time monitoring are high. Downtime can cost businesses over $200,000 per hour, making proactive monitoring critical to catching issues early and preventing them from escalating.
"Having real-time monitoring allows you to track performance over time to finely tune your network for ideal performance levels. With enough time passed, it also allows you to prepare for anticipated network spikes, such as Cyber Monday shopping." - Anthony Petecca, Vice President of Technology, Health Street
Beyond preventing downtime, monitoring can reveal cost-saving opportunities. For instance, in 2023, Finout, a financial services firm, leveraged Datadog’s analytics to identify areas for savings, cutting costs by as much as 30%.
Datadog is designed to scale with your business. Nearly 25% of companies rely on Datadog to monitor their applications. Its auto-discovery feature makes scaling seamless, automatically detecting new containers as they’re added. Starting with the Pro plan at $15 per host per month (billed annually), you get 10 containers per host and 15-month metric retention. This ensures your monitoring setup grows alongside your infrastructure.
Your Docker Compose setup offers the flexibility to integrate new tools, tweak configurations, and expand your monitoring coverage as your needs evolve. Start small and scale gradually, balancing expertise development with cost management.
For SMBs looking to fine-tune their Datadog setup further, check out Scaling with Datadog for SMBs for expert advice and actionable tips.
FAQs
What are the benefits of installing the Datadog Agent using Docker Compose for small and medium-sized businesses?
Installing the Datadog Agent with Docker Compose brings a host of benefits, especially for small and medium-sized businesses (SMBs). One of the standout advantages is its simplicity. With a single YAML file, you can define and manage services, making it much easier to deploy the Datadog Agent alongside your other applications. This streamlined approach saves time and reduces complexity - perfect for teams that may have limited resources.
Another big plus is the consistency it offers across different environments. Using Docker Compose, SMBs can replicate their monitoring setup seamlessly across development, testing, and production stages. This ensures the Datadog Agent operates reliably and delivers uniform results, making it easier to monitor and troubleshoot systems. By simplifying deployment and ensuring uniformity, Docker Compose helps SMBs keep their infrastructure efficient and their applications running smoothly.
What should I do if the Datadog Agent won’t start or isn’t sending metrics?
If the Datadog Agent isn’t starting or sending metrics, try these troubleshooting steps:
-
Confirm if the Agent is running: On Linux, run
sudo systemctl status datadog-agentto check its status. For Windows, open the Services panel and look for the Datadog Agent. If it’s not running, restart it usingsudo systemctl restart datadog-agenton Linux or the equivalent command on your system. -
Examine the logs: Check the Agent logs for errors. On Linux, logs are located at
/var/log/datadog/agent.log. On Windows, you’ll find them atC:\ProgramData\Datadog\logs\agent.log. -
Validate the configuration: Open the
datadog.yamlfile (found in/etc/datadog-agent/on Linux) and ensure there are no syntax errors or missing fields. Using a YAML validator can help identify any formatting issues. - Check connectivity: Verify that the API key is correctly set in the configuration file. Also, ensure that ports 443 and 8125 are open so the Agent can communicate with Datadog.
If these steps don’t resolve the problem, reach out to Datadog support for additional help.
How can I use Docker labels to automatically monitor services like Redis or PostgreSQL with Datadog?
To monitor services like Redis or PostgreSQL automatically with Datadog, you can use Autodiscovery by adding Docker labels. Here's a quick guide:
-
Add Docker labels to your containers in the
docker-compose.ymlfile. For instance, to monitor Redis, include the following:
These labels tell the Datadog Agent how to monitor the Redis service.labels: com.datadoghq.ad.check_names: '["redisdb"]' com.datadoghq.ad.init_configs: '[{}]' com.datadoghq.ad.instances: '[{"host":"%%host%%","port":6379}]' -
Configure the Datadog Agent in the same
docker-compose.ymlfile. Make sure the Agent can access container metadata by mounting the Docker socket:datadog: image: datadog/agent:latest volumes: - /var/run/docker.sock:/var/run/docker.sock -
Launch your Docker stack with
docker-compose up. The Datadog Agent will automatically detect and monitor any services with the specified labels.
By using this method, you can streamline monitoring tasks, as services are dynamically discovered and configured without manual setup.

