Integrating Datadog with Vercel: Logs and Metrics for Edge Functions
Learn how to effectively monitor Edge Functions with Datadog integration for enhanced performance and long-term log storage.
Want to monitor your Vercel Edge Functions effectively? Pair them with Datadog. Here's why and how:
- Why It Matters: Edge functions are fast, cost-effective, and scalable. But their distributed nature makes monitoring tricky.
- Key Benefits of Datadog Integration:
- Long-term log storage beyond Vercel's 1-hour limit.
- Real-time error tracking and performance metrics.
- Insights into frontend metrics like Largest Contentful Paint.
- Setup Summary:
- Configure environment variables (5KB limit for Edge Functions).
- Use Vercel's Log Drains to stream logs to Datadog.
- Track metrics like response time, memory usage, and regional performance.
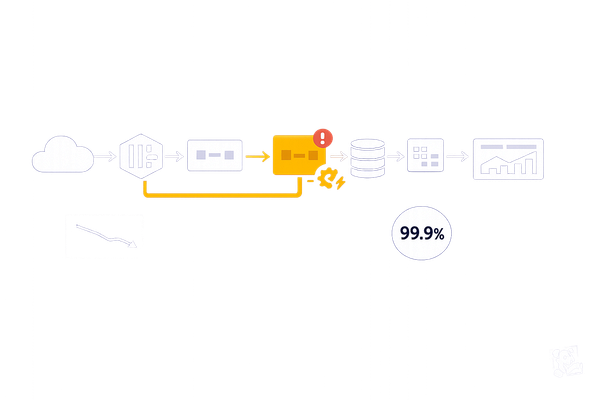
- Cost Savings: Generate 1 million images with edge functions for 15x less than traditional serverless options.
Quick Setup Steps:
- Secure API keys in Vercel's environment variables.
- Sync configurations using
vercel env pull. - Forward logs to Datadog via Vercel's Log Drains.
- Create dashboards to track performance, errors, and resource usage.
Start monitoring smarter and optimize your Edge Functions today.
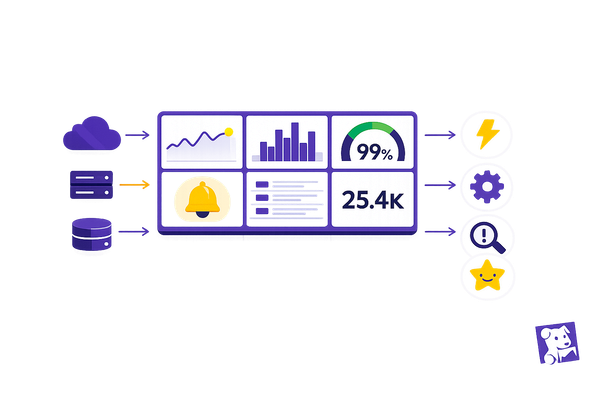
Introducing Vercel Monitoring and Logs
Setup Steps
Getting Datadog monitoring up and running for your Vercel edge functions involves a few key configuration steps.
Vercel Configuration
Start by understanding the environment variable limits for Vercel edge functions. These functions have a strict cap of 5KB per variable.
| Environment Type | Variable Limit | Details |
|---|---|---|
| Edge Functions | 5KB per variable | Applies to the edge runtime |
| Standard Functions | 64KB total | Used for Node.js, Python, Ruby, and Go |
| Production | All variables | Encrypted at rest for security |
| Preview/Development | Selective variables | Configured based on deployment needs |
Once you're familiar with these limits, configure your development environment to ensure accurate monitoring.
Environment Setup
-
Set encrypted environment variables at the team or project level
Securely store sensitive information like API keys or tokens. -
Define Deployment Environments
Configure the following environments based on your workflow:- Production: Live deployment.
- Preview: For testing purposes.
- Development: Local development environment.
- Custom: Optional, for additional use cases.
Note: Any changes to environment variables require a new deployment.
After setting up the variables, run the command vercel env pull to sync the latest configuration into your local .env file.
With this setup complete, the next step is to verify the integration.
Integration Check
To ensure everything is working as expected, focus on these key verification points:
| Verification Point | What to Check | Expected Outcome |
|---|---|---|
| Log Streaming | Log Explorer | Active log flow from edge functions |
| Error Tracking | Error codes | Errors grouped by endpoint URL |
| Performance Metrics | Browser tests | Insights into frontend performance |
Here’s how to confirm your setup:
- Open the Log Explorer to verify that logs are streaming from your edge functions.
- Check for error logs grouped by endpoint URLs to easily identify and address issues.
- Review performance metrics, such as memory usage and user location, to diagnose potential bottlenecks.
For more advanced monitoring, consider adding custom function logs to capture critical business-related data.
Log Management
Log Structure Guidelines
To manage logs effectively for Vercel edge functions, start by structuring them with the following key components:
| Log Component | Description | Example Format |
|---|---|---|
| Timestamp | A UTC timestamp to ensure global consistency. | 2025-05-12T14:30:00Z |
| Function ID | A unique identifier for each edge function. | edge_func_123abc |
| Log Level | The severity of the log entry. | INFO, ERROR, WARN |
| Request Context | Details about the request, such as path, method, and region. | {path, method, region} |
| Performance Data | Metrics like execution duration and memory usage. | {duration_ms, memory_mb} |
Once your logs are structured, the next step is setting up log drains to forward them to tools like Datadog for further analysis.
Log Drain Setup
-
Access the Log Drains Section in Vercel
Go to the Vercel dashboard, then navigate to Team Settings > Log Drains. Note that this feature is available only for Pro and Enterprise plans. -
Select Source and Format
Choose "Edge" as the log source to capture edge function data. Depending on your processing requirements, pick either JSON or NDJSON format. -
Secure the Transmission
Set up a custom secret to authenticate logs using thex-vercel-signatureheader. This ensures secure log transmission.
Log Pipeline Creation
Design your log pipeline to process logs efficiently by applying specific filters:
| Filter Type | Purpose | Configuration |
|---|---|---|
| Environment | Distinguish between production and preview logs. | Select "Production" or "Preview". |
| Sampling Rate | Adjust the volume of logs being processed. | Set a percentage (e.g., 10%-100%). |
| Source Filter | Focus specifically on edge function logs. | Set the source type to "Edge". |
To configure your log pipeline:
- Adjust sampling rates and environment filters to control log volume and separate production logs from preview logs.
- Add custom headers to define authentication details and specify the content type.
Metric Tracking
Essential Metrics
Keep an eye on these performance indicators to ensure your system runs smoothly:
| Metric Category | Key Metrics | Description |
|---|---|---|
| Request Performance | - Response time (ms) - Request count - Error rate |
Tracks how quickly responses are delivered, the volume of requests, and any errors encountered. |
| Resource Usage | - Memory utilization - CPU usage - Cold starts |
Measures the consumption of computational resources and the frequency of cold starts. |
| Geographic Data | - Regional latency - Geographic distribution - Edge location performance |
Evaluates performance across different regions and edge locations. |
Once you’ve covered the basics, you can dive deeper by setting up custom metrics tailored to your specific needs.
Custom Metric Setup
To capture more specific data, define log attributes that align with your business goals. For example:
console.log(JSON.stringify({
  metric_name: 'edge_function_performance',
  execution_time: 156,
  memory_used: 128,
  region: 'us-east-1'
}));
This approach allows you to transform raw log data into actionable metrics. Once logged, categorize and tag the data to integrate it into dashboards for better visualization.
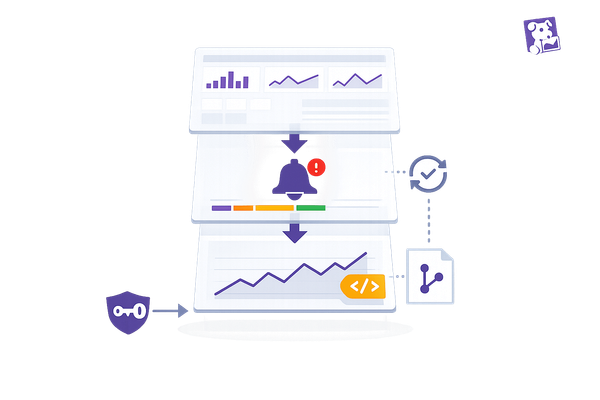
Dashboard Creation
Dashboards make it easier to monitor and analyze edge function performance. Here’s how you can structure them:
- Performance Overview: Track trends in request volume, average response times, error rates by endpoint, and request patterns across regions.
- Resource Utilization: Visualize memory usage, CPU utilization, cold start occurrences, and function execution times.
- Error Tracking: Identify issues by filtering logs for specific error codes, grouping errors by endpoint, and correlating them with deployment regions.
These dashboards provide a clear view of system health and help pinpoint areas for improvement.
Monitoring Guidelines
Startup Speed Management
Datadog's Cold Start Tracing uses flame graphs to pinpoint delays during initialization. To optimize startup speed, focus on the following areas:
- Track Dependency Loading: Use the
aws.lambda.loadspan duration to monitor how long dependencies take to load. - Eliminate Unused Libraries: Identify and remove libraries that aren't being used to reduce unnecessary overhead.
- Implement Lazy Loading: Load non-critical modules only when needed to streamline the initialization process.
- Monitor Memory Allocation: Keep an eye on how memory allocation impacts startup time.
Including multiple versions of the same library can add up to 400ms to cold start times. After addressing these issues, compare performance across different regions to fine-tune your deployment strategy.
Location-Based Analysis
Monitoring performance by region ensures users have a consistent experience no matter where they are. Create dashboards tailored to specific regions and track the following metrics:
| Metric Type | Key Indicators | Action Threshold |
|---|---|---|
| Latency | Response time by region | Variance greater than 100ms |
| Error Rates | Regional failure patterns | More than 1% difference |
| Resource Usage | Memory/CPU by location | Utilization over 80% |
By analyzing regional performance variations and linking them to deployment events or spikes in traffic, you can optimize the placement of edge functions and allocate resources more effectively. These insights should directly inform your alerting strategy.
Alert Configuration
Use performance data to set up alerts that catch problems early, minimizing user impact. Here's how:
-
Performance Alerts
- Set thresholds for response times that exceed your baseline metrics.
- Keep an eye on memory usage and detect anomalies in cold start behavior.
-
Error Detection
- Use Log Explorer to filter errors by endpoint.
- Configure alerts for error rates that surpass 1% of total requests.
-
Resource Monitoring
- Set tiered alerts for memory usage:
- Warning: Trigger at 70% usage.
- Critical: Trigger at 85% usage.
- Emergency: Trigger at 95% usage.
- Convert log insights into metrics to create composite alerts. This approach reduces alert fatigue while ensuring you maintain a clear view of system health.
- Set tiered alerts for memory usage:
Next Steps
Take full advantage of the Datadog–Vercel integration by incorporating Pino-generated JSON logs to simplify troubleshooting. Back in October 2021, FLOWN Tech demonstrated this by using the query @proxy.host:flown.com status:error to monitor production issues effectively.
Here are a few ways to refine your monitoring setup:
-
Smarter Log Analysis
Use Datadog Pipelines to categorize log levels, enabling more accurate filtering and alerting. This makes it easier to pinpoint troublesome endpoints. -
Track Frontend Performance
Add Datadog Synthetic tests to your deployment pipeline. These automated browser tests ensure that critical user journeys are monitored and performing as expected. -
Streamlined Communication
Create a dedicated Slack channel for Datadog alerts to get real-time notifications. Pair this with customized Datadog views and monitors to keep your team informed and ready to act.
These approaches align well with Datadog's logging capabilities:
"Vercel Serverless Functions emit two types of logs. Request logs provide HTTP request data for calls to your functions... Application logs (e.g., output to
console.log) let you collect additional custom log data to help test and debug your functions..." - Datadog
Incorporate these practices into your dashboards to gain a clearer and more comprehensive view of your system.
FAQs
How does integrating Datadog with Vercel improve monitoring for edge functions?
Integrating Datadog with Vercel takes monitoring for edge functions to the next level by offering a clearer view of performance metrics and system behavior. With Datadog, you can track detailed logs like HTTP response codes, request durations, and memory usage - data that Vercel alone doesn't provide in full.
Beyond just capturing logs, Datadog allows for long-term storage, advanced visualizations of performance data, and proactive monitoring using browser tests. This combination gives you the tools to fine-tune your Vercel-powered edge functions, ensuring they perform at their best while giving you more control and visibility.
How can I set up environment variables and log drains to integrate Datadog with Vercel for monitoring edge functions?
To connect Datadog with Vercel and keep tabs on your edge functions, you'll need to tweak some settings, specifically environment variables and log drains. Here's how to get started:
-
Set Up Environment Variables: Head to your Vercel project settings and add the necessary Datadog configuration values. At a minimum, you'll need your
DATADOG_API_KEY. Depending on your Datadog setup, you might also need region-specific details. - Add a Log Drain: Configure a log drain in Vercel to send logs directly to Datadog. This involves providing the Datadog HTTP endpoint and any required authentication details. This step ensures that your Vercel logs are routed to Datadog for monitoring.
Once everything is in place, Datadog will automatically gather logs and metrics from your Vercel edge functions. This setup provides a clear view of your system's performance and health. Double-check your configurations to ensure everything is secure and working as expected.
How can I use Datadog to improve the performance and cost-efficiency of my Vercel edge functions across various regions?
To get the most out of your Vercel edge functions while keeping costs in check, consider these practical tips with Datadog:
- Track Key Metrics: Use Datadog to monitor essential performance indicators like startup times, cold starts, and API latency. This helps you pinpoint slowdowns and make adjustments for smoother execution.
- Choose Strategic Locations: Place your edge functions in regions close to your users or data sources. This reduces latency and ensures quicker response times.
-
Implement Caching: Use caching methods such as
Cache-Controlheaders to store responses for repeat visitors. This reduces unnecessary processing, speeds up delivery, and cuts costs. - Tap Into Edge Networks: Leverage Vercel's global edge network to serve cached content swiftly and consistently to users no matter where they are.
By pairing Datadog's monitoring tools with Vercel's infrastructure, you can gain valuable insights into your edge functions and make informed decisions to enhance their performance and efficiency.