Kubernetes Network Policies: Best Practices
Enforce default-deny, precise allow-lists, egress controls, and monitoring to secure Kubernetes pods and meet compliance.

Kubernetes Network Policies are essential for securing communication between pods in your cluster. By default, Kubernetes allows unrestricted traffic, which can lead to security risks like lateral movement in the event of a breach. This article outlines how to implement Network Policies to enforce zero-trust principles and limit communication to only what’s necessary.
Key Takeaways:
- Default-Deny Policy: Start by blocking all traffic (ingress and egress) unless explicitly allowed.
- Precise Rules: Use pod labels, namespace selectors, and IP blocks to define specific communication paths.
- Segmentation Strategies: Separate workloads by namespace, environment, or application tier to reduce risks.
- Egress Control: Limit outbound traffic to approved services and external endpoints.
- Monitoring: Use tools like Datadog to track allowed/denied connections and ensure policies don’t disrupt applications.
Why It Matters:
Without Network Policies, a single compromised pod can access other pods freely, exposing sensitive data or services. For U.S. businesses, this is particularly critical to comply with regulations like HIPAA, PCI DSS, or SOC 2.
By following these steps, you can secure your Kubernetes cluster, minimize risks, and maintain compliance without unnecessary complexity.
Kubernetes Network Policies Explained
Core Best Practices for Kubernetes Network Policies
To move your Kubernetes cluster from an open configuration to a zero-trust environment, you need to follow certain key practices. These steps, grounded in zero-trust principles, help secure every component of your cluster. They are particularly useful for U.S. small and medium-sized businesses that require robust security without the burden of managing a complex security operations team.
Start with a Default-Deny Policy
The most critical step in securing your Kubernetes cluster is implementing a default-deny policy for both ingress and egress traffic. This shifts the security model to block all traffic unless explicitly allowed. Reports on Kubernetes security consistently emphasize network segmentation as a vital control. In fact, a 2024 container security survey found that lateral movement through flat cluster networks contributed to over 60% of cloud-native security incidents.
A default-deny policy ensures that no traffic can flow to or from pods unless specific allow rules are defined. For organizations in the U.S. navigating compliance requirements like PCI DSS or HIPAA, this approach is especially effective in meeting network segmentation mandates and enforcing least-privilege access.
Here’s an example of a simple default-deny policy for a namespace:
apiVersion: networking.k8s.io/v1
kind: NetworkPolicy
metadata:
  name: default-deny-all
  namespace: production
spec:
  podSelector: {}
  policyTypes:
  - Ingress
  - Egress
The empty podSelector: {} applies this policy to all pods in the namespace. Specifying both Ingress and Egress blocks all inbound and outbound traffic, creating a secure baseline.
To minimize disruptions, start by rolling out default-deny policies in non-production environments. Document any failed connections and refine your allow rules in staging before applying them to production. Cloud providers like Azure Kubernetes Service (AKS) explicitly recommend adopting default-deny policies as part of a zero-trust model to reduce risks and meet compliance requirements.
For teams concerned about potential disruptions, adopt a phased rollout. Apply the policy to one namespace at a time, coordinate with application teams to prepare allow rules, and schedule changes during maintenance windows. This step-by-step approach builds confidence and ensures a smoother transition to production.
Create Specific Rules for Traffic Control
Once the default-deny policies are in place, the next step is defining specific allow-list rules to permit only the traffic your applications need. Use tools like labels, namespace selectors, and IP blocks to create precise rules that reflect actual communication paths.
Labels are particularly helpful for managing dynamic pods. By standardizing labels to include role (app=frontend, app=backend), environment (env=prod, env=staging), and team ownership (team=payments, team=analytics), you can create policies that adapt as pods scale.
Here’s an example of an ingress rule allowing frontend pods to communicate with backend pods on port 8080:
apiVersion: networking.k8s.io/v1
kind: NetworkPolicy
metadata:
  name: allow-frontend-to-backend
  namespace: production
spec:
  podSelector:
    matchLabels:
      app: backend
  policyTypes:
  - Ingress
  ingress:
  - from:
    - podSelector:
        matchLabels:
          app: frontend
    ports:
    - protocol: TCP
      port: 8080
For cross-namespace communication, namespace selectors provide another layer of control. For instance, if your monitoring tools run in a monitoring namespace and need to scrape metrics from production services:
apiVersion: networking.k8s.io/v1
kind: NetworkPolicy
metadata:
  name: allow-monitoring-scrape
  namespace: production
spec:
  podSelector:
    matchLabels:
      metrics: enabled
  policyTypes:
  - Ingress
  ingress:
  - from:
    - namespaceSelector:
        matchLabels:
          name: monitoring
    ports:
    - protocol: TCP
      port: 9090
IP blocks are useful for managing external dependencies. For example, if your application needs to connect to an on-premises database at 10.50.0.0/24, you can define an egress rule like this:
apiVersion: networking.k8s.io/v1
kind: NetworkPolicy
metadata:
  name: allow-egress-to-database
  namespace: production
spec:
  podSelector:
    matchLabels:
      app: backend
  policyTypes:
  - Egress
  egress:
  - to:
    - ipBlock:
        cidr: 10.50.0.0/24
    ports:
    - protocol: TCP
      port: 5432
This rule ensures backend pods can only connect to PostgreSQL on port 5432 within the specified subnet. Avoid broad IP ranges like 0.0.0.0/0 unless absolutely necessary, as they weaken the security benefits of a default-deny policy.
Egress control is often overlooked but is just as important as ingress control. Without proper egress policies, a compromised pod could exfiltrate data or connect to unauthorized services. Define egress rules to limit pods to approved internal services - like your cluster’s DNS - and specific external endpoints.
| Aspect | Poor Practice | Best Practice |
|---|---|---|
| Baseline posture | No network policies; all traffic allowed. | Default-deny ingress and egress per namespace, then explicitly allow flows. |
| Rule granularity | Broad rules like "allow all within namespace". | Fine-grained label/namespace-based allow-lists for specific ports/protocols. |
| Egress control | Unrestricted outbound internet access from pods. | Egress policies restricted to internal services and specific external IPs/FQDNs. |
Document the business purpose for each allowed flow to simplify audits and provide clarity for your team. Treat your policies like code by storing them in Git, reviewing changes in pull requests, and testing updates with dry-runs or simulators before deployment.
Cover All Pods with Policies
After defining specific rules, ensure every pod is covered by at least one policy. Kubernetes Network Policies are additive, meaning pods not selected by any policy follow the default behavior. If no default-deny policy exists, these pods allow all traffic.
To avoid gaps, combine a namespace-wide default-deny policy with more specific, application-level policies. This layered approach ensures even new or unselected pods remain secure.
These strategies not only strengthen security but also integrate seamlessly with monitoring tools like Datadog, helping maintain visibility. For U.S. SMBs, resources like Scaling with Datadog for SMBs provide practical guidance for managing growing clusters and complex workloads.
Network Segmentation and Multi-Tenant Clusters
Network segmentation transforms a flat Kubernetes cluster into separate trust zones, a crucial step for U.S. SMBs aiming to meet compliance requirements under standards like PCI DSS, HIPAA, and SOC 2.
By default, Kubernetes allows unrestricted communication between pods across namespaces. This flat network design can expose production data if a single pod is compromised. Network segmentation addresses this risk by implementing policies that create boundaries, limit lateral movement, and contain potential breaches. Below, we explore segmentation patterns that enhance security for Kubernetes clusters.
Segmentation Patterns for Kubernetes
To complement a default-deny approach, three segmentation patterns form the backbone of secure Kubernetes deployments: per-namespace isolation, environment-based segmentation, and application-tier segmentation. These patterns address varying security needs and work well in combination.
Per-namespace isolation designates each namespace as an independent security boundary. This involves assigning namespaces to tenants, teams, or application domains and applying default-deny policies within each. For example, in a SaaS platform serving multiple enterprise customers, you might create a unique namespace for each customer. A default-deny policy in the customer-acme namespace ensures that Acme's pods cannot interact with pods in the customer-globex namespace unless explicitly allowed. This setup is particularly useful during security reviews or compliance audits to demonstrate tenant isolation.
Environment-based segmentation separates workloads by environment - development, staging, and production - using distinct namespaces or clusters. This prevents lower-trust environments from impacting production and simplifies compliance. For instance, you might place dev workloads in a dev namespace, staging in staging, and production in prod, with policies that block cross-environment traffic by default. Exceptions, such as CI/CD agents deploying across environments or observability tools sending metrics, should be narrowly defined.
Here’s an example policy that blocks traffic from development namespaces to production:
apiVersion: networking.k8s.io/v1
kind: NetworkPolicy
metadata:
  name: deny-dev-to-prod
  namespace: prod
spec:
  podSelector: {}
  policyTypes:
  - Ingress
  ingress:
  - from:
    - namespaceSelector:
        matchExpressions:
        - key: environment
          operator: NotIn
          values:
          - dev
This policy ensures that production pods reject traffic from namespaces labeled environment=dev, reinforcing cross-environment boundaries.
Application-tier segmentation enforces least-privilege principles between service layers. By labeling pods based on their tier (e.g., tier=frontend, tier=api, tier=db), you can create policies that restrict communication to only necessary paths. For instance, frontend pods may only communicate with API pods over HTTPS, while API pods connect to database pods on specific ports. This approach streamlines troubleshooting and provides clear documentation for security reviews.
| Pattern | Description | Benefits | Trade-offs |
|---|---|---|---|
| Per-namespace isolation | Assign namespaces to tenants, teams, or domains with default-deny policies. | Strong isolation and clear audit boundaries. | Increases namespace and policy management. |
| Environment-based segmentation | Separate dev, staging, and production workloads into distinct namespaces or clusters. | Minimizes risk of test environments affecting production; simplifies compliance. | May require multiple clusters for strict regulations. |
| Application-tier segmentation | Define policies to allow only required communication paths (e.g., frontend → backend). | Enforces least privilege; simplifies troubleshooting. | Requires accurate traffic flow understanding and maintenance. |
Combining all three patterns offers a robust strategy. For instance, a single production cluster could use separate namespaces for each customer alongside distinct namespaces for dev, staging, and shared services. This layered approach balances operational flexibility with the security expected by enterprise customers and auditors.
Securing Multi-Tenant Clusters
Multi-tenant environments introduce additional challenges, as workloads from different tenants share the same cluster. Misconfigurations or breaches must not allow one tenant to access another’s data or services.
To address this, allocate a dedicated namespace for each tenant and enforce default-deny policies. This ensures that tenant A’s pods cannot interact with tenant B’s. Any exceptions should be carefully documented and justified.
In addition to network policies, multi-tenant clusters require strong RBAC to ensure tenants can only manage resources within their own namespaces, separate service accounts and secrets for each tenant, and admission controls to block privileged workloads or bypasses.
Shared services like ingress controllers, DNS, and observability agents also need careful handling. These should reside in dedicated "infrastructure" namespaces and be exposed through well-defined services accessible via cluster DNS or specific IP ranges. For example, an ingress controller could be placed in an ingress-system namespace, allowing tenant namespaces to send egress traffic to it on ports 80 and 443.
Here’s a policy example for allowing tenant pods to communicate with a shared ingress controller:
apiVersion: networking.k8s.io/v1
kind: NetworkPolicy
metadata:
  name: allow-egress-to-ingress
  namespace: customer-acme
spec:
  podSelector: {}
  policyTypes:
  - Egress
  egress:
  - to:
    - namespaceSelector:
        matchLabels:
          name: ingress-system
    ports:
    - protocol: TCP
      port: 80
    - protocol: TCP
      port: 443
This policy enables pods in the customer-acme namespace to connect to the ingress-system namespace on HTTP and HTTPS while restricting other egress traffic.
Cross-namespace communication rules should start with a deny-all policy within each tenant namespace. Then, define a minimal set of shared platform namespaces with policies that allow tenant workloads to interact only with specific services in those namespaces. Namespace selectors and service labels can help enforce these rules, ensuring tenants can access shared components like DNS and logging agents without risking direct communication with other tenants’ pods.
For U.S. SMBs, this approach not only ensures compliance but also provides clear evidence that customer data is isolated. For instance, production namespaces can be restricted from accessing payment or PII databases unless explicitly permitted. Tools like Datadog can help monitor cross-tenant flows and detect anomalies early. For more details, check out Scaling with Datadog for SMBs.
Managing and Monitoring Network Policies
Building on the principles of Kubernetes Network Policies, managing and continuously monitoring these policies is crucial to maintaining security as your cluster grows. Network policies aren't static; as applications evolve and new workloads are deployed, policies can become outdated or overly restrictive. This section explores how to effectively manage version control, validate changes, and monitor policy performance over time.
Version Control and Policy Validation
To keep track of changes and ensure accountability, store your NetworkPolicy manifests in Git, either alongside application code or in a dedicated repository for cluster configurations. Organize policies by environment and tenant (e.g., /prod/customer-acme, /staging/shared-services) and enforce pull-request reviews and tagged releases for transparency and auditability. Requiring code reviews ensures that another team member checks for errors like missing selectors, overly permissive rules, or conflicts before policies are deployed to production.
Using version tags provides a clear history of policy changes and simplifies rollbacks. If a new policy disrupts connections, reverting to a previous tagged version quickly restores a stable configuration. This approach is especially helpful for smaller teams with limited security resources, as it minimizes downtime caused by misconfigurations.
Integrating policy validation into your CI/CD pipelines can prevent flawed configurations from reaching production. Automated checks can validate NetworkPolicy YAMLs for schema errors, unreachable rules, or overly permissive patterns. CI jobs should fail if validation errors are detected, ensuring only well-formed policies are deployed. Teams can also test policies in isolated environments, such as test clusters or namespaces, to verify scenarios like “frontend cannot access admin-db” before moving them to production.
A gradual rollout strategy can help prevent disruptions. Start with less restrictive policies in testing environments, monitor traffic and logs, and tighten rules incrementally. For example, apply new policies to a subset of namespaces or canary pods first, observing impacts through metrics and alerts. This approach allows teams to adjust or revert changes quickly if issues arise.
Once policies are deployed, monitoring their performance is essential to ensure they enforce the intended traffic flows effectively.
Monitoring Traffic and Policy Performance
Monitoring allowed and denied traffic is critical for validating the effectiveness of your policies. Logs from firewalls or CNI plugins, Kubernetes events related to policy application, and pod-level metrics like connection resets or timeouts can provide valuable insights. Establish baselines for normal traffic patterns - such as typical pod-to-pod connections and port usage - and set alerts for anomalies like spikes in denied traffic or unexpected connection failures.
For instance, a sudden increase in denied connections might indicate a misconfigured rule, while unexpected traffic to a database pod from an unknown namespace could signal a policy gap or a potential security issue.
Visual tools like topology maps or service dependency graphs can make it easier to understand traffic flows and identify overly broad policies. These visualizations help teams spot unexpected communication paths and evaluate the potential impact of policy changes during reviews.
It’s also important to measure the performance impact of NetworkPolicies to ensure they don’t degrade application performance in large clusters. Monitor metrics like request latency, error rates, and resource usage (CPU and memory) before and after deploying or updating policies. Keeping policies modular, label-driven, and free of redundant rules can help reduce evaluation overhead. Controlled load tests after significant changes can confirm that latency and throughput remain within acceptable limits.
Standardizing a set of reusable baseline policies - like default deny, namespace isolation, and restricted egress - and templatizing them for new namespaces or applications can simplify configurations. Assign ownership clearly, with platform teams managing baseline policies and application teams handling service-specific rules. Regular reviews and simple runbooks for common issues (e.g., “pod cannot access database”) help maintain security without overwhelming your team.
This foundation of monitoring and management sets the stage for leveraging tools like Datadog for deeper insights.
Using Datadog to Monitor Network Policies
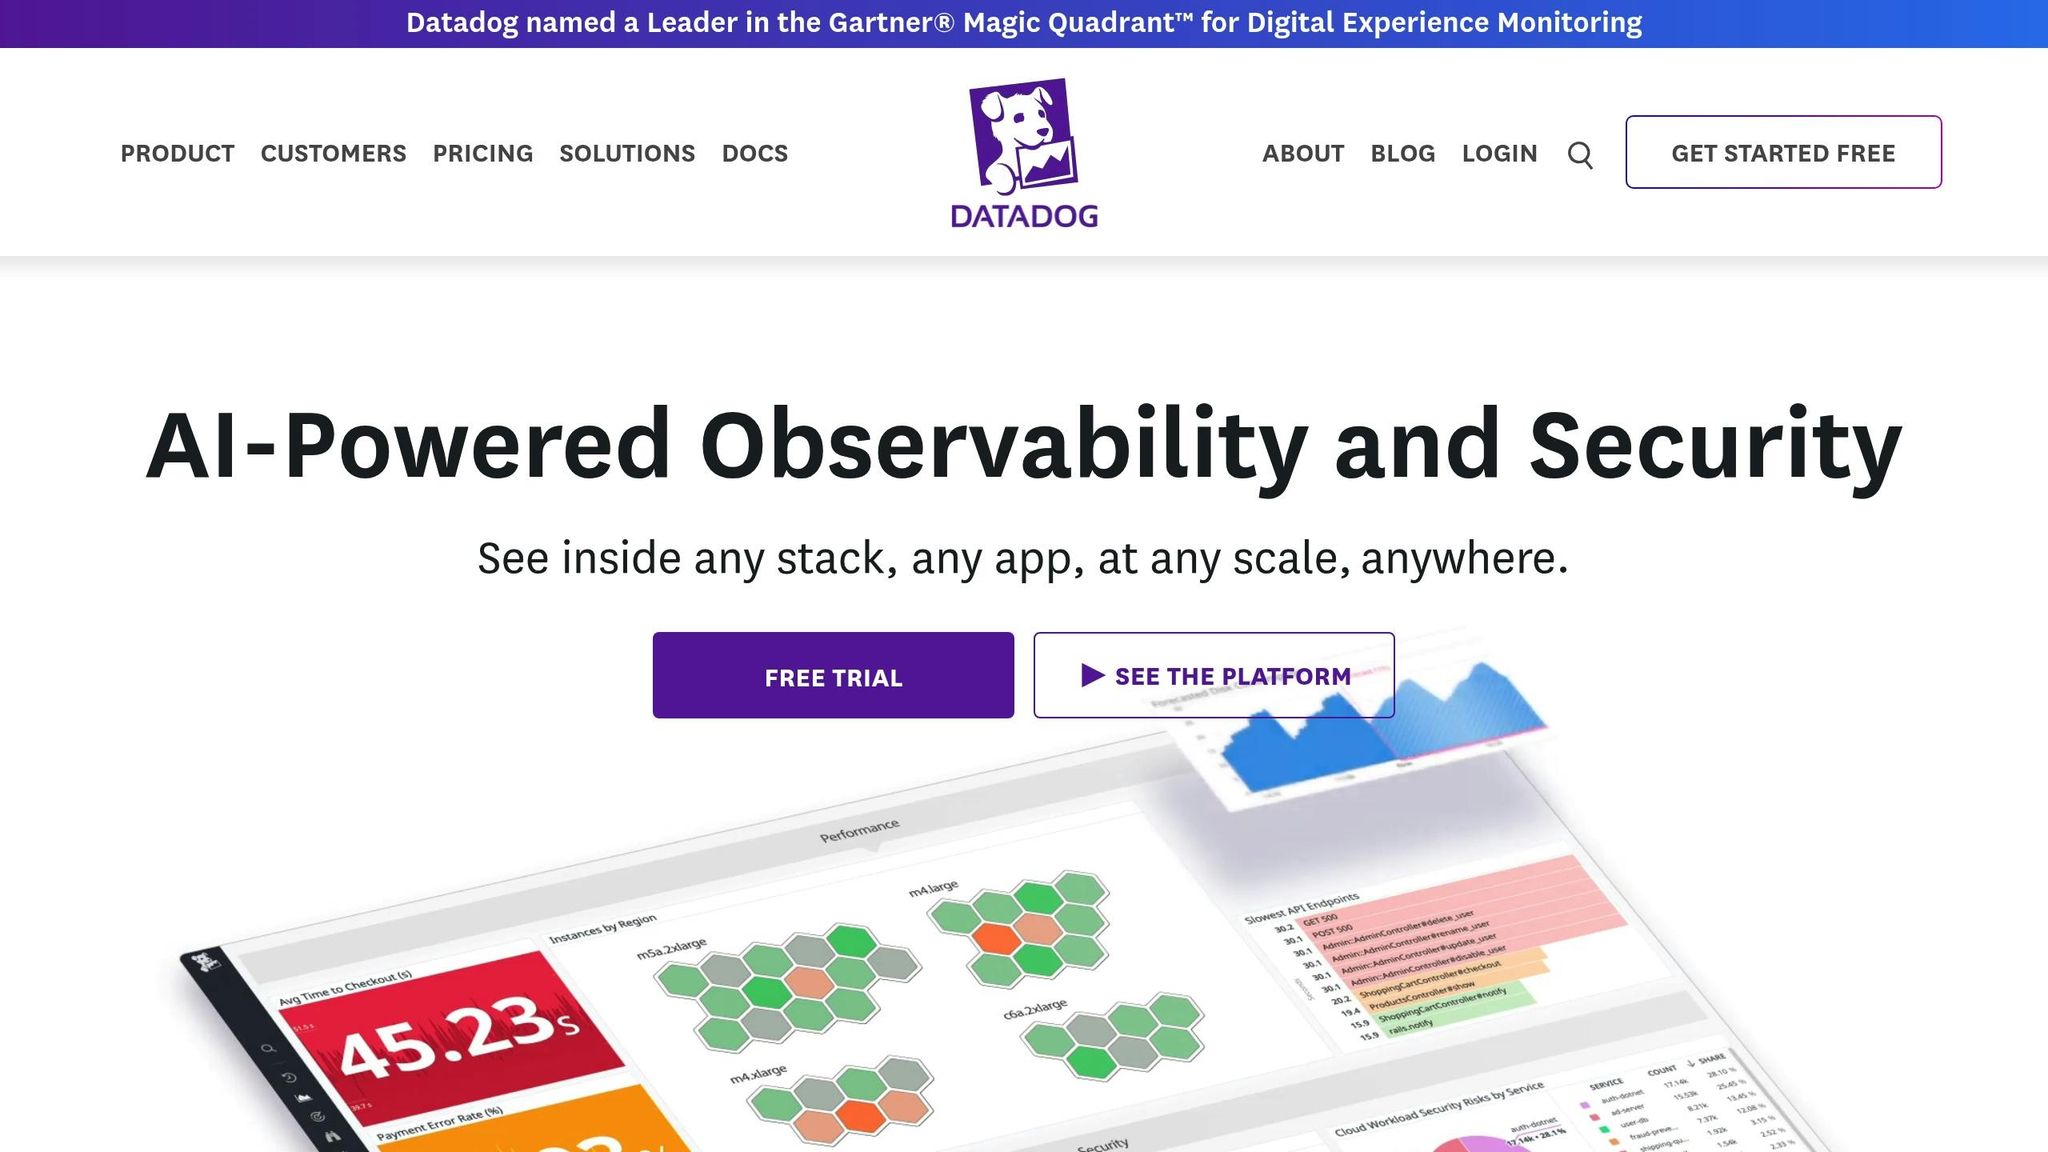
For small and medium-sized businesses, integrating Kubernetes clusters with Datadog can provide powerful monitoring capabilities. Datadog collects network flow data and cluster metadata, enabling teams to build dashboards that visualize pod-to-pod and namespace-to-namespace connections, denied flows, and service traffic volumes.
Create dedicated dashboards and alerts in Datadog to quickly identify unexpected traffic patterns or blocked connections. Datadog’s application dependency mapping feature illustrates pod-to-pod communication, making it easier to verify policy effectiveness and troubleshoot connectivity issues. By correlating network data with application performance metrics and logs, teams can pinpoint when a policy update causes errors or latency and adjust rules accordingly.
Datadog’s time-series metrics offer a continuous view of policy effectiveness as services and traffic patterns evolve. Saved dashboards and monitors help track how well policies align with intended traffic flows over time.
This monitoring data is also invaluable for audits, whether internal or external. It demonstrates that critical services are segmented, denied traffic is logged and investigated, and policy changes undergo proper review and validation - practices often required in regulated industries or security-sensitive environments.
For more detailed guidance on using Datadog in small and medium-sized business environments, check out Scaling with Datadog for SMBs.
Scaling and Optimization Techniques
When clusters grow, teams often encounter challenges like policy sprawl, overlapping configurations, and performance bottlenecks. Here’s how to tackle these issues effectively.
Managing Policies in Large Clusters
Uncoordinated creation of NetworkPolicies can lead to policy sprawl, making configurations difficult to audit, understand, and test. In large clusters, this creates confusion during incidents, as on-call engineers struggle to determine which rules apply to traffic. The situation worsens when different teams independently define ingress and egress rules, leading to overlapping policies and unpredictable behavior.
To combat this, start with centralized baseline policies. Security or platform teams can manage cluster-wide guardrails, such as default-deny rules and mandatory egress restrictions. Application teams, on the other hand, should focus on service-specific policies within their namespaces. This clear division keeps the policy count manageable and avoids duplicating efforts.
High label diversity is another common issue. When teams use too many unique or environment-specific labels, selectors become overly complex and harder to maintain. This also impacts performance, as network plugins must evaluate more combinations during rescheduling or updates. Standardizing on a small set of labels - such as app, tier, environment, and team - can simplify selectors while maintaining flexibility for most use cases.
Aligning namespaces with trust boundaries can further streamline policies. For example, if namespaces represent teams or business domains, policies can use namespaceSelector rules combined with a few key labels instead of relying on overly specific podSelector rules. This approach reduces label complexity and makes policies easier to understand. For U.S.-based teams managing multiple environments like development, staging, and production, documenting these practices in a runbook and enforcing them through admission controllers or CI checks ensures consistency over time.
Regular policy reviews are crucial for maintaining a clean configuration. Quarterly audits help identify outdated or redundant policies and ensure every rule has a clear purpose and assigned owner. Providing teams with policy templates - such as standard "frontend-to-backend" or "namespace isolation" patterns - can save time and prevent duplicate efforts.
When deploying new policies, do it incrementally. Start with non-critical namespaces and expand only after logs and metrics confirm stability. Some organizations use "shadow" or dry-run policies to simulate changes against recent traffic, allowing them to catch potential issues before rolling out updates to production.
In clusters with thousands of pods and frequent deployments, performance optimization becomes essential. Use simple, coarse-grained selectors instead of numerous overlapping podSelector rules tied to ephemeral labels. Reducing the number of NetworkPolicies applied to any single pod minimizes the computational load on network plugins during pod changes. Regularly profile policy evaluation and node performance to plan capacity for future growth. Load testing can help ensure policies maintain acceptable latency and throughput.
To simplify policy management, consider reusable modules. Examples include a "default-deny-plus-allowlist" template for each namespace, a "frontend-to-backend" policy for specific ports like 80 and 443, and a "monitoring/observability" policy for logging and metrics agents. These templates can be packaged as Helm charts or Kustomize bases, allowing teams to deploy well-reviewed policies with minimal effort. Over time, these modules can evolve based on incident reviews and performance data, ensuring consistent improvements across environments.
Finally, establish governance and review practices for long-term scalability. Cross-functional reviews of policy metrics, incident reports, and architecture changes can prevent conflicts and duplication. Maintaining a centralized policy registry in Git - documenting the purpose, owner, and scope of each rule - provides a single source of truth for onboarding new teams or clusters. Automated validation tools in CI/CD pipelines can enforce standards like label conventions and mandatory default-deny coverage, improving both security and scalability.
Combining Network Policies with Other Security Controls
After streamlining NetworkPolicy management, layering additional security controls can address gaps that policies alone can't cover. While NetworkPolicies excel at controlling layer 3/4 traffic - defining which pods, namespaces, or IP ranges can communicate - they don’t handle authentication, encryption, or request-level authorization. This is where service meshes come into play, offering layer 7 capabilities like mutual TLS, fine-grained RBAC, and advanced routing.
A practical approach is to use NetworkPolicies for broad traffic control - e.g., allowing communication between specific app tiers or namespaces - while relying on the service mesh for detailed authentication and authorization. For instance, a NetworkPolicy might allow traffic from a frontend namespace to a backend namespace, while the service mesh ensures only authenticated requests with valid JWT tokens can access specific API endpoints. This layered strategy keeps NetworkPolicies simpler while enhancing security.
Combining network-layer and application-layer checks also simplifies audits and incident response. For regulated industries in the U.S., such as healthcare or finance, this dual-layer approach helps meet compliance requirements for data protection and access control. It provides clear evidence of segmentation at both the network and application levels.
In multi-zone or hybrid environments - spanning on-premises data centers and cloud providers - NetworkPolicies should align with infrastructure-level controls. For example, cloud security groups, firewalls, and VPN configurations should complement pod-level rules rather than conflict with them. Teams can restrict traffic between zones or data centers using IP-based rules (ipBlock in NetworkPolicies) alongside namespace- and label-based policies at the cluster level. For U.S. organizations operating across multiple regions, documenting these flows and mapping them to compliance requirements (like HIPAA or SOC 2) ensures consistent security and legal compliance.
Observability platforms are essential for managing this complexity. Metrics and logs from Kubernetes network plugins, nodes, and pods can be sent to tools like Datadog to visualize traffic patterns, latency, and error rates. This helps teams identify overly restrictive or permissive policies. Resources like Scaling with Datadog for SMBs offer guidance for configuring dashboards, monitors, and alerts tailored to network security and performance, which can be especially helpful for small and medium-sized U.S. businesses.
Traces and service maps in Datadog also help correlate policy changes with application-level impacts, making it easier to adjust rules when issues arise. For example, if a new policy causes unexpected latency or errors, teams can quickly pinpoint the affected services and refine the rules. This feedback loop is critical for maintaining both security and performance as clusters grow.
Conclusion
Kubernetes Network Policies play a key role in establishing zero-trust security within your cluster. Without them, a compromised workload could expose critical services to unauthorized access, posing serious risks.
The approach is simple: start with a default-deny policy and build least-privilege rules for necessary connections. Ensure every pod is covered by at least one policy. Use consistent labels like app, tier, and environment to keep things organized, and version-control any changes to maintain a clear history. These steps form the backbone of a secure and manageable setup.
As your cluster grows, adopting standardized label conventions, reusable policy templates, and CI/CD automation will help keep configurations clean and easy to audit. For smaller teams or SMBs, beginning with a few targeted policies in each namespace can make scaling easier as you gain experience. Regular reviews and automated testing can catch issues early, preventing security gaps or misconfigurations.
Combining network policies with tools like RBAC and service meshes further strengthens your cluster's security. While network policies define which pods can communicate, service meshes handle tasks like authentication, encryption, and request-level authorization. Together, they simplify audits and help meet compliance standards, especially for industries like healthcare and finance.
Continuous monitoring and updates are essential. As applications evolve, so must your policies. Tools like Datadog provide valuable insights, showing which connections are allowed or blocked, how latency is affected by policy updates, and where unexpected traffic patterns emerge. SMBs can leverage Datadog dashboards and alerts to quickly identify misconfigurations, tie them to recent changes, and fine-tune policies for better security and performance without causing disruptions.
To get started, here are some practical steps: audit your cluster to identify pods and namespaces without policies, implement a default-deny baseline in non-production environments, set up network traffic observability, pilot policies on a critical application, automate deployments using Git-based workflows, and use Datadog dashboards to monitor connection failures and error rates. These actions will help you move from scattered rules to a well-structured, scalable security strategy.
For more detailed guidance on observability and monitoring, SMBs can explore resources like Scaling with Datadog for SMBs, which provides actionable advice for using Datadog to maintain effective Kubernetes network policies as your business and infrastructure grow.
FAQs
What steps can I take to implement Kubernetes Network Policies without disrupting my applications?
To put Kubernetes Network Policies into action without disrupting your applications, it’s crucial to first get a clear picture of how your network traffic behaves. Tools like Datadog Network Monitoring can be a big help here. They let you visualize traffic patterns and pinpoint dependencies between services, giving you the insights needed to design policies that suit your application’s needs.
Start with policies that are more open and gradually make them stricter. For example, begin by allowing all traffic and then tighten restrictions step by step, based on what you observe. Always test these changes in a staging environment before rolling them out in production to avoid any unexpected issues. Keep an eye on your policies and adjust them as your application evolves to ensure they continue to balance security and functionality effectively.
What are the best practices for managing and monitoring Kubernetes Network Policies as my cluster grows?
To keep up with the demands of managing Kubernetes Network Policies as your cluster grows, it's crucial to prioritize security, scalability, and visibility. Start by setting up precise ingress and egress rules. These rules control the flow of traffic between your pods and external resources, ensuring only the necessary connections are allowed. As your architecture evolves, make it a habit to revisit and adjust these policies to reduce potential risks.
When it comes to monitoring, tools like Datadog can be a game-changer. With its Kubernetes integration, Datadog provides real-time insights into network traffic and policy enforcement. This helps you track how policies are performing, spot unusual activity, and resolve connectivity problems quickly. By using such tools, you can maintain a secure and efficient network while keeping performance at its best.
How can Kubernetes Network Policies work with service meshes to improve cluster security?
Kubernetes Network Policies and service meshes work hand in hand to bolster the security of your cluster. Network Policies focus on managing traffic flow at the network layer, letting you specify which pods are allowed to communicate with each other or access external resources. Meanwhile, service meshes step in at the application layer, offering features like encryption, authentication, and monitoring for service-to-service interactions.
When you combine these tools, you can address security on multiple fronts. For instance, Network Policies can block unauthorized traffic at the network level, while a service mesh ensures that communication between services remains encrypted and authenticated. This layered strategy not only tightens security but also helps minimize potential vulnerabilities within your Kubernetes cluster.

