Mastering the Datadog API: How to Automate Dashboards, Monitors, and Metrics
Automate Datadog dashboards, monitors, and custom metrics with secure API keys, retry handling, and version-controlled configs.
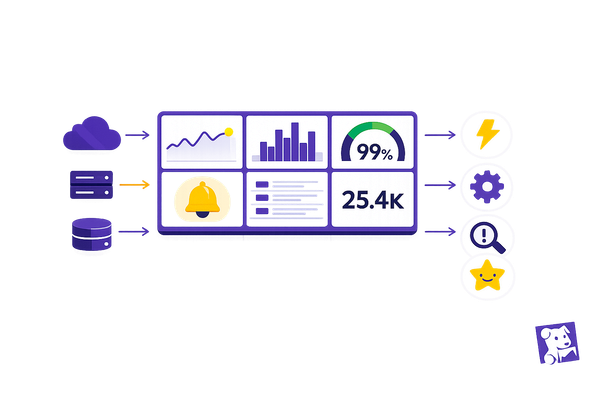
Managing cloud infrastructure manually is time-consuming and error-prone. The Datadog API simplifies this by enabling automation of dashboards, monitors, and metrics. This approach ensures consistency, reduces repetitive tasks, and scales easily with your infrastructure.
Key Highlights:
- Automate Dashboards: Create, update, and manage dashboards programmatically for consistent visibility.
- Streamline Monitors: Set up alerts for key metrics and route notifications to relevant teams automatically.
- Submit Custom Metrics: Track business-specific data using the API without needing the Datadog Agent.
- Efficient Authentication: Use API and Application keys securely with environment variables.
- Handle Rate Limits: Batch requests and enable retries to avoid disruptions.
Why It Matters:
For small and medium-sized businesses (SMBs), automation ensures no gaps in monitoring while saving time and avoiding errors. With tools like Python libraries and structured workflows, you can set up scalable monitoring systems that align with your evolving infrastructure.
By automating these processes, you can focus on strategic work instead of manual configurations. Ready to dive in? Let’s break it down step by step.
Session 20 | Datadog Advance | Working with Api
Getting Started with the Datadog API
Datadog API Authentication Setup and Monitor Types Comparison
Kick off your automation journey by setting up authentication and choosing the right tools. This initial setup is crucial for small and medium-sized businesses (SMBs) aiming to establish consistent, automated monitoring.
Setting Up API and Application Keys
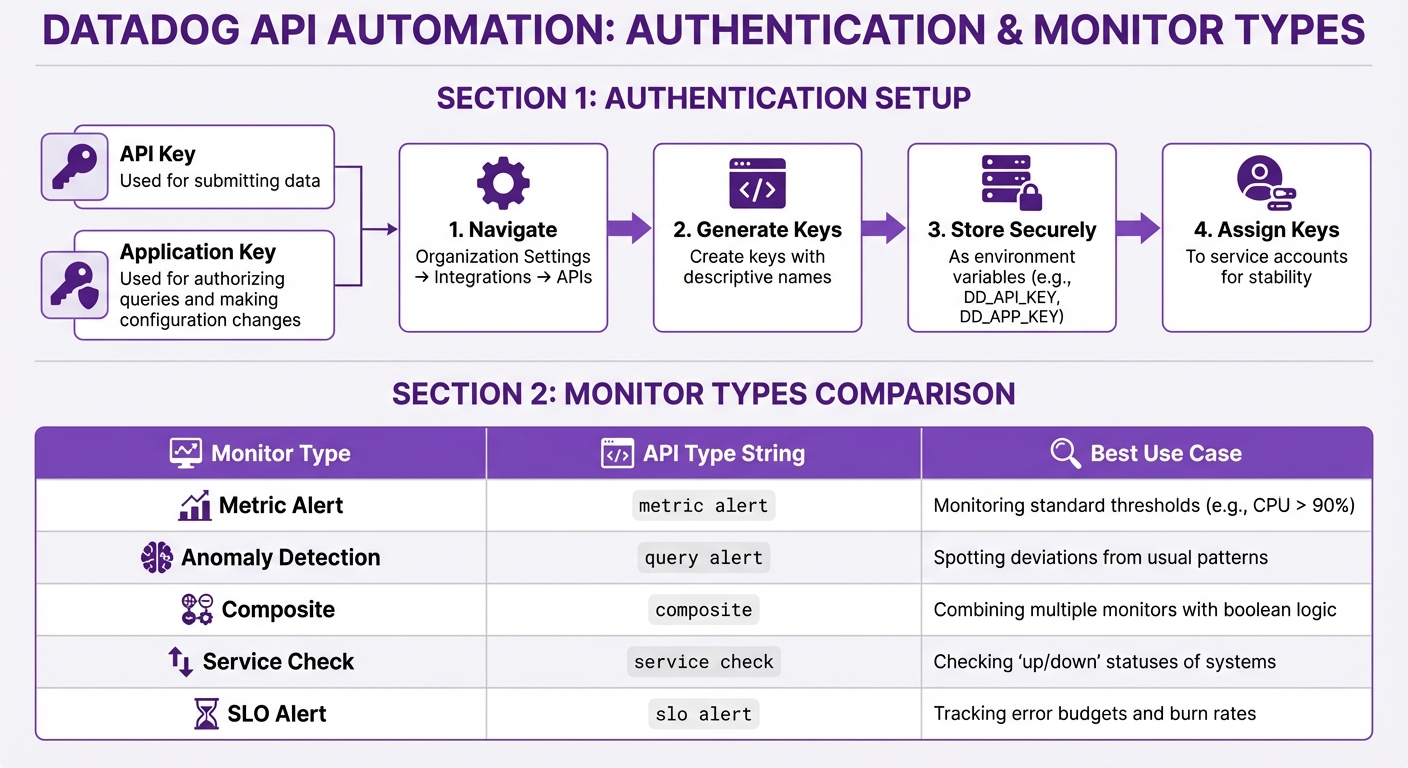
Datadog requires two types of keys: an API Key (used for submitting data) and an Application Key (used for authorizing queries and making configuration changes).
To generate these keys, navigate to Organization Settings under Integrations > APIs in the Datadog interface. Give each key a clear, descriptive name. This way, if a key is compromised, you can revoke it without affecting other automations.
For security, avoid hardcoding these keys in your scripts. Instead, store them as environment variables (DD_API_KEY and DD_APP_KEY). This method not only keeps your credentials safe but also makes your code easier to use across different environments. Application keys inherit the permissions of the user who creates them. To avoid disruptions, assign keys to service accounts or users with stable roles, especially in the case of team changes.
Choosing Your Tools and Libraries
Once your keys are ready, pick the tools you’ll use to interact with Datadog’s API.
For Python users, install the official library with pip install datadog-api-client. If you need to handle high-throughput tasks, opt for the async version by running pip install datadog-api-client[async] and use AsyncApiClient. Make sure you’re using Python 3.8 or newer, and configure the client with your Datadog site (e.g., datadoghq.com or datadoghq.eu).
Understanding Rate Limits and Permissions
Datadog enforces endpoint-specific rate limits. If you exceed these limits, you’ll receive a 429 Too Many Requests error. To handle this, enable automatic retries in the Python client by setting configuration.enable_retry = True. By default, the client retries up to three times, but you can increase this limit with configuration.max_retries.
Keep an eye on the X-RateLimit-Limit and X-RateLimit-Remaining headers to monitor your API usage. For SMBs with strict network security policies, the API client also supports proxy routing through configuration.proxy = "http://127.0.0.1:80".
Some API features may still be in development. To use these, you’ll need to explicitly enable them in your configuration. For example, set configuration.unstable_operations["<OperationName>"] = True for specific operations. This ensures your automation scripts remain functional as Datadog updates its API.
Automating Dashboards with the Datadog API
Once you've set up authentication, you can use the Datadog API to standardize dashboards, ensuring consistent monitoring across your cloud environments. By automating dashboard creation, updates, and deletion, you can streamline visibility and maintain uniformity across your systems.
Creating Dashboards with Code
To create a dashboard, you'll need to make a POST request to /api/v1/dashboard with a JSON payload that specifies the dashboard's structure. The key parameters include:
title: The dashboard's name.widgets: A JSON array defining the widgets to display.layout_type: Determines layout behavior -orderedfor automatic reflow orfreefor fixed positions.
Optional parameters, like description, is_read_only, and template_variables, can add extra functionality. For instance, template_variables allow users to dynamically filter dashboards by attributes such as host or service, which is especially useful for managing multiple environments.
To avoid errors, include the Content-Type: application/json header in your request. Here's a breakdown of the parameters:
| Parameter | Type | Required | Description |
|---|---|---|---|
title |
String | Yes | The name of the dashboard. |
widgets |
Array | Yes | A list of widget definitions (JSON objects) to display on the dashboard. |
layout_type |
String | Yes | Layout type: ordered (automatic) or free (fixed). |
description |
String | No | A brief summary of the dashboard's purpose. |
is_read_only |
Boolean | No | Restricts modifications to the author and admins if set to true. |
template_variables |
Array | No | Enables dynamic filtering for dashboards using attributes like host. |
For Python users, the Dashboard.create() method simplifies this process by handling the REST call with these parameters.
Updating and Customizing Dashboards
When updating a dashboard, keep in mind that the entire definition is replaced. This means you need to include all existing widgets you want to retain. Start by retrieving the current dashboard JSON using a GET request. Storing this JSON in version control is a good practice to prevent accidental data loss.
Updates require the dashboard_id and the same parameters used during creation - title, widgets, and layout_type. Optional fields like description, is_read_only, and template_variables can also be modified. For critical dashboards, setting is_read_only to true can help avoid manual changes in the Datadog UI that might cause configuration drift.
To ensure smooth updates:
- Validate the widget JSON with a parser to catch errors early.
- Test updates in a staging environment by applying changes to a temporary dashboard. This helps verify the layout and metrics before pushing updates to production.
Deleting Dashboards Securely
To delete dashboards, use the deleteDashboard endpoint for individual dashboards or the deleteDashboards endpoint for bulk actions. The bulk delete operation is atomic, meaning if any part of the request fails, no dashboards will be deleted. This prevents partial deletions and ensures consistency.
Before deleting, fetch and store the dashboard JSON in version control for easy restoration if needed. It's also a good idea to log the IDs of deleted dashboards in your automation scripts. These IDs are essential if you need to recover dashboards using the restoreDashboards API. Always check the DashboardDeleteResponse to confirm the deletion was successful before moving on to other tasks.
Automating Monitors with the Datadog API
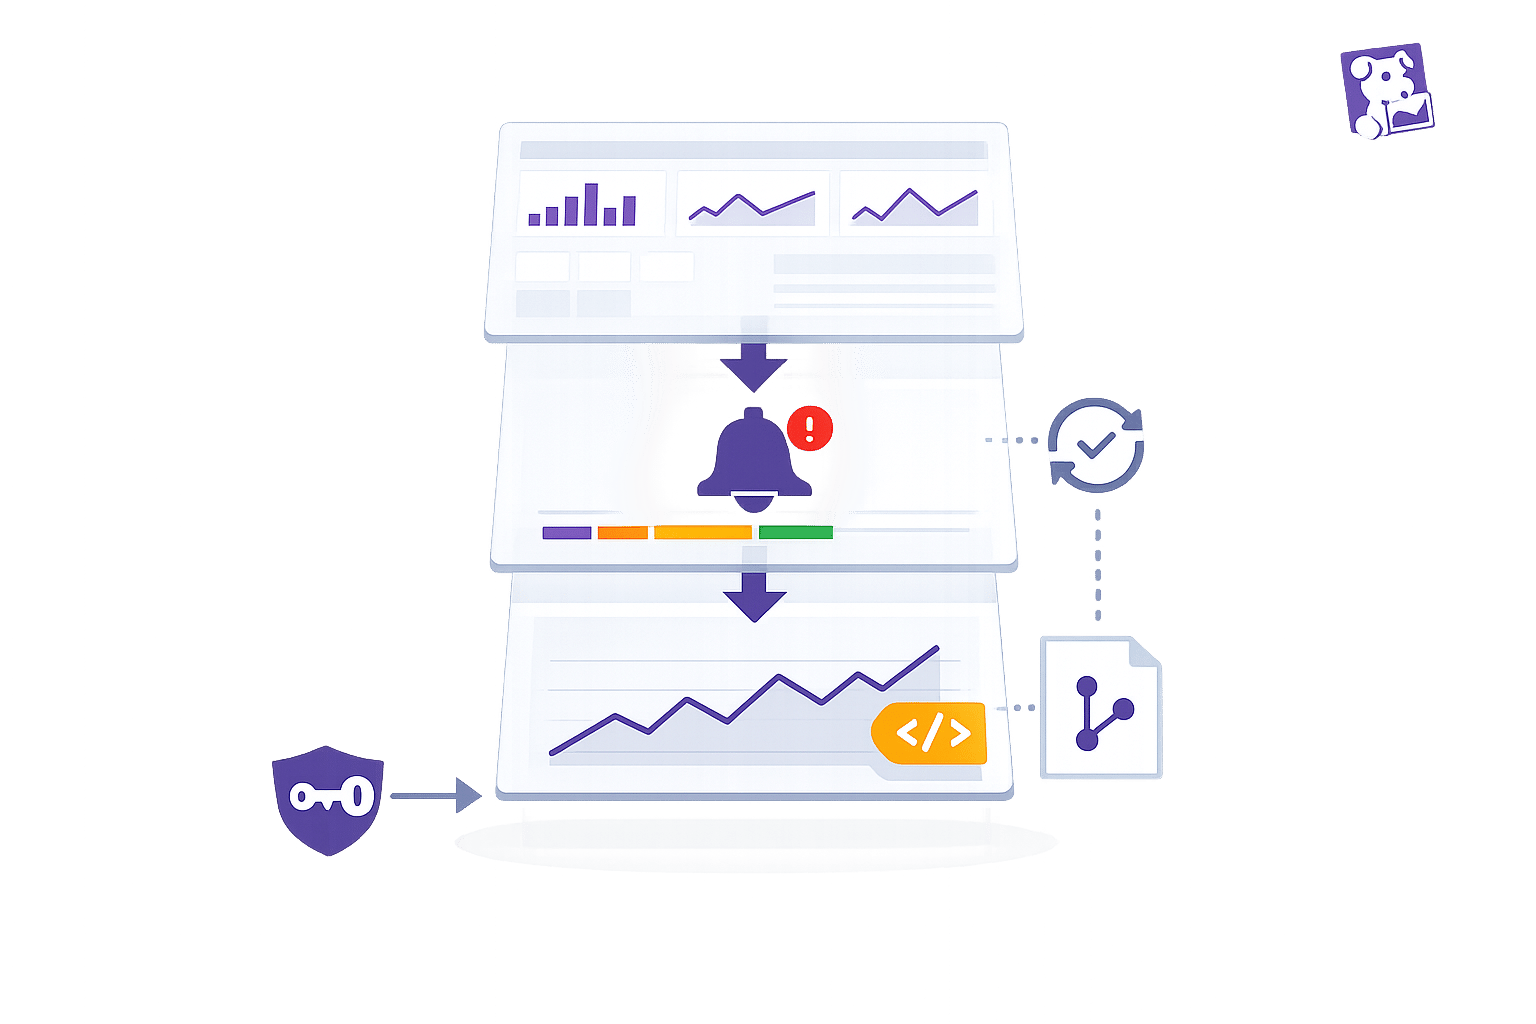
Monitors are essential for keeping an eye on your systems, complementing dashboards by sending alerts when something goes off track. With the Datadog API, you can automate the creation, updating, and removal of monitors, ensuring continuous oversight of key metrics.
Creating Monitors for Key Metrics
To create a monitor, send a POST request to /api/v1/monitor with a JSON payload. Each monitor requires a few essentials: a name, type, query, and message.
Your monitor query might look like this: avg(last_5m):avg:system.cpu.idle{host:host0} > 90. You can also define thresholds for critical, warning, and recovery levels within the options object. If you want individual alerts for each host rather than a single aggregate, include a "group by" clause in your query, such as avg:system.cpu.idle{*} by {host}. This enables multi-alerts, which issue separate notifications per host.
To avoid triggering alerts for metrics that are delayed, use the evaluation_delay parameter.
| Monitor Type | API type String |
Best Use Case |
|---|---|---|
| Metric Alert | metric alert |
Monitoring standard thresholds (e.g., CPU > 90%) |
| Anomaly Detection | query alert |
Spotting deviations from usual patterns |
| Composite | composite |
Combining multiple monitors with boolean logic |
| Service Check | service check |
Checking "up/down" statuses of systems |
| SLO Alert | slo alert |
Tracking error budgets and burn rates |
Composite monitors are particularly useful for reducing unnecessary alerts. For instance, you can set them to trigger only when CPU usage is high and latency exceeds acceptable limits. This way, you avoid being bombarded with alerts from minor, isolated issues.
Once you've set up your monitors, the next step is to configure notifications to ensure the right people are alerted.
Setting Up Notifications and Alerts
You can route alerts to specific teams or channels by using @tags in the message field. For example, adding @slack-SMB-Team or @pagerduty ensures alerts go to the right Slack channel or PagerDuty integration. Include variables like {{value}}, {{threshold}}, and {{host.name}} to provide additional context in your messages.
Conditional tags help tailor messages based on alert status. For example:
- Use
{{#is_alert}}...{{/is_alert}}to include instructions for critical alerts. - Use
{{#is_recovery}}...{{/is_recovery}}to confirm when systems recover.
To prevent unresolved issues from slipping through the cracks, configure renotify_interval and renotify_occurrences in the options object. These settings ensure notifications are repeated until the issue is resolved. Always enable recovery notifications so teams know when they can stop investigating.
For better organization, assign ownership tags like team:backend to monitors. Use notification rules to automatically route alerts to the appropriate stakeholders without needing to manually update each monitor.
With notifications in place, it's important to manage the lifecycle of your monitors as your infrastructure evolves.
Managing Monitor Lifecycles
As your systems grow and change, you'll need to adjust or retire monitors. Use PUT /api/v1/monitor/{monitor_id} to update existing monitors, whether it’s modifying thresholds, queries, or notification settings. Before making changes, fetch the current configuration using a GET request to ensure you’re working with the latest settings and avoid overwriting critical options like restricted_roles.
When it’s time to remove a monitor, send a DELETE request to /api/v1/monitor/{monitor_id}. You can even automate cleanup by scripting the removal of monitors in a "No Data" state that haven’t triggered alerts within a specific timeframe.
For consistency and accountability, store monitor definitions as JSON files in version control. This monitor-as-code approach makes it easy to track changes, roll back if needed, and maintain uniform configurations across environments. During scheduled maintenance, use the Downtimes API to temporarily mute monitors, preventing false-positive alerts during planned service windows.
Automating Metrics with the Datadog API
Metrics are the backbone of any monitoring strategy. Alongside dashboards and monitors, automating metrics helps create a well-rounded approach for SMBs. With the Datadog API, you can submit custom metrics, run queries for analysis, and organize data using tags - all without needing the Datadog Agent installed everywhere.
Submitting Custom Metrics
The POST /api/v1/series endpoint allows you to send custom metrics directly to Datadog, making it a great option for environments where installing the Agent isn't feasible.
To use this endpoint, include a series list in your JSON payload. This should contain the metric name, data points, and optional tags. Each data point is a [timestamp, value] pair, where the timestamp is in Unix epoch seconds. For instance, if you're tracking batch job durations, you could name the metric myapp.batch.duration. Using dot-separated naming conventions helps keep your metrics organized in the Metrics Explorer.
Authentication is done via your API key, which you include in the DD-API-KEY header. Use the appropriate endpoint based on your region: https://api.datadoghq.com/api/v1/series for the US or https://api.datadoghq.eu/api/v1/series for the EU.
When submitting metrics:
- Use
gaugefor values that fluctuate, like memory usage. - Opt for
countorrateto track event frequency. - Batch multiple metrics into a single request to improve efficiency.
Be cautious with high-cardinality tags (like user_id or request_id), as they can lead to increased costs.
Querying Metrics for Analysis
The GET /api/v1/query endpoint lets you retrieve metric data for analysis. You'll need three parameters to use it: from and to (both in Unix timestamps) and the query string. The query syntax follows this format: aggregator:metric{scope}by{grouping}.
For example:
- To compare CPU usage across staging hosts, you might use:
avg:system.cpu.user{env:staging} by {host}. - To monitor login response times in 5-minute intervals, try:
avg:http.request.time{endpoint:/login}.rollup(avg, 300).
The .rollup() function helps control data granularity, which is useful for long-term analysis. Larger intervals can prevent hitting point limits. You can also append .as_count() to return event counts instead of averages.
For best results, keep your query windows under 24 hours. This endpoint is optimized for analysis, not bulk data retrieval.
Using Tags for Better Metric Tracking
Tags add a multidimensional layer to your metrics, making it easier to filter and analyze data. Always use the key:value format (e.g., region:us-east-1) to enable effective grouping and aggregation.
Standard tags like env, service, and version help link metrics with traces and logs. For SMBs, you might also include tags like customer_id, app_version, or service_tier to focus on specific segments or performance issues.
To avoid duplication, standardize tags by using lowercase for all keys and values, as Datadog tags can be case-sensitive in certain contexts. Keep tags concise and descriptive for better readability in dashboards. Whenever possible, apply tags at the host or Agent level so they automatically propagate to all associated metrics, saving you from manual tagging.
Best Practices for API Automation in SMBs
Automating tasks with the Datadog API can save a lot of time, but it’s not without its challenges. Without careful planning, you might run into issues like rate limits, lost configurations, or confusing errors. Following a few smart practices can help you avoid these pitfalls and create automation workflows that grow with your business.
Error Handling and Logging
When setting up API automation, having solid error handling and logging is a must. API calls can fail for various reasons - network problems, hitting rate limits, or sending invalid data. To manage temporary issues, implement retry logic with exponential backoff. This means waiting a few seconds after the first failure and then doubling the wait time with each retry. Many HTTP libraries already include this functionality.
Enable debug logging by setting the debug flag to true. This logs every request and response, making it easier to pinpoint problems when something breaks. For production systems, log errors with additional details like session IDs, timestamps, and the API endpoint involved. These details are crucial when troubleshooting.
Datadog's Error Tracking can help by grouping thousands of individual errors into manageable issues based on service and code version. This reduces the flood of alerts and makes it easier to focus on what matters. Linking your automation scripts to their source code through the Datadog CLI can also provide unminified stack traces, showing exactly where failures occur.
For example, in 2023, Toyota Connected used Datadog Workflow Automation to eliminate manual application restarts. They set up workflows triggered by the ArgoCD API in response to Datadog alerts, allowing the system to handle restarts automatically and cutting down on downtime.
Managing Scalability and Rate Limits
Datadog applies rate limits to different API categories, including general API calls, workflow automation, and agent submissions. For SMBs, batching requests is a great way to stay within these limits. Instead of sending 100 separate metrics, for instance, combine them into a single POST request to /api/v1/series. This approach reduces the number of calls and helps you stay well below your thresholds.
Use the Datadog API Management tool to monitor your API usage. This tool tracks how much of your quota each script uses, making it easier to spot any that consume too many resources. If you’re regularly nearing your limits, consider caching frequently accessed data locally or increasing the intervals between automation tasks.
These strategies not only help you avoid rate limits but also make your automation workflows more efficient and scalable.
Version Control for Dashboards and Monitors
Just like other automated processes, version control is essential for managing configuration changes to dashboards and monitors. Treat these configurations as code to avoid accidental overwrites and to make rollbacks simple. Save all configurations in Git as JSON or YAML files. This creates a complete history of changes, allows for peer reviews through pull requests, and makes reverting to earlier versions quick and easy.
For Kubernetes environments, tools like Terraform or the Datadog Operator can simplify this process. The Datadog Operator provides Custom Resource Definitions (CRDs) such as DatadogDashboard, DatadogMonitor, and DatadogSLO to keep your cluster’s state in sync.
Lock API client versions through dependency managers like go.mod for Go or requirements.txt for Python. This ensures consistent builds and prevents unexpected issues when new API versions are released. Always use tagged versions of API modules instead of pulling the latest release.
Finally, set up a scheduled backup script to regularly save the current state of your critical dashboards and monitors in a separate repository. Depending on how often changes are made, you can run these backups daily or weekly to maintain a reliable snapshot of your configurations.
Conclusion
Benefits of Datadog API Automation
The Datadog API takes the hassle out of monitoring by automating processes, making it easier to scale and maintain consistency. As David Lentz from Datadog puts it:
You can now configure integrations programmatically using our API, making your monitoring practices as scalable and repeatable as possible.
This means your monitoring evolves in step with your infrastructure, without the need for constant manual adjustments.
For smaller teams, the efficiency boost is a game-changer. Automating integrations frees up time for more strategic work, while ensuring consistent monitoring across all environments. This eliminates visibility gaps often caused by manual setups. Plus, automated alert routing ensures the right team members get notified instantly through their preferred channels, cutting down response times when issues arise.
These advantages pave the way for a smoother shift to automated workflows.
Getting Started with Automation
To make the most of these benefits, start small. Automate one integration or monitor to gain immediate insight into your cloud resources. For instance, you could script an automatic integration of new AWS accounts with Datadog as soon as they're created. Once you’re comfortable with this, expand to automating Slack channel connections or PagerDuty services when setting up new team environments.
Take advantage of features like filter_tags to focus on specific resources - such as staging environments - to manage data volume and keep costs in check. As you gain confidence, you can tackle advanced automation tasks, such as managing dashboard lifecycles or dynamically updating monitors. This step-by-step approach helps small and medium-sized businesses overcome the challenges of manual monitoring, embedding consistency and scalability into their infrastructure from the start. The key is to build momentum with smaller wins before scaling automation across your entire system.
FAQs
How do I rotate Datadog API keys safely without breaking automations?
To rotate Datadog API keys without causing disruptions to your automations, follow a careful process:
- Generate new API keys: Start by creating new keys to replace the old ones.
- Update your systems: Ensure all systems and automations are configured to use the new keys.
- Verify functionality: Double-check that everything operates as expected with the new keys.
- Deactivate old keys: Once you're confident the new keys are working, disable the old ones.
For application keys, it's a good idea to link the new keys to a service or shared account. This approach helps streamline transitions and avoids relying on individual users. Using service accounts also adds an extra layer of security during key rotation, reducing potential risks.
What’s the best way to automate dashboards and monitors across dev, staging, and prod?
Automating dashboards and monitors across development, staging, and production environments in Datadog is best achieved through its API. With the API, you can programmatically create, update, and manage dashboards and monitors customized for each environment. By incorporating environment-specific configurations into your API requests, you can maintain consistency, cut down on manual work, and simplify management throughout your deployment pipeline.
How can I avoid high-cardinality tags when submitting custom metrics?
To keep your Datadog setup efficient, it's crucial to minimize the use of high-cardinality tags when submitting custom metrics. Tags with too many unique values can drive up costs and hurt performance. Instead, focus on using consistent and meaningful tag keys. Avoid dynamically generated tags that create excessive variability.
When working with DogStatsD or the API, limit the number of tags you include. Additionally, keep an eye on tag usage to ensure you're not adding unnecessary tags. This approach helps maintain smooth system monitoring without overloading your setup.