Maximizing Cloud Performance with Datadog
Explore how unified monitoring and AI-driven insights streamline cloud performance for SMBs, enhancing reliability and resource management.
Datadog simplifies cloud monitoring for small and medium-sized businesses (SMBs) by combining infrastructure, application, and security monitoring into one platform. With integrations for over 850 technologies, Datadog helps businesses improve performance, detect issues early, and optimize resources.
Key Benefits:
- Real-time Monitoring: Track metrics, logs, and traces across all systems.
- AI-Powered Detection: Automatically identify and prioritize issues.
- Custom Dashboards & Alerts: Monitor performance and set up tailored notifications.
- Resource Optimization: Reduce costs and improve efficiency with detailed insights.
- Uptime Monitoring: Catch problems before users notice with synthetic tests.
Quick Overview:
| Feature | What It Solves | Benefit |
|---|---|---|
| Unified Monitoring | Disconnected tools | Full system visibility |
| AI Detection (Watchdog) | Missed anomalies | Faster issue detection |
| Custom Alerts | Manual monitoring | Proactive problem-solving |
| Resource Management | Overuse or waste of resources | Cost savings |
| Synthetic Monitoring | Downtime or unnoticed issues | Improved reliability |
Datadog helps SMBs streamline cloud performance, reduce downtime, and manage resources efficiently, making it a go-to solution for modern cloud monitoring.
Datadog 101 Course | Datadog Tutorial for Beginners | SRE ...
Datadog's Main Cloud Monitoring Features
Datadog provides a range of tools designed to improve cloud performance and streamline operations for small and medium-sized businesses (SMBs).
Unified Infrastructure Monitoring
Datadog brings together metrics, logs, traces, and security signals into one platform, giving teams a clear view of their entire infrastructure. With support for many integrations, it bridges the gaps left by older systems. For example, one company increased its environment coverage from under 60% to 100% after switching to Datadog.
"Before Datadog, most teams had no idea how changes in their applications might affect others. Now all of the teams have the insight they need to work better together, and it's made each team more accountable."
- Darío Simonassi, Architecture Manager, Mercado Libre
This unified approach sets the stage for Datadog's advanced tools that make it easier to identify and address issues proactively.
Watchdog AI Detection System
Watchdog uses artificial intelligence to analyze vast amounts of data and identify potential problems before they disrupt operations. It detects anomalies, predicts bottlenecks, and even evaluates the business impact of issues automatically.
Here’s what Watchdog offers:
| Feature | Function | Benefit |
|---|---|---|
| Automated Root Cause Analysis | Pinpoints failure sources without manual effort | Speeds up problem resolution |
| Deployment Monitoring | Flags issues in canary or blue/green deployments | Avoids widespread failures |
| User Impact Assessment | Measures how users are affected during errors | Quickly evaluates problem scope |
| Latency Analysis | Identifies slowdowns in traces and sessions | Improves system performance |
"Watchdog helps our teams focus on the signals that matter by surfacing events that typically aren't caught by traditional monitors. Looking at Watchdog every morning helps me gain a better understanding of everything happening across our entire technology stack."
- Brent Montague, Site Reliability Architect, Cvent
While Watchdog automates detection, Datadog’s dashboards and alerts provide more control for monitoring specific metrics.
Custom Dashboards and Alerts
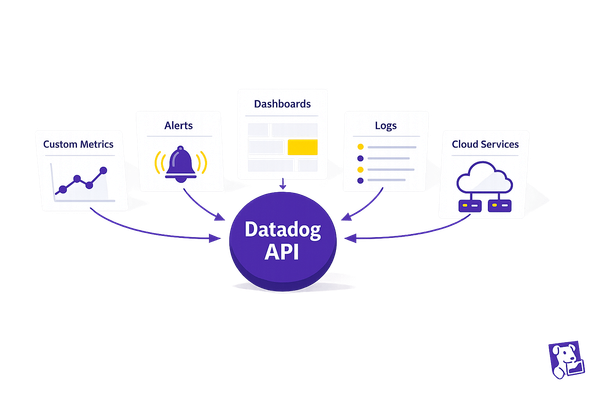
Datadog allows teams to create tailored dashboards and set up alerts to track performance in real time. The alert system includes features like tag-based targeting, template variables, composite monitors, and tiered notifications based on severity.
"Datadog helped us utilize Site Reliability Engineering concepts, allowing us to implement meaningful SLIs and SLOs. We now have 10 times the observability as before at less than half the cost. It just worked."
- Matt Ball, Chief Technology Officer, ParkMobile
"Being able to quickly update alerts and having so many monitors managed so effectively via the API has been very big for us - it's meant that we're very proactive about getting alerted to any system issues before they affect our users."
- Aaron Webber, Software Engineer, Nextdoor
Cloud Performance Optimization Methods
Finding and Fixing Performance Issues
Datadog's Application Performance Monitoring (APM) offers code-level distributed tracing, making it easier for teams to identify and resolve bottlenecks. By connecting traces with logs, metrics, and real user monitoring data, the platform helps pinpoint the root causes of performance problems.
Peloton is a great example of how this approach works. Yony Feng, CTO & Co-founder of Peloton, shared:
"Within the first 30 to 45 days, we were able to quickly identify the top five endpoints that had performance issues and reduce response times by 80 to 90%."
To link log entries with request traces, set DD_LOGS_INJECTION=true in your logs. Once performance bottlenecks are identified, the next step is improving resource usage.
Resource Usage Management
Managing cloud resources effectively requires a clear view of both performance and costs. Datadog's Cloud Cost Management provides insights into how resources are being used and where spending can be optimized.
| Optimization Type | Action | Potential Impact |
|---|---|---|
| Resource Cleanup | Remove unused RDS instances | Save up to $1,800/month |
| Service Migration | Switch to updated AWS services | Boost performance and reduce costs |
| Capacity Planning | Scale down overprovisioned workloads | Avoid unnecessary resource usage |
With data collected every five seconds, teams can make quick decisions about resource allocation. While efficient use of resources is key, monitoring uptime ensures systems stay reliable.
Uptime Monitoring with Synthetic Tests
Uptime monitoring helps detect potential problems before users notice. The Asian Development Bank saw this firsthand. Matt Farley, Senior IT Production Support Specialist, explained:
"After just two weeks of usage, we had three instances where Datadog Synthetic Monitoring immediately notified us of a problem stemming from an internal private location. We were able to restore functionality before any users were impacted."
To enhance reliability, integrate synthetic tests into your CI/CD pipeline. epilot.cloud experienced this benefit, as Viljami Kuosmanen, their Head of Engineering, noted:
"Adding Datadog synthetic browser tests to our CI pipelines was a big game changer for us. Developers are no longer avoiding production changes. They're now deploying with confidence."
Datadog's browser tests adapt automatically as your UI changes, reducing the need for manual updates. Combined with full-stack correlation - linking synthetic tests, metrics, traces, and logs - this approach ensures thorough system monitoring and performance tracking. Together, these tools support a proactive strategy for maintaining reliable cloud performance.
SMB Success with Datadog
Initial Challenges
Neto faced issues with their outdated infrastructure, which led to slow response times and a poor customer experience. During their migration to AWS, their existing open-source tools struggled to monitor temporary cloud components, leaving critical gaps in their system monitoring. These problems pushed them to adopt a unified monitoring solution.
Implementation Process
To address these challenges, Neto implemented Datadog with a clear, phased approach that ensured visibility throughout their cloud migration:
| Phase | Implementation Steps | Outcome |
|---|---|---|
| Initial Setup | Deploy Agent via Terraform | Simplified configuration |
| Migration Monitoring | Track dual environments | Consistent metric tracking |
| Service Integration | Connect AWS services | Accurate resource monitoring |
| Dashboard Creation | Build unified views | Comprehensive system visibility |
This structured process allowed Neto to maintain uninterrupted monitoring during their 18-month migration, with Datadog becoming their go-to monitoring platform.
Measured Improvements
The switch to Datadog delivered clear performance benefits:
"Now we have a new level of resilience. And on top of that, we now have platform-wide visibility, which we didn't have before."
– Justin Hennessy, VP of Engineering, Neto
Here’s what they achieved:
- Uninterrupted Monitoring: Maintained consistent oversight throughout the migration.
- Greater Reliability: Strengthened resilience with end-to-end monitoring.
- Better Customer Support: Enabled smoother customer growth with improved platform management.
"At the end of the day, Datadog is our central portal to the platform. It's the first place we go."
– Justin Hennessy, VP of Engineering, Neto
Additionally, companies incorporating AI into DevOps have reported a 50% drop in deployment failures. Neto’s experience highlights how Datadog enhances cloud performance and operational stability for SMBs.
Conclusion
Performance Benefits Overview
Datadog's platform helps small and medium-sized businesses (SMBs) enhance performance by offering cloud monitoring tools all in one place. With integrations for over 600 technologies, it ensures businesses can monitor their entire infrastructure effectively.
| Feature | Advantage |
|---|---|
| Real-time Monitoring | Provides full visibility across all infrastructure components |
| Proactive Issue Detection | Alerts users to potential problems with anomaly detection |
| Resource Optimization | Helps improve resource use with detailed performance insights |
| Operational Efficiency | Simplifies monitoring with easy-to-use dashboards |
To make the most of these features, follow this step-by-step implementation guide.
Implementation Guide
Introduce Datadog into your operations by starting small and refining your approach over time:
1. Initial Setup and Configuration
Begin by focusing on your most critical applications. Use automation to deploy the Datadog agent and establish a baseline for monitoring.
2. Optimization Strategy
Fine-tune your setup by configuring log patterns, applying strategic sampling, setting up effective tagging, and enabling anomaly detection for key metrics.
3. Continuous Improvement
Keep refining your system to maximize performance:
- Adjust how often metrics are collected to balance detail and efficiency.
- Update dashboards to reflect changing business needs.
- Set appropriate alert thresholds to avoid unnecessary notifications.
- Analyze how resources are being used and look for ways to improve.
FAQs
How does Datadog's AI-powered Watchdog improve issue detection compared to traditional monitoring tools?
Datadog's AI-powered Watchdog system revolutionizes issue detection by using machine learning to analyze your infrastructure and application performance in real time. Unlike traditional monitoring tools that rely on static thresholds, Watchdog automatically identifies anomalies such as unusual error rates, latency spikes, or network issues - without requiring manual setup for every potential failure scenario.
This proactive approach significantly reduces false alarms caused by normal fluctuations in metrics and ensures your team is alerted to critical issues faster. By streamlining the detection process, Watchdog helps you maintain optimal system performance and focus on resolving problems before they escalate.
How can small and medium-sized businesses use Datadog to optimize cloud performance?
To optimize cloud performance with Datadog, small and medium-sized businesses should start by installing the Datadog Agent on their servers or containers to collect critical metrics, logs, and traces. Configure integrations with your existing tools and platforms to create a seamless monitoring environment.
Next, monitor your applications by adding the APM library to your codebase. This allows you to track key performance metrics like latency, error rates, and throughput. For infrastructure monitoring, keep an eye on server performance (e.g., CPU usage, memory, and network activity), as well as containerized environments and cloud services.
Enable log collection to centralize and analyze logs from your applications and systems. For user experience monitoring, implement Real User Monitoring (RUM) by adding a simple JavaScript snippet to your web app to track interactions and satisfaction. Finally, take advantage of Datadog's dashboards, alerts, and anomaly detection features to identify and resolve performance issues in real time, ensuring your cloud infrastructure runs efficiently and reliably.
Can I integrate Datadog's synthetic monitoring into my CI/CD pipelines, and how does it help?
Yes, Datadog's synthetic monitoring can be seamlessly integrated into your CI/CD pipelines. By using the @datadog/datadog-ci package or API, you can trigger synthetic tests during the development process to catch potential issues early. This helps prevent breaking changes from reaching production environments.
With this integration, you can proactively monitor application performance, identify bottlenecks, and ensure system reliability before deployment. Test results can be reviewed directly within your CI platform, making it easier to troubleshoot and maintain smooth workflows. This ensures a more efficient development cycle and reliable cloud performance.

