Missing Metrics in Datadog: Troubleshooting Guide
Learn how to troubleshoot missing metrics in your monitoring system effectively, ensuring seamless operations and data visibility.
Missing metrics in Datadog can disrupt your monitoring and impact your operations. Here's how to quickly identify and fix the issue:
- Check Dashboard Settings: Ensure time ranges, filters, and widget queries are correct.
- Verify User Permissions: Confirm you have access to the required metrics and dashboards.
- Use Metrics Explorer: Search for missing metrics to confirm if they’re being ingested.
- Inspect the Datadog Agent: Ensure the agent is running, properly configured, and collecting metrics.
- Fix Integration Issues: Check integration setup, dependencies, and logs for errors.
- Review Network Settings: Test connectivity, check firewall rules, and verify API key configurations.
- Analyze Logs: Look for errors or warnings in agent and integration logs.
- Test Data Flow: Use Datadog tools or APIs to confirm metrics are reaching the platform.
Prevent Future Issues:
- Regularly update the Datadog Agent and integrations.
- Standardize dashboard setups for consistency.
- Monitor agent health, metric ingestion, and connectivity.
How Do I Troubleshoot Datadog? - Next LVL Programming
Basic Checks for Missing Metrics
Before jumping into advanced troubleshooting, it’s smart to start with some basic steps. These quick checks often help pinpoint why metrics might be missing and can get your dashboards back on track in no time.
Check Dashboard Settings
When metrics vanish unexpectedly, your dashboard settings are usually the first thing to inspect. One common issue? An incorrect time range. If your dashboard is set to display data from the last hour, but the metrics you’re looking for were generated yesterday, the data won’t show up.
Double-check the time selector in the top-right corner of your dashboard. Adjust it to cover the time period when the metrics were collected. For instance, if you’re investigating a performance issue from 2:00 PM yesterday, make sure the time range includes that specific window.
Filters can also block data. Look for any dashboard-level filters applied at the top of the page. These filters might unintentionally exclude the metrics you’re trying to view, especially if they’re too restrictive.
Another possible culprit is widget configuration. Click the pencil icon to edit a widget, and carefully review its query. Check for typos, incorrect aggregations, or missing tags that could be skewing your data display.
Check User Permissions
Sometimes, missing metrics aren’t about settings - they’re about access. If certain metrics or dashboards are unavailable, it could be a permissions issue.
Click on your profile to review your roles. Your roles define which metrics and dashboards you can access. If you’ve recently lost access to specific integrations or custom metrics, an administrator might need to update your permissions.
Team-based access restrictions can also limit visibility. If your role or team assignments have changed, consult your Datadog administrator. They can confirm your current access levels and make the necessary adjustments to restore your visibility.
Once permissions are verified, it’s time to move on to the Metrics Explorer.
Use the Metrics Explorer
After confirming your settings and permissions, the next step is to check the Metrics Explorer. This tool shows all the metrics being collected in your Datadog account and helps determine if the missing metrics are being ingested properly.
You can find the Metrics Explorer in the main navigation menu under "Metrics." Use the search box to type in the name of the missing metric. If it appears in the Explorer, that’s a good sign - Datadog is collecting the data, and the issue likely lies in your dashboard settings or permissions.
If the metric doesn’t show up, the issue might be with your Agent, integration configuration, or data connectivity.
Try searching for different variations of the metric name. It’s possible the metric has a slightly different name or is tagged differently than expected. The Metrics Explorer can help you confirm the correct names and tags.
Another helpful feature? The Metrics Explorer shows when the data was last received. This can give you insight into whether there’s an ongoing collection issue or if the problem occurred at a specific time.
Agent and Integration Setup
After completing basic dashboard and permission checks, if metrics are still missing, the next step is to focus on the Datadog Agent and its integrations. These are essential for collecting metrics, and any misconfiguration here can lead to large-scale data collection issues.
Check Datadog Agent Status
The first thing to confirm is whether the Datadog Agent is running and functioning as expected. If the agent is stopped or incorrectly configured, no metrics will be collected, leaving your dashboards blank.
Verify the agent is running. On Linux systems, use the status command to check the agent's current state. If it’s not running, start it using your system's service manager.
Check the configuration file located at /etc/datadog-agent/datadog.yaml. Ensure the API key is correctly set in this file, as a missing or invalid API key will prevent the agent from communicating with Datadog’s servers.
Dynamic hostnames can cause inconsistencies in data collection. To address this, use hostname tagging in the agent configuration. This ensures consistent tagging even if hostnames change over time.
If your infrastructure uses a proxy, confirm that the agent is configured to work through it. Add the proxy server details to the configuration file so the agent can communicate with Datadog's cloud without issues.
Once you’ve verified that the agent is running properly, move on to enabling system metrics collection.
Turn On System Metrics Collection
If basic infrastructure metrics like CPU, memory, and disk usage are missing from your dashboards, it’s possible that system metrics collection is disabled in the agent configuration.
Check the datadog.yaml file. Look for the line collect_system_metrics: true. If this line is missing or set to false, the agent will not collect essential system metrics.
To enable it, edit the datadog.yaml file and add or update the line to collect_system_metrics: true. After making this change, restart the Datadog Agent to apply the updates. Once the agent is back online, verify your dashboards to confirm that system metrics are being collected correctly.
If system metrics are flowing in but specific service metrics are still missing, the issue might lie with integration configurations.
Fix Integration Problems
Integration issues are a common reason for missing metrics, especially when monitoring specific services like databases, web servers, or cloud platforms. These problems often arise from incorrect configurations, missing dependencies, or version mismatches.
Review the integration documentation on the Datadog Integrations Page. Each integration has a detailed guide outlining its setup and requirements. Make sure your configuration aligns with these recommendations.
Check the integration files located in /etc/datadog-agent/conf.d/. Each integration has its own subdirectory containing configuration files that specify which metrics to collect and how to connect to the service. Use the datadog-agent configcheck command to validate these files. This command will flag any syntax errors or missing fields in the configuration.
Missing dependencies can prevent integrations from working. Many integrations rely on specific Python libraries or system packages. If an integration fails to start, review the agent logs for error messages related to missing dependencies. Install any required packages using your system's package manager or, for Python libraries, run pip install <library-name>.
After updating configurations or installing dependencies, restart the Datadog Agent to ensure the changes take effect. This should resolve most integration-related metric collection issues.
Data Source and Connection Issues
If your agent and integration checks pass but metrics are still missing, the issue might be related to connectivity. Even when the Datadog Agent is running correctly and integrations are properly configured, metrics might not show up in your dashboards due to problems in the connection between your data sources and Datadog's platform. Issues like network disruptions, firewall restrictions, or connectivity problems can silently block metrics without generating clear error messages.
Check Network and Connection Settings
A solid network connection is key to collecting and transmitting metrics successfully. Without proper communication between your systems and Datadog's servers, no amount of configuration adjustments will fix missing metrics.
Start with a basic connectivity test to Datadog's servers. Run ping app.datadoghq.com to confirm your host can reach Datadog's infrastructure. If the ping fails, it could point to DNS resolution problems or network routing issues that need immediate attention.
DNS settings are often a culprit. Double-check that your DNS configuration can resolve Datadog's domain names correctly. If you're using custom DNS servers, ensure they have proper upstream connectivity.
Firewall rules are a common source of blocked communications. Review your firewall settings to confirm that traffic can flow both to and from Datadog's servers. The Datadog Agent requires outbound access to send metrics and receive updates, so you may need to whitelist specific IP ranges provided by Datadog.
If your setup routes traffic through a proxy server, ensure the Datadog Agent is configured to use it. Update the agent's configuration file with the correct proxy details, including authentication credentials if needed.
If connectivity issues persist, verify your API key. After making changes to network or configuration settings, restart the Datadog Agent with sudo systemctl restart datadog-agent to apply the updates.
Once you've confirmed your network and firewall settings, check the agent logs for any lingering errors.
Review Logs for Errors
Agent logs are a treasure trove of information when it comes to diagnosing connection, authentication, or data transmission problems. These logs often provide the exact details needed to resolve connectivity issues.
Focus on log entries tagged as ERROR, WARNING, or INFO. For example, connection timeout errors typically indicate network latency or firewall issues, while authentication errors might suggest incorrect API keys or SSL/TLS handshake problems.
Integration-specific logs can also be insightful. Many integrations generate their own logs, which can reveal whether they are successfully connecting to and collecting metrics from the target service. For instance, a database integration might log connection failures if the credentials are incorrect or the database server is unreachable.
In Kubernetes environments, keep in mind that container log formatting can sometimes disrupt proper metric extraction and transmission.
Once you've reviewed the logs, test the data flow to ensure the issue is resolved.
Test Data Flow to Datadog
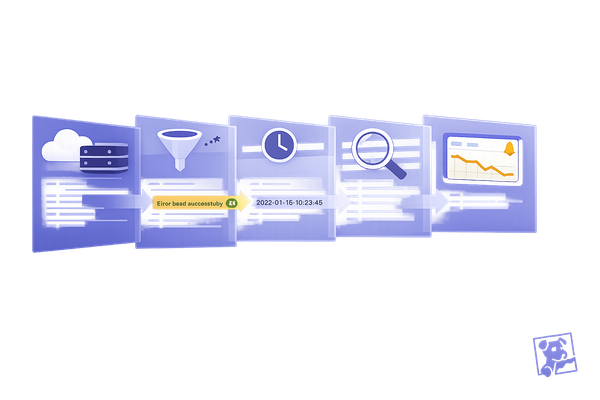
To confirm that metrics are reaching Datadog, you need to test the entire pipeline - from data collection to transmission and storage. This helps identify where metrics might be getting lost.
Use Datadog's Metrics Explorer to check for data arrival. This tool shows real-time metric ingestion and can confirm whether specific metrics are being received. If metrics show up in the explorer but not in your dashboards, the problem might be related to dashboard configuration rather than data transmission.
Network monitoring tools can help track data transmission. Tools like packet capture software or network monitoring applications can verify whether the Datadog Agent is sending data packets to Datadog's servers. These tools can uncover low-level network issues that might not appear in application logs.
You can also manually test metric submission using Datadog's API endpoints. This bypasses the agent and can help determine whether connectivity issues affect all communication with Datadog's platform or are limited to the agent itself.
Finally, review your account's metric usage and billing information in Datadog's interface. If Datadog is receiving and processing metrics, they should appear in your usage statistics - even if they aren't visible in your dashboards. If they're completely absent, it indicates that metrics aren't reaching Datadog at all.
For issues related to application performance monitoring (APM), check tracer debug logs. These logs provide detailed information about trace submission attempts and can reveal connectivity problems impacting APM data.
How to Prevent Missing Metrics
To avoid disruptions caused by missing metrics, it's crucial to establish reliable routines and processes that proactively address potential issues. By implementing structured workflows, you can ensure your monitoring systems remain consistent and effective.
Keep Datadog Agent and Integrations Current
Keeping your Datadog Agent and integrations up to date is essential for avoiding compatibility problems and ensuring smooth data collection. Older versions often come with security risks, missing features, or compatibility issues that could interfere with your monitoring efforts.
Datadog makes it easier to stay current. Agent installations now include the latest versions of official integrations, but you don’t have to wait for a full agent update to benefit from improvements. Use the datadog-agent integration command to install updates as soon as they’re released. This allows you to address issues and access new features without delay.
Make updating a monthly habit. Start by checking which integrations need updates using datadog-agent integration show. Then, on Linux systems, update specific integrations with the command:
sudo -u dd-agent -- datadog-agent integration install datadog-<integration_name>==<version>.
Ensure your Datadog Agent is running version 6.9.0 or later to use the integration command effectively. If your agent is outdated, prioritize upgrading it before tackling integration updates.
Assign team members to oversee updates. Updates often get overlooked when treated as optional, so designate specific responsibilities. Create a checklist that includes tasks like checking for agent updates, reviewing changelogs, and testing dashboards after updates.
Set up automated notifications for new releases. While you shouldn’t automatically update production systems, being aware of available updates helps you plan maintenance and apply security patches promptly.
Once your system is up to date, focus on standardizing dashboard configurations to further reduce errors.
Set Standard Dashboard Setups
A consistent dashboard structure minimizes errors and simplifies troubleshooting. When your team uses standardized templates and configurations, they can spend more time analyzing data and less time fixing setup issues.
Start with reusable templates. Design a base template with pre-configured layouts, placeholders for common metrics, and consistent controls like time ranges and alert displays. This approach ensures every new dashboard begins with a solid foundation.
Leverage variables to make dashboards more versatile. For instance, use variables to switch between environments, filter data by service, or adjust metric scopes - all without duplicating dashboards.
Keep formatting consistent. Use uniform layouts, group related widgets together, and include clear headers for easy navigation. Highlight critical alerts and key performance indicators (KPIs) at the top for quick visibility. Place performance trends in the middle and detailed metrics at the bottom for deeper analysis.
Tagging is another key element. Use standardized tags like env:, service:, team:, and priority: across your infrastructure. These tags make filtering easier and help templates work seamlessly across different environments.
Add documentation widgets to your dashboards. Use these to explain sections, interpret metrics, and provide troubleshooting tips. Clear documentation reduces confusion and speeds up incident response.
Regularly review and update your dashboards. Schedule monthly reviews to remove redundant widgets, adjust thresholds, and refine layouts as your infrastructure evolves. This keeps your dashboards relevant and avoids clutter.
Use Datadog Resources
Beyond updates and standard setups, Datadog offers tools to help you stay ahead of potential data loss.
Leverage Watchdog’s machine learning capabilities. This feature automatically flags unusual behavior without requiring manual alerts. It can detect anomalies in your metrics that might signal data collection issues.
Set up anomaly, forecast, and outlier monitors. These tools can identify when specific hosts or zones deviate from normal patterns, often indicating configuration drift or connectivity problems.
Monitor the health of your monitoring setup. Create alerts for agent connectivity, integration status, and metric ingestion rates. Tracking metrics like API response times, HTTP status codes, and error budgets can provide early warnings of potential issues.
Automate browser tests to monitor user-facing functionality across devices and locations. These tests can catch problems that infrastructure metrics might miss, particularly those related to user interactions.
Use Metric Correlations to analyze related metrics when issues arise. This tool helps you see the bigger picture and identify root causes when metrics behave unexpectedly.
For teams with limited monitoring experience, Datadog’s documentation and troubleshooting guides are invaluable. Keep these resources bookmarked and incorporate them into your team’s workflows.
Finally, focus on the four golden signals of monitoring - latency, traffic, errors, and saturation. Alerts based on these metrics can help you catch infrastructure problems early, preventing them from affecting your business-critical metrics.
Conclusion
Gaps in metrics can leave you flying blind when it comes to monitoring. But by following a structured troubleshooting approach - from checking dashboards to validating network configurations - you can ensure your monitoring remains solid and dependable. This logical process starts with simple steps like verifying dashboards and permissions, moves through agent and integration checks, and concludes with a deep dive into data source connections and network setups.
The steps outlined here aren't just about solving immediate problems - they're about building a reliable foundation for long-term monitoring. Proactive maintenance is the cornerstone of this reliability. Regularly updating agents, standardizing dashboard setups, and sticking to consistent monitoring routines can help prevent problems before they even arise. For small and medium-sized businesses, these practices save time on troubleshooting and allow more focus on growth and innovation.
Think of your monitoring system as critical as any production system. Keep detailed documentation of your configurations, stick to update schedules, and establish clear workflows for troubleshooting. This disciplined approach ensures that your Datadog setup remains a dependable tool for making informed business decisions, not a source of unexpected headaches. Regularly reviewing dashboards, agents, and network settings is key to keeping your monitoring system running smoothly.
Your system should always provide the insights you need, when you need them. By applying the troubleshooting steps and preventive strategies shared in this guide, you can maintain consistent visibility into your metrics and keep your operations on track.
For more tailored advice for small and medium-sized businesses, check out Scaling with Datadog for SMBs.
FAQs
How can I properly configure the Datadog Agent to avoid missing metrics in the future?
To ensure you don’t miss out on important metrics, it’s crucial to configure your Datadog Agent properly. Start by verifying that both system and custom metric collection are enabled. Make sure any custom checks and integrations are correctly set up, and confirm the Agent has the required permissions to access the necessary log and metric files.
Keep an eye on the Agent’s internal metrics regularly to identify any gaps in data collection. If issues arise, tweak your configurations to address them promptly. Taking these proactive measures can help maintain steady metric reporting and prevent disruptions down the line.
What are common network issues that might prevent metrics from showing up in Datadog, and how can I resolve them?
Network problems can sometimes lead to missing metrics in Datadog. Common culprits include firewall rules blocking UDP traffic, DNS resolution issues, proxy restrictions, or incorrect network configurations. These disruptions can interfere with the connection between your systems and Datadog's platform.
To address these issues, start by confirming that essential UDP ports, like 8125 for StatsD, are open in your firewall settings. Then, check your DNS configurations to ensure proper name resolution and review any proxy settings to confirm they permit Datadog traffic. Examining your network logs can help identify blocked or dropped packets. Making sure the Datadog Agent has the right network permissions and setup is crucial for regaining access to your metrics.
How can I check if my Datadog user permissions are preventing me from seeing certain metrics?
To check if your user permissions are limiting access to certain metrics in Datadog, head over to Organization Settings and look at your role under User Management. Make sure your role includes the permissions needed to view metrics and dashboards, as these determine the data you're allowed to access.
If your role is missing the required permissions, reach out to your account administrator to update your role or provide additional access. Having the right permissions is key to accessing all the metrics you need in your Datadog environment.

