
Real-Time Monitoring Basics with Datadog
Learn how real-time monitoring can enhance system performance and reduce downtime for small and medium-sized businesses using comprehensive tools.
Datadog simplifies real-time monitoring for small and medium-sized businesses (SMBs), helping them track system health, application performance, and logs in one place. Here's a quick breakdown:
- Why Real-Time Monitoring Matters: It provides instant updates on system health, preventing downtime and disruptions.
- Challenges for SMBs: Limited resources, tight budgets, and complex environments make monitoring harder for smaller teams.
- Key Datadog Features:
- Dashboards: Monitor servers, apps, and services in one view.
- Automated Alerts: Get instant notifications for issues.
- Application Insights: Identify bottlenecks with tools like distributed tracing and flame graphs.
- Log Management: Troubleshoot faster with advanced search and live log tailing.
How to Get Started:
- Install the Datadog Agent on your systems.
- Connect your cloud platforms, databases, and services.
- Create custom dashboards to track key metrics.
Datadog's tools are designed to save time, reduce downtime, and keep your systems running smoothly. Whether you're monitoring CPU usage, tracking API performance, or managing logs, Datadog helps SMBs stay ahead of issues.
Main Datadog Monitoring Features
System and Server Monitoring
Datadog's infrastructure monitoring delivers real-time metrics like CPU usage, memory, disk I/O, and network traffic across hybrid environments. It automatically detects Kubernetes pods and AWS EC2 instances, while grouping containers using Live Containers. According to Datadog's 2024 Infrastructure Report, 63% of small and medium-sized businesses tracking these metrics cut unplanned downtime by over 40% within six months.
Let’s dive into how Datadog's Application Performance Monitoring tackles software bottlenecks.
Application Tracking
Datadog's Application Performance Monitoring (APM) is designed to pinpoint performance issues and maintain application health with distributed tracing. For example, a SaaS startup used Datadog's APM to slash API latency from 2.5 seconds to just 200ms by identifying a slow database query through flame graphs.
Some standout APM features include:
- Code-level performance insights
- Automated service dependency mapping
- Real-time error tracking
- Custom metric collection
Next, let’s look at how Datadog's log management simplifies troubleshooting.
Log Collection and Search
Datadog's log management tools make troubleshooting fast and efficient. The Log Explorer allows advanced search syntax and live log tailing, helping teams pinpoint issues quickly. Teams using saved log queries have reported a 55% reduction in Mean Time to Resolution (MTTR).
Datadog also connects logs with metrics and traces through its Correlated Logs and Traces feature. This integration provides context-rich debugging by linking relevant log entries with application traces.
| Feature Category | Key Capabilities | User Satisfaction |
|---|---|---|
| Log Management | Phrase search, TCP/UDP collection, journald support | 90% |
"This integration helped a media company resolve critical incidents 50% faster." - Datadog's 2024 Infrastructure Report
Datadog 101 Course | Datadog Tutorial for Beginners | SRE | DevOps
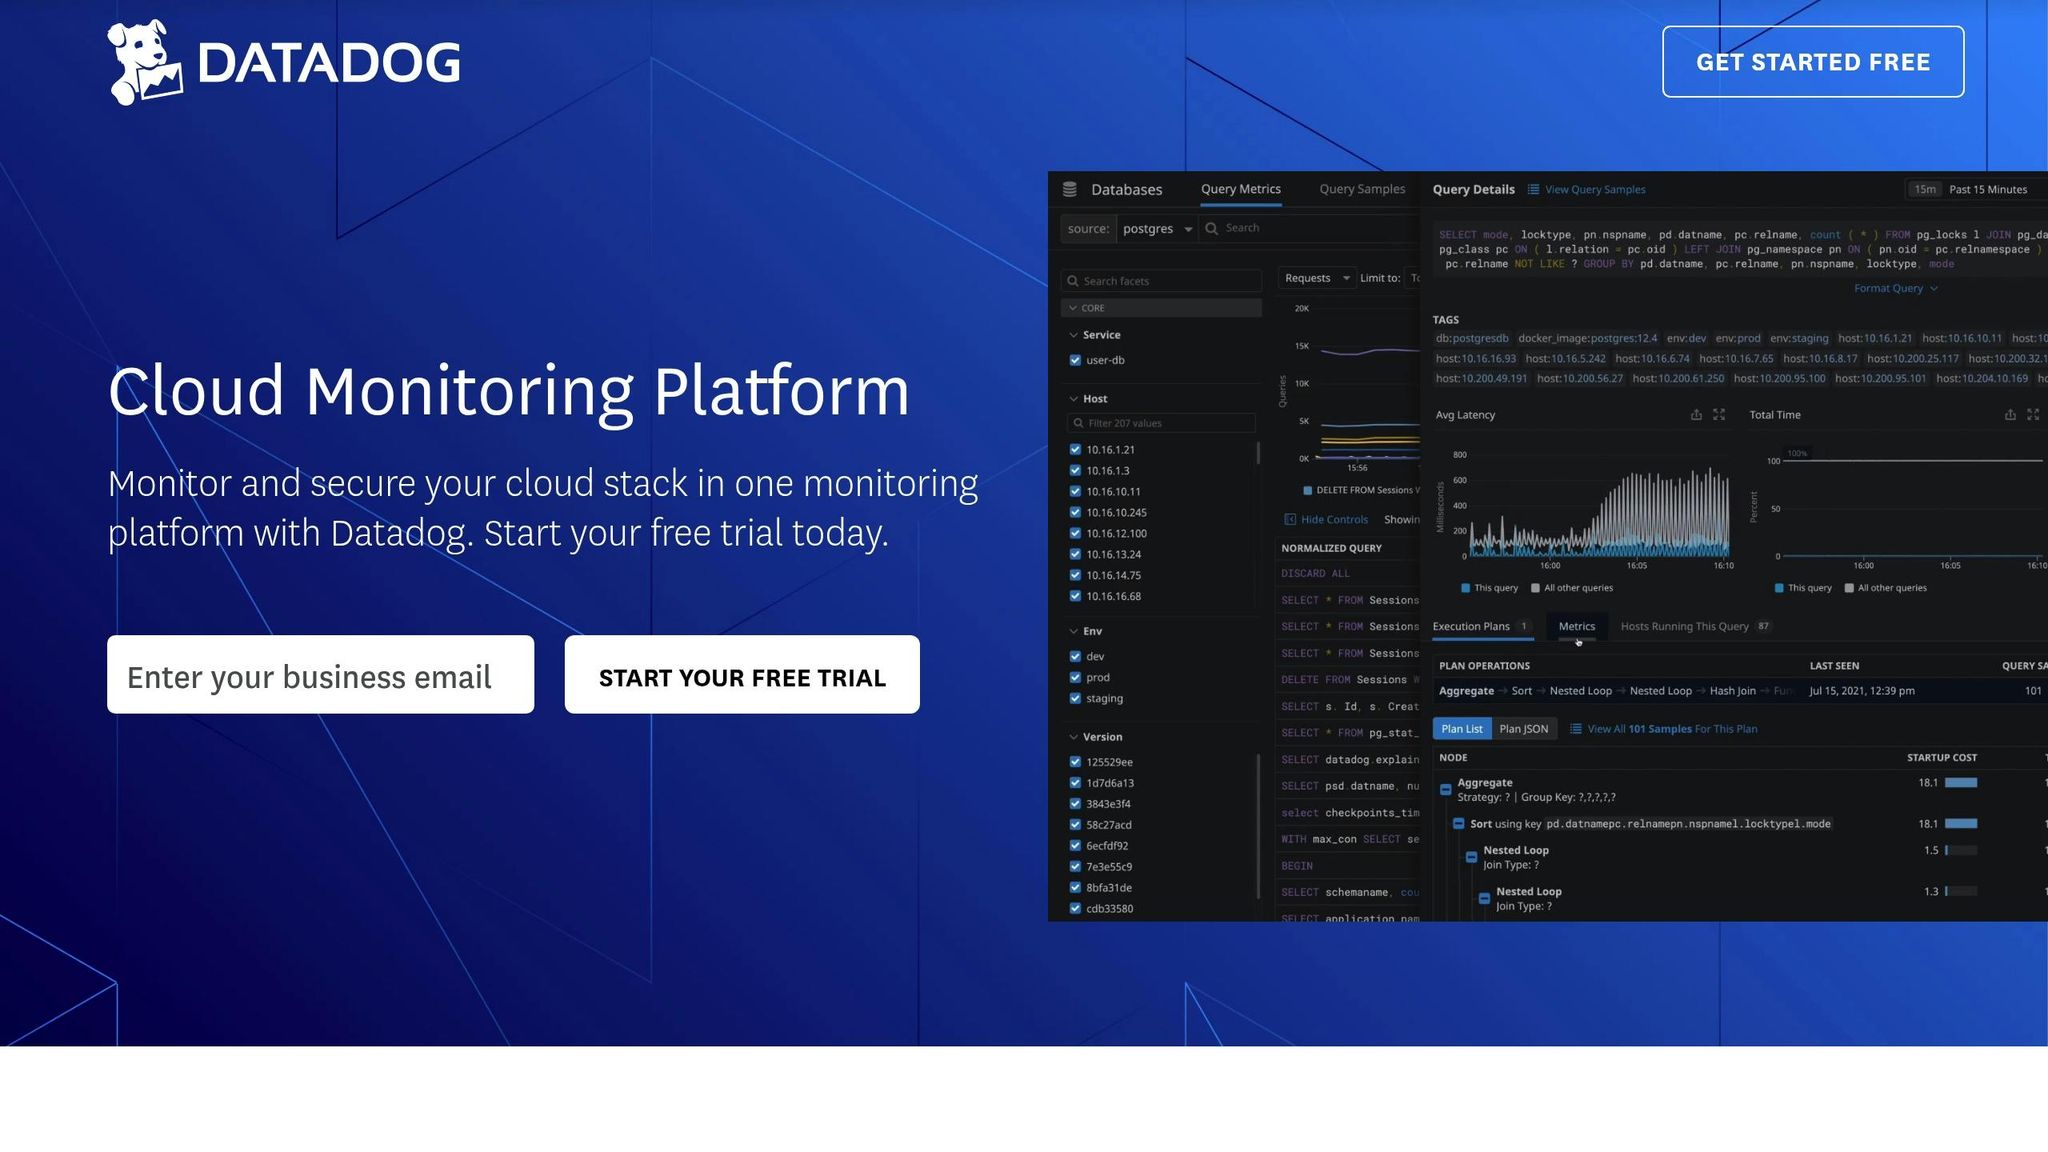
Setting Up Datadog Monitoring
Once you've reviewed Datadog's features, it's time to set up your monitoring environment to start gathering insights.
Installing the Datadog Agent
The Datadog Agent is essential for collecting metrics, traces, and logs. The installation process depends on your operating system or environment.
For AWS environments, use AWS Systems Manager to deploy the agent on EC2 instances:
- Open AWS Systems Manager.
- Select Run Command.
- Choose AWS-ConfigureAWSPackage.
- Set the package name to datadog-agent.
For Docker containers, use the following command:
docker run -d --name datadog-agent \
  -v /var/run/docker.sock:/var/run/docker.sock:ro \
  -v /proc/:/host/proc/:ro \
  -v /sys/fs/cgroup/:/host/sys/fs/cgroup:ro \
  -e DD_API_KEY=<YOUR_API_KEY> \
  gcr.io/datadoghq/agent:latest
Connecting Your Services
Datadog's integration marketplace makes it easy to link your services:
- Cloud platforms: Set up API authentication.
- Databases: Provide the connection string.
- Message queues: Enter the endpoint details.
Creating Monitoring Dashboards
Datadog dashboards let you visualize key metrics and track system performance. Here are some examples:
- System Health Dashboard: Focus on metrics like CPU usage, memory, disk I/O, and network activity.
- Application Performance Dashboard: Keep an eye on response times, error rates, request volumes, and database performance.
- Business Metrics Dashboard: Combine metrics such as transaction rates, user sessions, API usage, and SLOs.
Use template variables to make dashboards reusable across environments. Datadog's correlation tools help you identify relationships between metrics, enabling faster issue detection. These dashboards provide a clear view of your systems, helping you stay on top of critical events.
Monitoring Tips and Methods
Monitoring Automation
Small and medium-sized businesses (SMBs) can use Datadog tools to simplify workflows, cut down on manual tasks, and keep systems running smoothly. Here's how to get started with automation:
Log Processing Rules
Set up rules to parse and filter log data effectively. Here's an example configuration:
# Example log processing rule
rules:
  - type: processor
    name: parse_message
    pattern: '%{timestamp} %{status} %{message}'
    sources:
      - nginx.access
Automated Metric Collection
Automate the collection of metrics using the Datadog API. Below is a Python example:
from datadog import initialize, api
import time

options = {
    'api_key': '<YOUR_API_KEY>',
    'app_key': '<YOUR_APP_KEY>'
}

initialize(**options)
api.Metric.send(metric='app.requests',
                points=[(time.time(), 1)],
                tags=['env:prod'])
Monitor Management as Code
Leverage the Datadog Terraform provider to manage monitors programmatically. Here's a sample setup:
resource "datadog_monitor" "cpu_monitor" {
  name    = "CPU Usage Alert"
  type    = "metric alert"
  query   = "avg(last_5m):avg:system.cpu.user{*} > 80"
  message = "CPU usage is above 80%"
}
Summary
Main Points Review
Datadog's real-time monitoring tools give SMBs a clear view of their infrastructure and applications. Here’s a quick recap of the key features and practices covered in this guide:
Core Monitoring Features
- Keep tabs on CPU, memory, and disk usage
- Track application performance with metrics and traces
- Manage logs with advanced search options
- Use dashboards to visualize key performance indicators
Getting Started
- Install agents across various operating systems
- Set up integrations to pull data from multiple sources
- Organize resources with tags and configure alerts for better management
- Configure alerts to catch issues early
Automation Advantages
- Automate metric collection to cut down on manual monitoring
- Use infrastructure as code for consistent setups
- Simplify log processing with predefined rules
- Manage alerts automatically to save time
These basics can help streamline your monitoring processes and improve efficiency.
Next Steps with Datadog
Take your monitoring to the next level with approaches designed for SMBs. The Scaling with Datadog for SMBs blog provides tips on:
- Fine-tuning your monitoring setup
- Expanding coverage as your infrastructure grows
- Using advanced alerting methods
- Making the most of automation features
FAQs
How does Datadog's real-time monitoring help small and medium-sized businesses minimize downtime?
Datadog's real-time monitoring empowers small and medium-sized businesses (SMBs) to identify and address system issues instantly, reducing the risk of prolonged downtime. By providing live insights into application and infrastructure performance, Datadog enables teams to detect anomalies, track key metrics, and respond to potential problems before they escalate.
With customizable dashboards and automated alerts, SMBs can stay informed about critical system changes and ensure smooth operations. This proactive approach not only minimizes downtime but also helps maintain customer satisfaction and business continuity.
How can I seamlessly integrate Datadog with my current cloud platforms and databases?
To integrate Datadog with your cloud platforms and databases, start by installing the Datadog Agent on your servers or containers. Once installed, configure the Agent to monitor your specific cloud services and databases by enabling the appropriate integrations within the Datadog platform. You can find detailed setup instructions for each integration in Datadog's documentation.
After configuration, create dashboards to visualize key metrics and set up alerts to notify you of critical events in real time. This ensures you stay proactive in monitoring and maintaining the health of your systems. For small and medium-sized businesses, optimizing the setup can help ensure efficient performance and scalability as your systems grow.
How do Datadog's log management features help with faster troubleshooting and reducing Mean Time to Resolution (MTTR)?
Datadog's log management tools streamline troubleshooting by centralizing all your logs in one place, making it easy to search, filter, and analyze data in real time. This ensures that teams can quickly identify and pinpoint issues without sifting through scattered logs across multiple systems.
With features like log correlation, you can connect logs to related metrics and traces, offering deeper insights into the root cause of problems. This holistic view helps reduce Mean Time to Resolution (MTTR) by enabling faster diagnosis and resolution of issues, minimizing downtime, and improving system reliability.


