Scheduled Monitoring for SMB Growth in Datadog
Automate your IT monitoring with scheduled checks to enhance performance, reduce downtime, and support growth for small and medium-sized businesses.
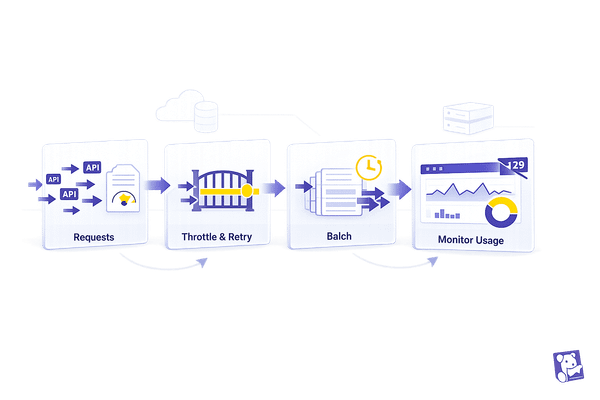
Datadog's scheduled monitoring helps small and medium-sized businesses (SMBs) manage their IT systems efficiently, even with limited resources. By automating regular system checks, it identifies potential issues before they escalate, minimizing downtime and improving reliability. For SMBs, this means fewer disruptions, better performance, and the ability to focus on growth without constant manual oversight.
Key Takeaways:
- Automated Monitoring: Regular checks for system health, performance, and security.
- Cost-Effective: Starting at $15 per host/month, it’s accessible for smaller budgets.
- Custom Alerts: Tailored notifications for specific teams or issues.
- AI-Powered Insights: Detects anomalies and predicts potential problems.
- Log and User Monitoring: Tracks logs for errors and simulates user journeys to prevent failures.
Switching from manual to automated monitoring saves time, reduces errors, and scales with your business. For SMBs, this approach ensures reliability and supports growth without the need for large IT teams.
Datadog Tutorials | Alerting and Monitoring
Core Scheduled Monitoring Tasks in Datadog
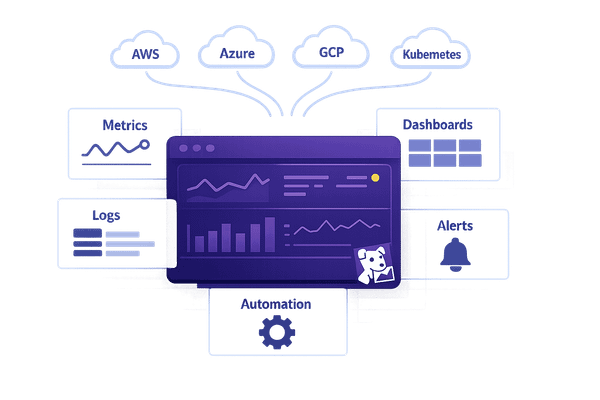
Datadog automates crucial checks to ensure your systems stay healthy and issues are addressed before they escalate. Here's a closer look at the tasks that help monitor your infrastructure, applications, logs, and user interactions.
Infrastructure Health Monitoring
Keeping an eye on server health is pivotal. Datadog monitors key metrics like CPU usage, memory, and disk space across your servers, sending alerts when thresholds are exceeded. This helps you tackle potential problems before they disrupt operations.
With tag-based searches, you can easily separate environments, such as production from development, and leverage continuous configuration checks to uncover vulnerabilities. Datadog also prioritizes risks based on their potential impact on your business.
Another standout feature is compliance monitoring. Datadog supports frameworks like PCI DSS, SOC 2, HIPAA, GDPR, and CIS, making it a valuable tool for SMBs navigating regulatory requirements without dedicated compliance teams.
"Datadog's unified DevSecOps approach has improved our ability to manage risks, prioritize responses, and remediate issues. As a result, we've been able to reduce tool sprawl and foster a culture of shared security ownership throughout the organization." - Eric Saam, VP of Engineering, Business Insider
These tools ensure you can address issues proactively, preserving both customer trust and operational stability.
Application Performance Monitoring (APM)
Datadog's Application Performance Monitoring focuses on how your software performs from the end-user's perspective. It tracks response times, error rates, and throughput, issuing alerts when performance deviates from expected levels.
APM traces pinpoint bottlenecks in your app stack, whether they’re related to slow database queries or other inefficiencies. For example, if database performance dips, Datadog’s scheduled monitoring can catch it early, preventing a poor user experience.
For SMBs managing high-traffic platforms like e-commerce sites, regular performance checks during peak times ensure systems remain responsive. This consistency is vital for supporting business growth and maintaining a reliable user experience.
Log Monitoring and Alerting
Logs often reveal issues that performance metrics might miss. Datadog scans your application logs on a set schedule, identifying error patterns, security concerns, or unusual activity. For instance, a sudden surge in failed login attempts could indicate a security breach.
If payment processing errors occur, log monitoring can trace the problem to its source - be it application code, database connectivity, or an external service.
Scheduled log monitoring also simplifies compliance for SMBs. By flagging events that require documentation, Datadog reduces the need for manual log reviews, helping businesses stay audit-ready while focusing on operations.
Synthetic Monitoring for User Journeys
Synthetic monitoring simulates how users interact with your website or app by running scheduled tests. These tests catch potential issues before they impact real customers.
"Synthetic monitoring is a way for folks to ensure performance issues by simulating real user traffic. A synthetic end-to-end test can validate an entire user flow is accomplished from start to finish." - Bridgitte Kwong, Product Marketing Manager at Datadog
You can design end-to-end tests that replicate critical user journeys. For an e-commerce site, this might involve browsing products, adding items to a cart, completing checkout, and confirming an order.
"Real-user monitoring lets you capture what users have already done. Proactive synthetic monitoring lets you capture issues before users encounter them." - Mike Peralta, Senior Product Manager at Datadog
With flexible scheduling, you can balance constant uptime checks with deeper tests at regular intervals, optimizing both performance tracking and cost. Datadog’s test templates, informed by insights from over 11,000 Synthetic Monitoring customers, make setup quick and straightforward.
CI/CD pipeline integration adds another layer of reliability. Synthetic tests can run whenever new code is deployed, catching potential issues before they reach production. Up next, learn how to automate these monitoring tasks for even greater efficiency.
Automating Scheduled Monitoring in Datadog
Streamlining monitoring in Datadog can revolutionize how small and medium-sized businesses (SMBs) manage their systems. By automating routine checks, alerts are triggered only when action is required, saving time and ensuring critical issues don’t go unnoticed. Here’s how you can set up recurring monitors, use dynamic tagging, and implement AI-powered alerts to simplify your monitoring processes.
Setting Up Recurring Monitors
Recurring monitors are a game-changer for reducing manual oversight. These monitors automatically track system health and performance based on thresholds you set, ensuring you’re alerted only when necessary.
For example, you can configure monitors to:
- Track Kubernetes pod CPU usage, sending alerts if usage exceeds 80% for more than 10 minutes.
- Monitor Java application response times to catch performance dips.
- Set log-based alerts to flag unusual security events, such as failed logins or unauthorized access attempts.
Fine-tune thresholds to strike a balance between catching real issues and avoiding false alarms.
| Monitor Type | Purpose | Example Metrics |
|---|---|---|
| Metric | Tracks performance | Memory, throughput |
| Log | Detects specific keywords | Security events |
| Event | Monitors activities | Infrastructure changes, deployments |
| APM | Tracks app performance | Latency, error rates |
| Anomaly | Spots unusual patterns | Traffic spikes, usage trends |
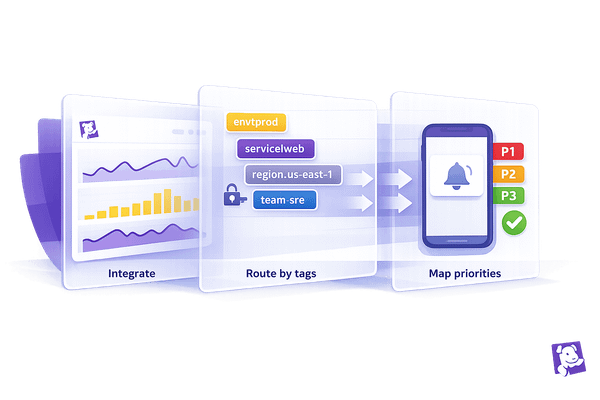
Using Tags and Dynamic Alerting
Tags take recurring monitors a step further by refining alert routing. These tags, formatted as key:value pairs or simple values, add context to your performance data and metrics. For instance, tags like team, service, or env help route alerts to the right teams automatically.
Dynamic alerting enhances this by embedding detailed information about the instance or service that triggered the alert. For example:
- Use tags like
env:prod,email,assignmentgroup, andslackto route alerts effectively. - A warning for a production host can notify support via email, send a message to a Slack channel, or even create a ServiceNow ticket.
One of the keys to success here is defining clear ownership for notification rules. Each rule should have a specific owner and be scoped to a particular team. Start small by focusing on immediate needs, such as team:payment-processing AND env:prod AND priority:P0. Once this setup works smoothly, expand the scope by including additional priorities or teams.
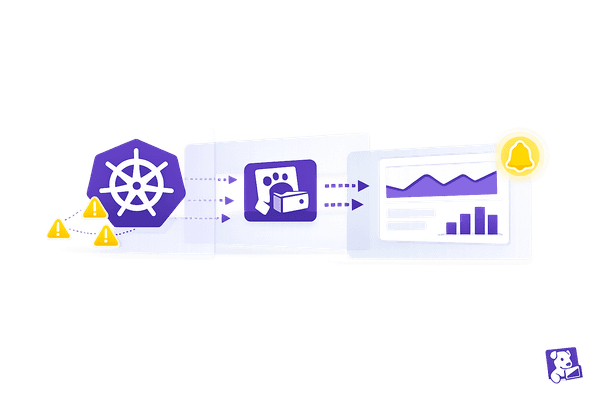
Implementing AI-Powered Monitoring
Datadog’s Watchdog AI brings automation to the next level by detecting anomalies, forecasting potential bottlenecks, and conducting root cause analyses. Unlike static thresholds, Watchdog continuously learns your system’s behavior, adapting to changes in real time. This makes it especially useful for SMBs, as it reduces the need for deep expertise in setting up monitoring thresholds.
Watchdog offers both fully automated anomaly detection and user-defined anomaly monitors, giving you a blend of automation and control. For instance:
- High-priority issues like service outages or security breaches require immediate 24/7 responses.
- Moderate-priority concerns, such as performance issues or storage nearing capacity, can be addressed during business hours.
- Low-priority warnings, like trend analysis, can wait until the next business day.
| Priority Level | Response Time | Example Triggers |
|---|---|---|
| High | Immediate (24/7) | Service outages, security breaches |
| Moderate | Business hours | Performance issues, storage reaching 80% |
| Low | Next business day | Non-critical warnings, trend analysis |
Customizing Scheduled Monitoring for SMB Needs
Automated checks are just the beginning - customizing your Datadog monitoring ensures it aligns with your SMB's specific needs, helping you focus on critical systems while managing costs effectively.
Aligning Monitoring with Business Priorities
Your monitoring setup should directly support your business goals. Start by identifying which systems are essential to your operations and when your users are most active. For instance, an e-commerce business should prioritize monitoring payment systems during peak shopping hours, while a B2B company might focus on API performance during standard business hours.
Instead of tracking every possible metric, focus on symptom-based alerts that flag real issues like slow page loads, failed transactions, or system downtime. This approach minimizes distractions and keeps your team focused on what truly matters.
Timing also plays a crucial role. Tailor your monitoring schedules to match your business calendar. A retailer, for instance, might need heightened monitoring during Black Friday, while a subscription-based business may require extra attention during billing cycles.
Understanding your business impact hierarchy is essential. Revenue-generating services and customer-facing applications should receive the most attention, while internal tools may only need basic health checks. Once priorities are clear, adjust alert thresholds to strike the right balance between performance and cost.
Tuning Alerts for Cost and Efficiency
Alert tuning is tricky - too many alerts can overwhelm your team, while too few might mean missing critical issues. The key is finding that sweet spot between thorough coverage and manageable alert volume.
Dynamic thresholds are an effective tool. Instead of using static limits like "80% CPU usage", dynamic thresholds adapt to historical trends, time of day, and other factors. This ensures you’re only alerted when something deviates significantly from normal patterns.
To avoid alert fatigue, prioritize notifications by their impact. Critical issues should demand immediate attention, while less urgent ones can wait. Composite metric monitors can also help by combining multiple alerts into a single notification. For example, instead of separate alerts for high CPU, memory, and disk usage, a composite monitor triggers only when multiple thresholds are breached, signaling a more serious issue.
Here are some cost-saving strategies to consider:
| Cost-Saving Measure | Implementation Strategy | Potential Savings |
|---|---|---|
| Log Management | Use Flex Logs for high-volume data ($0.05/million logs) | Savings depend on usage volume |
| Data Transfer | Switch to PrivateLink instead of NAT Gateways | Up to 80% savings on transfer costs |
| Container Monitoring | Pre-pay for containers ($1/container/month) | Cheaper than on-demand rates ($0.002/hour) |
These adjustments not only streamline alerting but also create a foundation for scaling your monitoring as your business evolves.
Adapting to Growth and Change
As your business grows, your monitoring needs will change, too. What worked for a 10-person startup may not be enough for a larger, more complex organization.
Make regular configuration reviews part of your routine. Quarterly assessments can help you determine if your monitoring setup still aligns with your business priorities. For example, you might identify systems that are no longer critical or notice new services lacking proper monitoring.
Growth often leads to more complex infrastructure. While basic server monitoring might suffice early on, larger businesses may require advanced tools like distributed tracing for microservices, synthetic monitoring for user journeys, and more sophisticated alerting rules.
Using template variables and tag-based grouping can simplify adjustments as your infrastructure evolves. These features allow you to create alerts that adapt dynamically without requiring constant manual updates.
Changes in team structure also come with growth. As your organization expands, update alert routing to ensure notifications reach the right teams. Specialized teams need tailored alerts to act quickly and effectively.
Finally, consider implementing predictive alerts. These proactive notifications help you address potential issues before they affect users, reducing downtime and improving system reliability. Shifting from reactive to proactive monitoring can significantly enhance customer satisfaction and operational efficiency.
Manual vs. Automated Scheduled Monitoring
The choice between manual and automated monitoring can significantly influence how efficiently SMBs operate. While manual monitoring allows for direct control, automated systems provide the scalability and dependability that expanding businesses often require.
Manual monitoring involves staff actively checking systems and responding to alerts. This approach can work well for smaller, less complex setups. However, as a business grows, manual monitoring can become a time sink. Employees may spend hours switching between tools to gather context and manually address issues, which can delay resolutions and extend disruptions.
Switching to automated monitoring can address these inefficiencies. Automated systems handle processes by executing tasks in response to alerts, events, and potential threats - without waiting for human intervention. This capability reduces Mean Time to Resolution (MTTR), freeing up your team to focus on strategic initiatives rather than constantly putting out fires.
Take Toyota Connected as an example. They set up a workflow triggered by a Datadog alert that previously required an on-call engineer to restart applications manually. Now, automation handles the restart through the ArgoCD API, eliminating the need for middle-of-the-night manual responses.
While automated systems may require a larger upfront investment, they often lead to long-term savings by reducing the need for manpower, minimizing errors, and preventing data loss. For instance, over 65% of Datadog-monitored containers use less than half of their allocated CPU and memory. Automated tools can identify such inefficiencies and make adjustments, something manual monitoring might miss.
Comparison Table: Manual vs. Automated Monitoring
| Factor | Manual Monitoring | Automated Monitoring |
|---|---|---|
| Initial Cost | Low ($15–$23/host/month base) | Higher ($31+/host/month with automation) |
| Long-term Cost | High (requires dedicated staff time) | Lower (reduces manpower needs) |
| Error Rate | High (prone to human error) | Low (high precision and reliability) |
| Response Time | Slower (requires human intervention) | Faster (immediate automated response) |
| Scalability | Limited (requires proportional staff increase) | High (scales without additional personnel) |
| Consistency | Variable (depends on individual performance) | Consistent (standardized processes) |
| After-hours Coverage | Expensive (requires on-call staff) | Cost-effective (automated responses) |
| Learning Curve | Minimal (uses existing skills) | Moderate (requires setup and training) |
| Best for | Small teams, simple infrastructure | Growing businesses, complex systems |
Transitioning to automation isn’t without its hurdles. About 70% of companies encounter challenges during the shift. However, businesses that adopt comprehensive observability tools often see a 30% reduction in downtime, making the move worthwhile for many SMBs.
As systems grow more complex, the case for automated monitoring becomes stronger. While manual monitoring might work for steady, straightforward setups, automation is increasingly essential for businesses managing intricate systems and aiming for sustained growth.
Conclusion: Using Scheduled Monitoring for SMB Growth
Scheduled monitoring with Datadog redefines how SMBs maintain system reliability and drive growth. Instead of scrambling to address problems after they arise, businesses can anticipate and resolve issues before they disrupt operations or affect customers.
The financial perks speak volumes: Finout achieved a 30% cost reduction, Resume Points trimmed their cloud expenses by 20%, and others have reported savings exceeding 40%. With Datadog's Enterprise plan priced at $23 per host per month, SMBs gain access to robust monitoring tools that adapt as their operations grow. The platform's high ratings underline its value, boasting 4.8/5 for ease of use and 4.8/5 for likelihood to recommend.
Scheduled monitoring not only ensures reliability but also provides the scalability SMBs need to thrive. However, its true potential is unlocked when monitoring aligns with business goals. As Adam Torkildson explains:
"Efficiently allocating time and resources can transform operations... a structured schedule enhances productivity and drives growth".
This alignment is even more vital when you consider that SMB SaaS companies face average monthly churn rates of 3% to 7%, while acquiring new customers can cost 5 to 25 times more than retaining existing ones.
By keeping systems reliable as businesses expand, scheduled monitoring becomes a cornerstone for growth. Whether managing a straightforward setup or a complex multi-cloud environment, Datadog's automated tools free your team to focus on strategic goals instead of constant troubleshooting. For SMBs with limited resources and lean teams, this efficiency isn't just helpful - it’s critical for staying competitive.
Switching from reactive to proactive monitoring is more than just a technical upgrade; it’s an investment in your business's future. Scheduled monitoring acts as the unseen framework that supports everything from customer satisfaction to operational efficiency, empowering SMBs to succeed in today’s challenging marketplace.
FAQs
How can scheduled monitoring in Datadog help SMBs save time and boost business growth compared to manual monitoring?
Scheduled monitoring in Datadog offers small and medium-sized businesses (SMBs) a way to gain automated, real-time insights, cutting down on the need for constant manual supervision. By catching and addressing issues early, SMBs can avoid downtime and keep their systems running efficiently without the hassle of continuous monitoring.
With features like integrated alerts, dashboards, and logs all in one platform, Datadog simplifies incident management and boosts operational efficiency. This streamlined approach lets SMBs dedicate more time to growing their business while managing infrastructure with less complexity and cost.
How can SMBs use Datadog's monitoring tools effectively while staying within their budget?
To get the most out of Datadog's monitoring tools without breaking the bank, small and medium-sized businesses (SMBs) can focus on streamlining their data usage. Start by filtering out logs that aren't essential and adjusting log retention periods to cut down on storage expenses. You can also schedule monitoring tasks during peak business hours to ensure resources are being used where they matter most.
Another smart way to save is by looking into committed use discounts or other pricing plans that fit your specific needs. These approaches let SMBs maintain strong monitoring capabilities while keeping costs in check, making it easier to maximize the value of Datadog's platform.
How can small and medium-sized businesses (SMBs) tailor Datadog's monitoring tools to meet their unique needs and growth goals?
SMBs can tailor Datadog's monitoring tools to fit their unique needs by using dynamic dashboard templates. These templates let businesses filter data based on key factors like specific services or infrastructure components. For instance, you can set up daily or weekly evaluation schedules for monitors, ensuring your monitoring aligns seamlessly with your business operations. Plus, scheduling downtimes during maintenance periods helps cut down on unnecessary alerts, keeping things running smoothly.
For those looking to take things a step further, Datadog’s App Builder offers even more flexibility. It enables SMBs to build internal tools that automate workflows and fine-tune monitoring to match their growth plans. With these tools, businesses can zero in on essential metrics, make the most of their resources, and scale efficiently as they expand.