Sending Logs and Custom Metrics from Netlify to Datadog
Forward Netlify traffic and function logs to Datadog, push custom build metrics, and build dashboards and alerts for long-term monitoring.
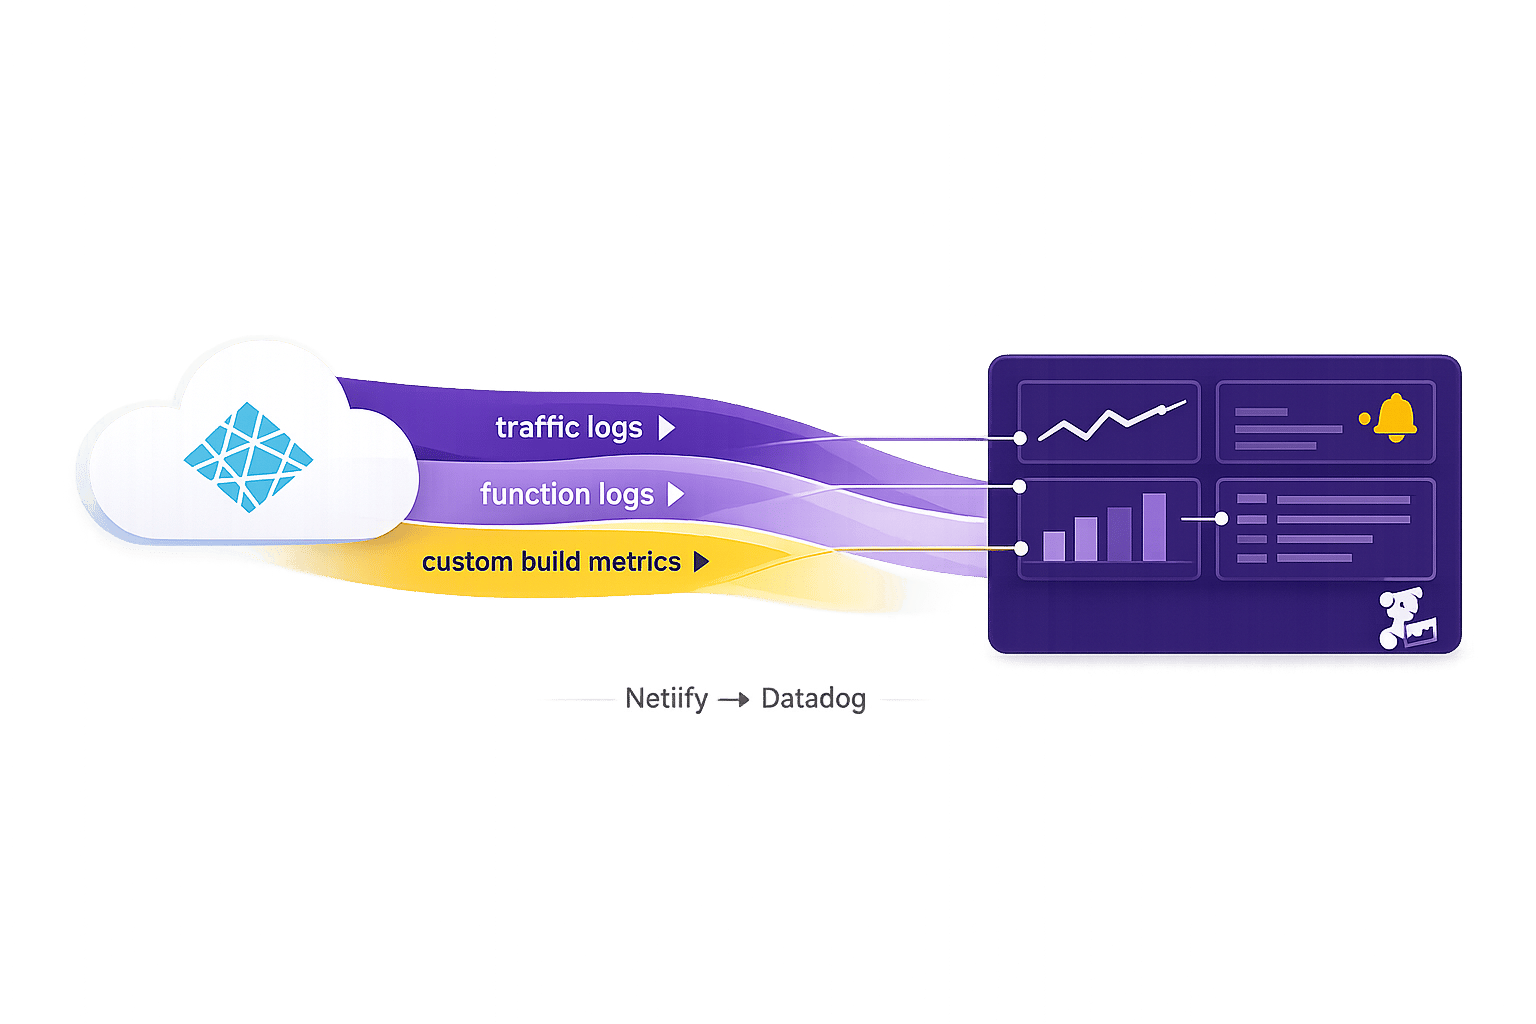
To monitor your website performance effectively, connecting Netlify with Datadog is a smart move. Netlify's built-in log retention is limited to 24 hours, which can hinder long-term analysis. By integrating with Datadog, you can:
- Extend log retention for deeper performance analysis.
- Set up alerts for issues like high error rates or slow serverless functions.
- Use custom metrics for tracking business-critical data like transaction values.
- Centralize logs and metrics for better troubleshooting and visibility.
This guide walks you through preparing your accounts, setting up log drains, sending custom metrics, and organizing your data in Datadog for actionable insights.
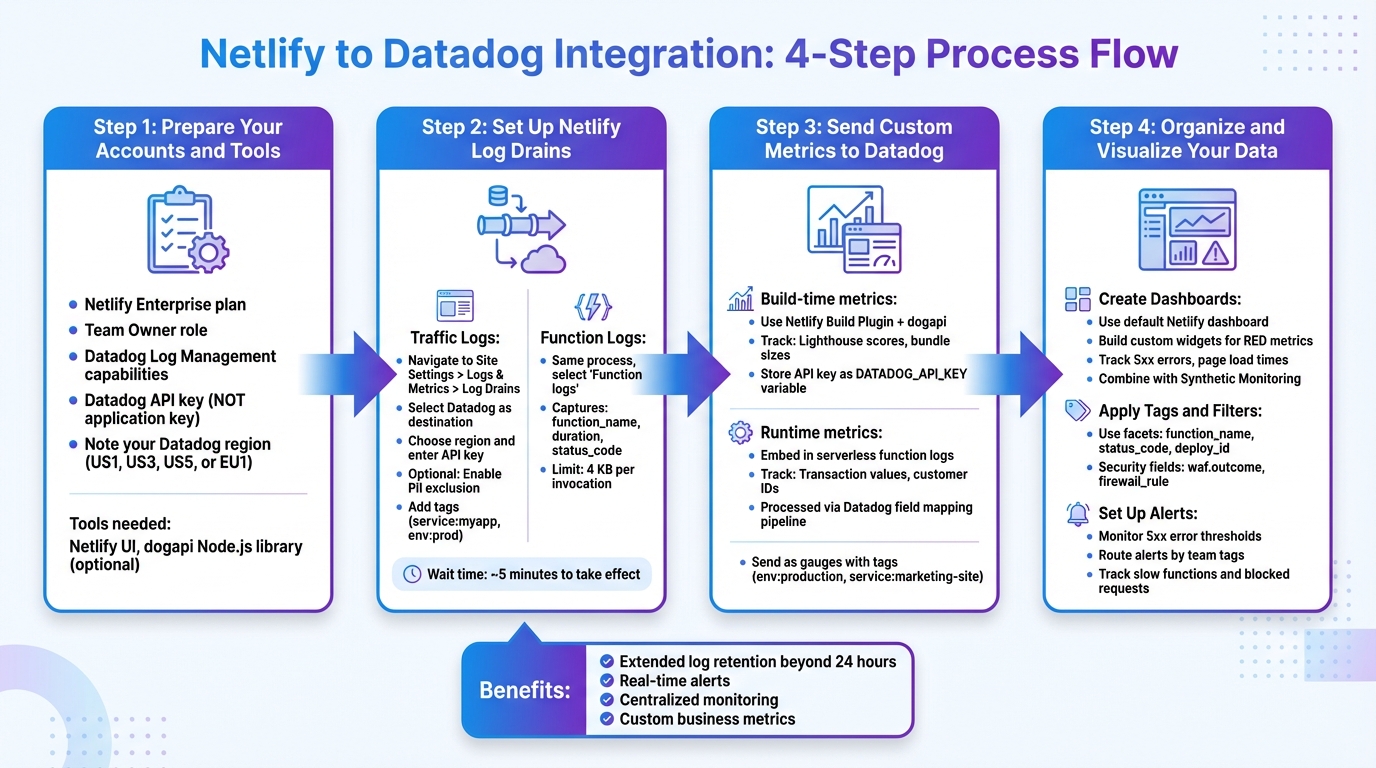
4-Step Process to Integrate Netlify Logs with Datadog Monitoring
Troubleshooting and Alerting with Netlify Log Drains
Step 1: Prepare Your Accounts and Tools
Before diving into the integration setup, make sure your Netlify and Datadog accounts meet all necessary conditions. This integration is only available for certain plans and requires specific permissions.
Account Requirements and Permissions
Netlify’s Log Drains feature is limited to customers on the Netlify Enterprise plan. If you're on a lower-tier plan, you'll need to reach out to Netlify sales to explore upgrade options. Over on Datadog, your account must include Log Management capabilities to handle log searching, analysis, and retention.
To configure a log drain in Netlify, you must hold the Team Owner role within your organization. Without this role, the required options won’t appear in your dashboard. As Netlify documentation explains:
"To set up a log drain, you must be a Netlify Team Owner and have an account and API key configured for an external monitoring provider."
For Datadog, ensure you have access to your organization’s API keys. Keep in mind that only API keys work for log ingestion - application keys will not suffice. Additionally, take note of your Datadog site region (e.g., US1, US3, US5, or EU1), as you’ll need this information during setup.
Once your accounts are ready, you’ll need the right tools to proceed.
Required Tools and Resources
Netlify’s Log Drains feature collects log records from your CDN and build system, then sends them to Datadog in near real-time using JSON or NDJSON formats. You can access this feature in the Netlify UI by navigating to Site Settings > Logs & Metrics > Log Drains.
If you want to send custom metrics - like Lighthouse audit scores - during builds, the dogapi Node.js library is a great tool. It integrates seamlessly with Netlify build plugins, allowing you to push performance data directly to Datadog.
When setting up, be sure to copy the correct API key from your Datadog settings. Using an application key instead will result in errors. After making changes, allow about five minutes for them to take effect.
For organizations that manage sensitive data, it’s worth enabling the "Exclude personally identifiable information (PII)" setting in Netlify. This automatically removes fields like client_ip and user_agent from traffic logs before they’re forwarded to Datadog.
Step 2: Set Up Netlify Log Drains
After setting up your account in Step 1, the next step is configuring Netlify log drains. This allows you to send traffic and function logs directly to Datadog, giving you comprehensive visibility into your site's activity.
Configure Traffic Log Drains
Traffic logs keep track of every visitor request to your site. This includes details like status codes, URLs, request sizes, and security events flagged by Netlify's Web Application Firewall. To get started, navigate to Site Settings > Logs & Metrics > Log Drains in your Netlify dashboard, then click Enable a log drain.
Choose Datadog as the destination service and select your region (US1, US3, US5, or EU1). Under log types, pick Traffic logs. When prompted, enter a valid Datadog API key in the credentials field. Make sure to use an API key - not an application key - since the latter will prevent the connection from working.
If your logs include sensitive information, you can enable the "Exclude personally identifiable information (PII)" option. This feature automatically removes fields like client_ip and user_agent before logs are sent to Datadog. Additionally, you can assign tags, such as service:myapp or env:prod, to make filtering and querying your logs easier later on.
Once everything is set, click Connect. Within five minutes, your traffic logs should start appearing in Datadog.
Now that traffic logs are configured, you can move on to setting up function log drains.
Configure Function Log Drains
Function logs provide insights into serverless function performance, including invocation details, execution times, and error messages. The setup process is nearly identical to configuring traffic logs - just select Function logs as the log type instead. Use the same Datadog API key you used for traffic logs.
These logs capture fields like function_name, duration, level (INFO, ERROR, WARN), message, and status_code. However, keep in mind that Netlify limits function log output to 4 KB per invocation. If a function generates more than this, only the last 4 KB of data will be sent. Additionally, Background Functions are not currently supported by Log Drains.
To confirm that your logs are flowing correctly, head over to Datadog's Log Explorer and apply filters based on the tags you’ve configured. As Netlify CEO Matt Biilmann explained during the integration's launch:
"Now Datadog and Netlify customers can connect their web traffic and serverless functions logs to Datadog Log Management, helping development teams see all their logs in one place and overall be more efficient at diagnosing risks."
Step 3: Send Custom Metrics to Datadog
With log drains in place, it's time to send custom metrics to Datadog. These metrics are essential for monitoring key performance indicators and real-time business events. While logs provide historical data, custom metrics deliver live insights into performance, giving you a clearer picture of your operations.
Define Custom Metrics in Netlify
Custom metrics can be captured during builds or runtime, depending on what you need to measure.
For build-time metrics - like Lighthouse performance scores or bundle sizes - you can use a Netlify Build Plugin alongside the Datadog API. Create a custom plugin that leverages the onSuccess hook to send metrics only after successful builds. To do this securely, initialize the dogapi library with your Datadog API key, which should be stored as a Netlify environment variable named DATADOG_API_KEY.
For runtime metrics generated by serverless functions, you can embed business logic into the function logs. For example, if you're tracking e-commerce transactions, you might log details like transaction values and customer IDs in the log_message field. These logs, sent to Datadog through Log Drains (available on Enterprise plans), can be processed via Datadog's field mapping pipeline to extract attributes and convert them into searchable metrics. This approach allows you to troubleshoot and optimize performance using real operational data.
| Metric Source | Method | Use Case Example |
|---|---|---|
| Netlify Build | Datadog API / Build Plugin | Lighthouse performance scores, bundle size |
| Edge Network | Log Drains (Traffic Logs) | Request volume, 4xx/5xx error rates, latency |
| Serverless Functions | Log Drains (Function Logs) | Execution duration, custom business events |
Once you've defined the metrics you want to track, you're ready to send them to Datadog.
Send Custom Metrics to Datadog
For build-time metrics, send them as gauges. Include the metric name, value, and tags like env:production, service:marketing-site, or version:2.4.0 to make them easy to filter in Datadog dashboards. For example, you might send a Lighthouse score of 92 as a gauge.
When using the Datadog API, initialize your API client at startup to ensure smooth operation. Use your Datadog API key to authenticate requests.
For runtime metrics from Log Drains, Datadog automatically processes JSON logs to extract key fields like duration, status_code, and function_name. As Netlify explains:
"Process Netlify logs through Datadog's field mapping pipeline to extract meaningful information and common attributes that can be reused as facets to better organize and search your logs."
To confirm everything is set up correctly, check Datadog's Metrics Summary or Log Explorer. Use the tags you configured to filter results, and your custom metrics should appear within about five minutes.
Step 4: Organize and Visualize Your Data
Now that your logs and custom metrics are streaming into Datadog, it’s time to make sense of all that data. By organizing and visualizing it effectively, you can uncover actionable insights. Datadog offers tools like default and custom dashboards to help you analyze your data. For example, the platform provides a ready-made Netlify dashboard that automatically displays essential telemetry as soon as your logs start streaming. This means you can get a clear view of your Netlify environment right away, without having to set anything up manually.
Create Dashboards
Custom dashboards are a powerful way to view your Netlify data alongside metrics from other parts of your tech stack. This is especially helpful for SMBs juggling multiple services. Imagine correlating Netlify site performance with database queries, API response times, or other critical metrics - all in one place. This unified view can help your team quickly pinpoint issues that might be affecting user experience or revenue.
Start by creating log-based metrics from your traffic and function logs. For instance, you can use attributes like status_code and duration to monitor RED (Requests, Errors, and Duration) patterns for both web traffic and serverless functions. Want to dig deeper? Build widgets to track things like 5xx error rates for key serverless functions or create graphs that show average page load times by country. To get an even fuller picture, combine your log data with Datadog Synthetic Monitoring browser tests. This integration allows you to see how backend performance aligns with frontend Core Web Vitals, offering a more complete perspective.
Apply Tags and Filters
Tags and filters are essential for keeping your data organized and easy to navigate. Use the tags you’ve already set up - like env:production, service:marketing-site, or team:frontend - to quickly locate specific logs in Datadog’s Log Explorer.
Datadog’s field mapping pipeline simplifies this process by automatically extracting common attributes from Netlify logs and turning them into searchable facets. For example, you can use facets like function_name to focus on specific serverless functions, status_code to filter for error responses, or deploy_id to track deployment-related issues. If you’re monitoring security, fields like waf.outcome and firewall_rule can help you identify blocked requests and potential threats.
Set Up Alerts
Visualization is a great start, but alerts ensure you stay ahead of problems before they affect users. Set up monitors based on the metrics you’ve created from your logs. For instance, you could configure an alert for when 5xx errors on critical functions exceed a certain threshold over five minutes.
Thomas Sobolik from Datadog highlights the importance of this step:
"Creating alerts for these metrics and visualizing them in your dashboards helps you validate the health and performance of your site in real time and stay ahead of user-facing problems."
You can also use monitor notification rules to route alerts based on tags. For example, if a monitor is tagged with team:frontend and env:prod, you can set it to send critical production alerts directly to the right Slack channel. Start small - say, by focusing on env:prod AND priority:P0 - and gradually expand your scope to avoid overwhelming your team with too many alerts. Don’t forget to set monitors on fields like waf.outcome and duration to catch blocked requests and identify slow functions. Keep in mind that most configuration changes take about five minutes to go live.
Conclusion
Bring Netlify logs and custom metrics into Datadog to achieve a more comprehensive and lasting monitoring solution that surpasses Netlify's built-in console. With Datadog, you can store data for extended periods, making it easier to compare performance trends over months. Plus, you can build business intelligence dashboards with custom metrics, like transaction values or customer IDs, for deeper insights into your operations. This integration consolidates traffic logs, serverless function details, deployment data, and WAF security insights, all while enabling real-time alerts to catch 4xx/5xx error spikes before they affect your users.
Datadog also offers powerful filtering options, allowing you to narrow down logs by attributes like function_name or status_code to quickly identify slow or failing functions.
Experts in the field highlight the importance of these capabilities. Matt Rinehart, Staff Product Manager at Netlify, explains:
"As the adoption of Jamstack architecture goes mainstream in enterprises worldwide, there's a growing need to centralize application management using the tools that are already in place."
For small and medium-sized businesses, these tools offer practical benefits. They simplify troubleshooting, provide proactive DDoS protection, and allow you to connect deployment logs to performance issues, so you can identify how specific builds may be impacting your site.
Start by focusing on critical production environments and gradually expand your monitoring as your needs grow. Use tags like env:prod or service:marketing-site to keep your data well-structured, and enable PII filtering to ensure sensitive information stays protected.
FAQs
Can I send Netlify logs to Datadog without an Enterprise plan?
Netlify's integration with Datadog for sending logs is exclusively available to users on an Enterprise plan. This is because the Log Drains feature, which facilitates this functionality, is restricted to these higher-tier plans.
Which Datadog key do I need for Netlify log drains?
The api_key is the essential credential for Netlify log drains. It serves as the authentication mechanism, allowing logs and metrics to flow from Netlify to Datadog via the log drain setup. Ensure you use the proper api_key to maintain a smooth connection between the two platforms.
How do I turn Netlify logs into Datadog metrics and alerts?
To send Netlify logs to Datadog and turn them into actionable metrics, you'll need to use Netlify's Log Drains. These allow logs to be forwarded to Datadog in near real-time. Once the logs are in Datadog, you can define custom metrics based on the ingested data. From there, set up monitors to track specific thresholds or spot anomalies, triggering alerts when necessary. This setup streamlines log management, enables performance monitoring, and helps you tackle potential issues before they escalate.