Server Health Metrics with Datadog
Learn how to effectively monitor server health with key metrics, ensuring your business remains operational and secure with Datadog.
Server health impacts your business directly. Downtime can cost small businesses up to $100,000 per hour, and 43% of cyberattacks in 2023 targeted small businesses. Monitoring key metrics like CPU usage, memory, disk space, and network traffic helps prevent costly disruptions.
Datadog simplifies server monitoring by collecting metrics every 15 seconds and providing real-time insights through a unified dashboard. Here's how to get started:
- Set up a Datadog account: Create an account, get an API key, and secure your setup.
- Install the Datadog Agent: Collect metrics from servers, containers, and cloud platforms.
- Secure your network: Use TLS encryption, firewalls, and multi-factor authentication.
- Monitor key metrics: Track CPU, memory, disk I/O, network throughput, and custom metrics.
- Create dashboards and alerts: Visualize data and get notified of issues before they escalate.
Datadog Tutorials: Session 4 - datadog infra linux windows process monitoring
Getting Started with Datadog for Server Monitoring
To ensure your servers are running smoothly and issues are addressed before they escalate, setting up Datadog is a smart move. Here’s how to get started: you’ll need to create an account, install the monitoring agent, and configure your network security. Each step lays the groundwork for a reliable monitoring system that keeps your business running efficiently.
Setting Up a Datadog Account
Your Datadog account is the hub for monitoring server performance. Datadog consolidates data from servers, databases, tools, and services into one platform, offering actionable insights into your system's health and performance. Think of it as your command center for staying on top of server activity.
To get started, head over to Datadog’s website and sign up. You’ll need to provide some basic details, like your company name, email address, and how you plan to use the platform. Once your account is set up, you’ll receive an API key - this is essential for connecting your servers to the Datadog dashboard. It’s also a good idea to set up multiple email contacts for receiving security alerts.
Datadog prioritizes security, enforcing strong password policies and monitoring for key exposure. These measures help ensure your data stays protected.
Installing the Datadog Agent
Once your account is ready, the next step is installing the Datadog Agent. The Agent is the backbone of Datadog’s monitoring system, collecting data from your servers and sending it to your dashboard for analysis. This software gathers metrics, logs, and traces, giving you a clear picture of your system’s performance.
The Agent is compatible with a wide range of environments, including Windows, macOS, Docker, Kubernetes, and on-premises servers. Installation steps vary depending on your operating system, but once configured, the Agent starts transmitting live data to your Datadog platform.
For businesses managing multiple servers, tools like Chef, Puppet, or Ansible can simplify the installation and configuration process. These tools allow you to deploy the Agent across multiple hosts efficiently.
Network and Security Configuration
With the Agent up and running, the final step is securing the connection between your servers and Datadog. Datadog uses Transport Layer Security (TLS) and HTTP Strict Transport Security (HSTS) to protect all transmitted data. If encryption fails, access to the application is blocked to maintain security.
Your firewall setup is equally critical. Configure it to block traffic from suspicious sources, prevent outbound communication to known malicious addresses, and immediately cut off traffic from hosts performing port scans. Additionally, Datadog’s in-app Web Application Firewall (WAF) can help block unauthorized IP addresses.
Datadog’s infrastructure employs multiple layers of security. It uses a Virtual Private Cloud (VPC) to isolate internal networks and restricts access through security groups with strict inbound and outbound rules. Access is granted based on roles and follows the principle of least privilege, with multi-factor authentication required for administrative access.
To ensure compliance and transparency, Datadog logs and audits all access to production environments. These audit trails help you meet industry standards while keeping your monitoring data secure.
With your account created, Agent installed, and network secured, you’re ready to dive into monitoring your server health and performance metrics effectively.
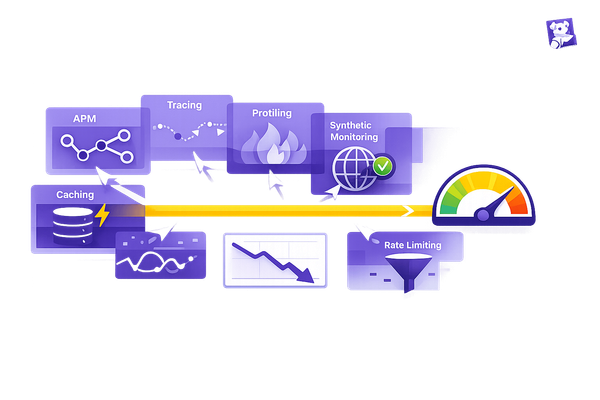
Key Server Health Metrics to Monitor
Now that your Datadog setup is up and running, it’s time to dive into the metrics that matter most for your business. Keeping an eye on server performance in real time is essential to ensure your applications run smoothly. The right metrics not only help you maintain performance but also allow you to catch issues before they impact customers. Below, we’ll explore five core metrics that provide a clear picture of your server’s health and performance.
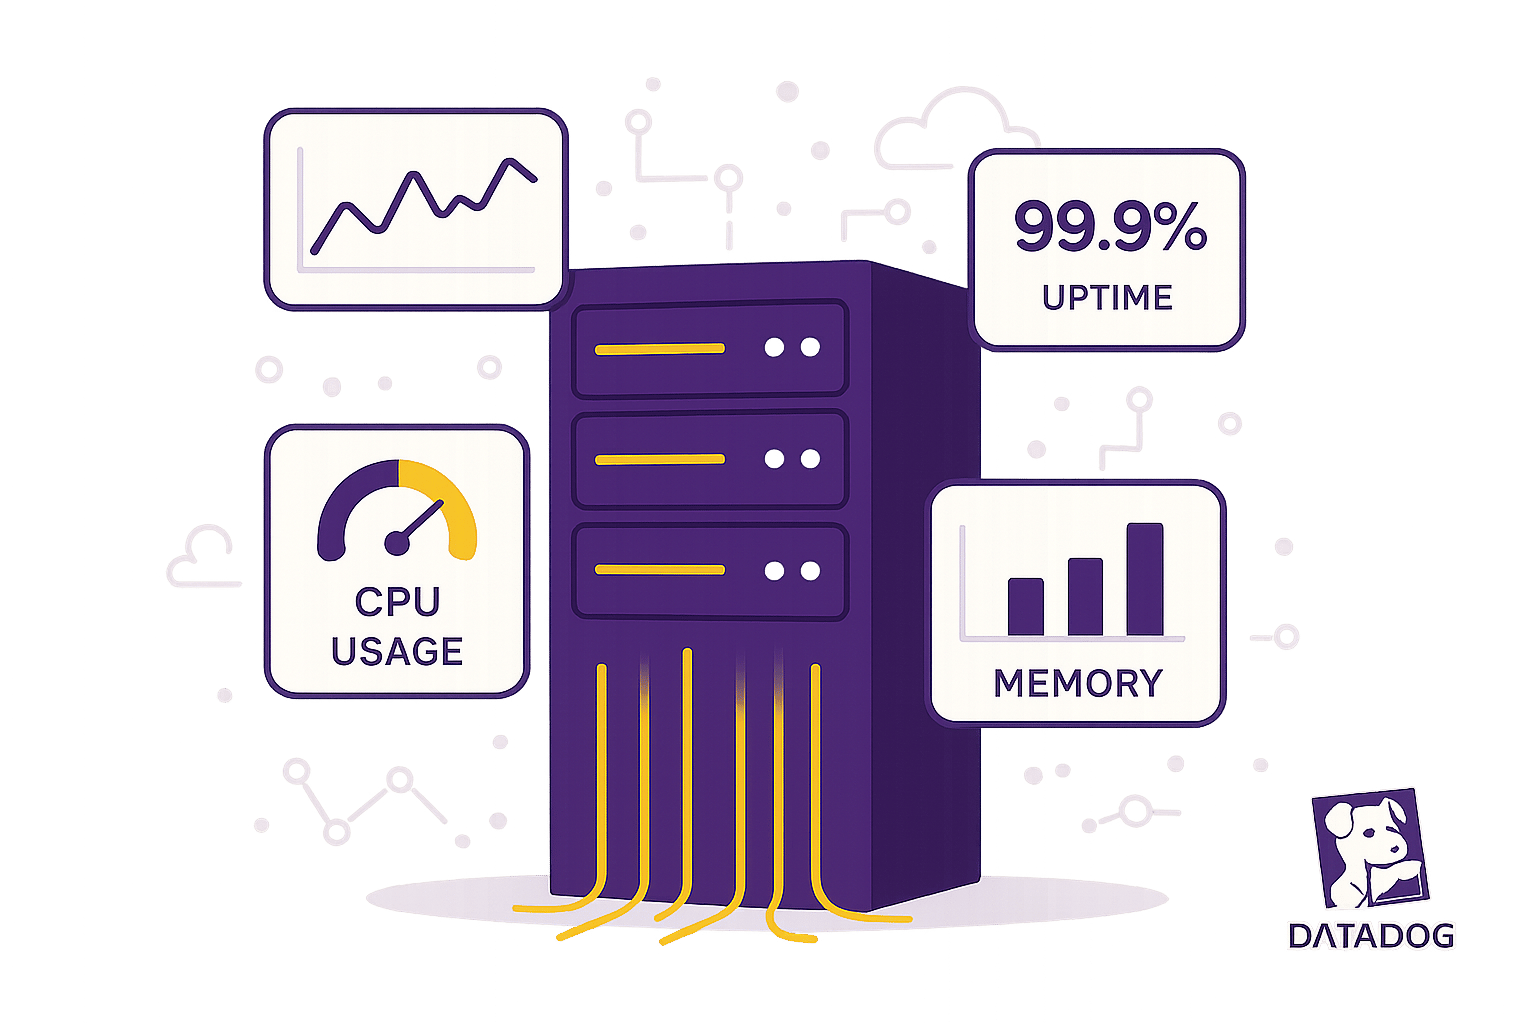
CPU Usage
CPU usage reflects how much of your processor’s capacity is being utilized at any given moment. This metric helps you determine whether your servers have the computing power to handle current workloads.
With Datadog, you can monitor CPU usage in real time. Whether you need insights into individual cores or an overall system view, the platform provides the flexibility to meet your needs. Setting thresholds for CPU utilization allows you to identify potential problems early and investigate before they escalate.
Tracking CPU usage trends over time also helps you balance workloads more effectively. Once CPU usage is under control, it’s time to take a closer look at memory utilization.
Memory Utilization
Memory utilization measures how much of your server’s RAM is being used. If your servers run low on physical RAM, they’ll start relying on swap space, which can significantly slow down performance. That’s why monitoring both RAM usage and swap activity is crucial.
Datadog categorizes memory utilization as a resource metric, offering detailed insights into how much memory each server is consuming. By keeping an eye on memory usage and identifying patterns, you can detect leaks, respond to sudden spikes, and allocate resources more effectively.
With memory usage optimized, the next step is to evaluate storage performance.
Disk I/O and Storage Space
Disk I/O tracks the speed at which data is read from and written to your storage devices, while storage space monitoring ensures you don’t run out of room. Both are critical: slow disk I/O can create bottlenecks, and running out of storage can lead to application crashes.
Datadog provides granular insights into disk I/O as a throughput metric and storage space as a resource metric. For example, its AWS integration gathers detailed metrics from services like EBS, while the Datadog Agent collects system-level disk metrics at 15-second intervals. This level of detail helps you quickly identify and address performance issues.
You can use Datadog's Metrics Explorer to manually track disk performance or automate the process with JSON templates. Once your storage is performing as expected, focus shifts to monitoring network throughput.
Network Throughput
Network throughput measures the volume of data flowing in and out of your servers. This metric is vital for detecting potential bottlenecks or unusual traffic patterns, especially for web applications, APIs, and services handling significant data transfers.
Datadog’s Network Monitoring provides unified visibility across multi-cloud, hybrid, and on-premises environments. It enables you to correlate data across applications, networks, and devices, offering intelligent insights and real-time alerts. You can create monitors and dashboards using advanced tags to track and respond to abnormal network activity.
For example, Miguel Mingorance, Systems Engineer at Delivery Hero, shared:
"Datadog CNM gave us immediate visibility into all our Kubernetes cluster traffic. As soon as a new cluster is spun up, we can see if pods communicate as expected and if internal DNS is doing its job."
Similarly, Robert Faria De Oliveira, Infrastructure Operations Manager at Wayfair, highlighted:
"With Datadog NDM we now have detailed information from thousands of devices across our large-scale network inside the Datadog platform, helping our NOC teams isolate and respond to issues faster than ever."
While these core metrics ensure system health, custom metrics can align technical performance with your specific business goals.
Custom Metrics
Custom metrics allow you to track data that standard server metrics don’t cover. While metrics like CPU, memory, disk, and network performance focus on system health, custom metrics provide insights into how your applications are performing from a business perspective.
These metrics are especially useful for monitoring business-specific KPIs:
| Metric Category | Example Metrics | Business Impact |
|---|---|---|
| Customer Experience | Cart completion time, Support response time | Directly affects conversion rates |
| Revenue Operations | Payment success rate, Average order value | Tracks financial performance |
| System Health | API latency, Error rates by endpoint | Ensures service reliability |
The key is to focus on metrics that matter most to your business. Brent Montague, Principal SRE at Cvent, shared his experience:
"We really like how Datadog's CNM product is tied into the rest of the platform. Being able to monitor network traffic all the way down to our containers with Datadog has helped us identify improvements and optimizations across our platform."
When setting up custom metrics, use meaningful tags to organize your data. Tags like env:production can differentiate environments, while department:sales or region:northeast provide team-specific or location-based insights. This approach ensures your metrics are actionable and aligned with your business needs.
Configuring Datadog Dashboards for Server Health
Once you’ve pinpointed the metrics you want to monitor, the next step is setting up dashboards that make the data easy to interpret. Datadog dashboards are designed to present information in a clear, concise format, making it simple to identify trends and take action when needed.
Creating a Dashboard
Datadog provides two main dashboard types for keeping an eye on server health: Screenboards and Timeboards. Screenboards are great for creating narrative overviews, while Timeboards are better suited for real-time troubleshooting.
To get started, head to your Datadog Dashboards and click on "New Dashboard." From there, pick the dashboard type that best fits your needs. For example, use a Screenboard to display a high-level summary or a Timeboard to dive into live metrics. You can also use the Notes and Links widgets to create headers and organize the dashboard into sections, such as CPU performance, memory usage, and storage health.
Once your layout is in place, it’s time to add widgets to bring your data to life.
Adding and Configuring Widgets
Widgets are what turn raw server data into visuals that are easy to understand. Datadog offers a variety of widgets to suit different needs:
- Timeseries: Tracks metric trends over time.
- Line Graphs: Displays a single metric across multiple scopes.
- Stacked Graphs: Illustrates the total and contributions of various metrics.
- Bar Graphs: Useful for counts or sparse data.
- Heat Maps: Shows a metric across multiple groups.
- Markers: Highlights ideal ranges or thresholds.
- Distributions: Focuses on changes within a specific time frame.
- Top Lists: Ranks hosts or clusters by specific metrics.
- Query Values: Provides quick, at-a-glance critical data.
By carefully selecting and configuring widgets, you can transform complex data into actionable insights.
Using Tags for Filtering and Grouping
Tags are the secret to making your dashboards dynamic and adaptable. These key:value pairs (or simple values) allow you to filter and group server metrics for better clarity. Datadog automatically imports tags from platforms like AWS, Kubernetes, and Chef, but you can also create custom tags in configuration files such as datadog.yaml.
Tags unify data across metrics, traces, and logs, making it easier to correlate information, analyze trends, and set up alerts. For example:
- Use a global "env" tag to separate development, staging, and production environments.
- Tag by data center to manage servers across regions.
- Categorize application data by service name or primary role.
Adding business-specific tags can also help you make smarter decisions about scaling and resource allocation.
Setting Up Alerts and Notifications
Once your dashboards are set to display server metrics, the next step is configuring alerts to catch potential issues early. With Datadog's unified platform, setting up alerts is a seamless process that integrates directly with your existing dashboards.
Defining Alert Conditions
Datadog uses monitors to manage alerts. These monitors track changes across your infrastructure, applications, or services based on the conditions you set. Here’s a breakdown of the main types of monitors:
- Metric monitors: Keep an eye on specific metric values and compare them against thresholds you define. For instance, you might set an alert for when disk usage (tracked by the
system.disk.in_usemetric) exceeds 85%. This gives you time to either free up space or allocate additional storage. - Event monitors: Focus on specific system or application events, like restarts, crashes, or critical log entries.
- Log monitors: Trigger alerts based on patterns or specific content in your logs, helping you identify error trends or potential security threats.
- Composite metric monitors: Combine multiple conditions into a single alert. Notifications are sent only when all defined criteria are met.
- Dynamic alerts: Use template variables and tags to adjust alert parameters dynamically, based on real-time data.
For example, you could set an alert to notify you if a Kubernetes pod's CPU usage exceeds 80% for over 10 minutes or if a Java application's response time surpasses a certain threshold.
Once you’ve defined your alert conditions, it’s time to choose the right notification channels to ensure timely responses.
Choosing Notification Channels
Alerts are only effective if they reach the right people at the right time. Datadog supports integrations with various communication tools, including email, Slack, Microsoft Teams, PagerDuty, webhooks, Opsgenie, VictorOps, and mobile push notifications.
To set up notifications, go to your monitor settings, choose your preferred method, and provide the necessary details, such as email addresses, API keys, or webhook URLs.
| Integration Type | Purpose | Benefits |
|---|---|---|
| Slack/MS Teams | Real-time updates | Alerts sent to team channels for immediate visibility |
| JIRA | Issue tracking | Automatically create and update tickets for incidents |
| Webhooks | Custom workflows | Trigger specific actions or enhance existing processes |
| PagerDuty | On-call management | Automate escalations and manage on-call schedules effectively |
For non-critical alerts that need documentation, email is a good option. For real-time updates, Slack or Microsoft Teams can notify team channels instantly. Critical issues requiring immediate attention are best handled with PagerDuty, which automates escalations and manages on-call rotations. Webhooks are also a powerful option for triggering custom workflows or integrating with external systems.
When setting up notifications, make sure to include essential details like the affected host, service, or metric. Test your notifications to confirm they’re working as expected, and set up escalation policies to ensure alerts are routed to secondary contacts if the primary responders are unavailable.
By clearly defining alert conditions and selecting the right notification channels, you can ensure that your team stays informed without being overwhelmed.
Best Practices for Alert Management
Managing alerts effectively is key to avoiding "alert fatigue", where frequent notifications cause teams to become desensitized. Research suggests that up to 80% of alerts may be unnecessary, and some organizations see a 30% rise in alert-related incidents due to this issue.
To minimize noise, regularly review and update your monitoring strategy. Remove redundant or overly sensitive alerts, and consider increasing the evaluation window to avoid reacting to temporary fluctuations. Adding recovery thresholds can also confirm that issues have been resolved before alerts are dismissed.
Using historical data to set smarter thresholds can significantly reduce false positives - by as much as 70% in some cases. You can also enhance clarity by tagging alerts and routing them to the appropriate teams using conditional variables. Grouping notifications and consolidating alerts through composite monitors can further reduce the volume, while scheduling downtimes during planned maintenance prevents unnecessary alerts during expected changes.
Routine maintenance is essential. Datadog’s Monitor Notifications Overview dashboard can help you track alert trends and pinpoint the noisiest ones. Adjust thresholds periodically to align with your system’s current state and business priorities. Automating dynamic monitors with scripts or configuration management tools ensures consistency across your infrastructure.
Best Practices for Server Health Monitoring in SMBs
Small and medium-sized businesses (SMBs) often operate with fewer resources than large enterprises, making efficient server monitoring a necessity. Datadog’s unified monitoring approach is particularly well-suited for SMBs. With 77% of organizations incorporating DevOps practices to enhance software deployment, having effective monitoring systems in place is now more important than ever.
Regularly Reviewing Dashboards
Datadog dashboards are a cornerstone of effective monitoring, but they need consistent upkeep to remain useful. Over time, dashboards can become cluttered with outdated metrics that no longer align with your business goals.
To keep things on track, conduct quarterly audits of your dashboards. Ask questions like: Is this metric still relevant to our objectives? Are we using this data to make decisions? Remove widgets tied to obsolete services or unnecessary metrics. This process ensures your dashboards remain focused and meaningful.
Group actionable metrics together, using consistent color schemes to avoid visual clutter. A dashboard packed with widgets may look impressive, but only a handful of those metrics might actually drive decision-making. For example, when Datadog’s own infrastructure team reviewed their dashboards, they discovered that grouping hosts by machine image revealed one overloaded image among two in use. This insight came from prioritizing actionable data over excessive information.
Define clear KPIs that align with your business objectives. For instance, an e-commerce SMB might focus on response times and error rates during peak shopping hours, while a SaaS company might prioritize API response times and database performance metrics that directly impact user experience. These dashboard reviews not only streamline your current monitoring but also prepare your business for future growth.
Scaling with Datadog
As your SMB expands, so will your monitoring requirements. Datadog’s platform is designed to grow with you, supporting everything from small setups with a few servers to complex environments with microservices architectures.
Start by monitoring your most critical applications and infrastructure components before scaling to other areas. For example, if you’re running a web app, begin with web servers, databases, and load balancers. Once these elements are stable, extend monitoring to background job processors or caching layers.
Datadog’s pricing model is flexible, making it easier to scale without breaking the bank. Infrastructure Pro costs $15 per host/month (billed annually), while Infrastructure Enterprise is priced at $23 per host/month. Custom metrics start at $1 per 100, allowing you to tailor your monitoring strategy as your business grows. Regularly reviewing metrics not only keeps your dashboards clean but also helps you make cost-efficient scaling decisions.
With integrations for over 600 technologies, Datadog can adapt to changes in your infrastructure. Whether you’re transitioning from a monolithic setup to microservices or adopting new cloud services, Datadog evolves with your needs - no major overhauls required.
To dive deeper into scaling strategies, check out Scaling with Datadog for SMBs for practical advice tailored to smaller businesses.
Another key to scaling effectively is automating alerts. Avoid alert fatigue by setting up targeted notifications for issues that demand immediate attention. Make sure these alerts have clear escalation paths. As your system grows, tools like Host and Container Maps can provide quick, visual insights into infrastructure performance.
Using Host and Container Maps
Datadog’s Host and Container Maps offer a visual way to monitor your infrastructure’s health. These tools consolidate server or container status into a single view, making it easier to spot patterns and outliers that might be missed on traditional dashboards.
For SMBs, where every dollar counts, Host Maps can help identify underutilized machines by tracking CPU and memory usage. Group hosts by instance type, role, or name to pinpoint costly instances or underutilized roles that could be scaled down.
When troubleshooting performance issues, group servers by dimensions like availability zone, region, instance type, or machine image. This approach can quickly reveal whether problems are tied to specific hardware, regions, or configurations.
You can also filter hosts by availability zone to assess whether resources need rebalancing. This ensures workloads are evenly distributed, optimizing costs and performance.
Host Maps are especially valuable for identifying outliers and unusual usage patterns. Their visual design makes it easy to spot servers under heavy load or consuming resources abnormally, enabling proactive management before issues escalate. By relying on these tools, SMBs can maintain efficient, cost-effective infrastructure monitoring.
Conclusion
To set up server health monitoring with Datadog, start by creating an account, installing the agent, identifying key metrics, crafting focused dashboards, and configuring targeted alerts. These steps help establish a reliable monitoring system that keeps your infrastructure performing at its best.
For small and medium-sized businesses (SMBs), maintaining continuous server health monitoring is crucial. With 77% of organizations leveraging DevOps to improve deployments, proactive monitoring not only minimizes disruptions but also supports smoother operations.
Datadog's unified platform simplifies server monitoring for smaller teams by collecting metrics from hosts and containers at 15-second intervals. This ensures real-time visibility without straining your resources. As Alex Kanevsky, Lead Architect at Generali Global Assistance, shared:
"With Datadog CNM, we can quickly determine if our network is at fault for slow traffic or low connectivity before our applications are affected, so that insuring travel is a seamless experience for our customers."
This level of real-time insight lays the groundwork for ongoing improvements. Long-term success hinges on consistent optimization. Keep your focus on critical applications, define clear KPIs, and regularly review dashboards. Automating alerts allows you to address genuine issues without being overwhelmed by unnecessary notifications. With these practices in place, scaling your infrastructure becomes a smoother process.
Datadog’s flexible design and extensive integrations are tailored to SMBs, accommodating everything from a handful of servers to rapid growth. Whether you're managing a small setup or preparing for expansion, Datadog evolves with your needs, eliminating the need for major adjustments to your existing infrastructure.
FAQs
How does Datadog keep my server data secure during monitoring?
Datadog takes strong precautions to safeguard your server data. Every piece of data exchanged between Datadog and its users is encrypted using Transport Layer Security (TLS), which ensures that all transmissions remain secure. On top of that, role-based access control (RBAC) lets you decide who gets access to specific data, minimizing the chance of unauthorized access.
To further enhance security, Datadog performs ongoing configuration audits and real-time threat detection. These measures help pinpoint and address vulnerabilities across your infrastructure, keeping your server data protected while you monitor and fine-tune your systems.
What should I do if I notice a sudden increase in CPU usage on my server with Datadog?
If you notice an unexpected jump in CPU usage on your server while using Datadog, the first step is to confirm the spike using the Metrics Explorer. This tool can help you identify which processes or services are consuming the most resources. For a closer look, use Datadog's live process monitoring to observe real-time resource usage and pinpoint any processes that might be overloading the CPU.
After identifying the potential culprits, take a moment to review your integrations. Check if any of them are generating an unusually high volume of metrics or performing too many checks. If that's the case, you can adjust the min_collection_interval in your configuration to reduce how frequently data is collected. Additionally, ensure that antivirus software isn’t interfering with the Datadog Agent, as this can sometimes lead to unexpected CPU spikes.
To stay ahead of the curve, set up alerts that notify you when CPU usage crosses a specific threshold for a set period. If the issue continues despite these efforts, don’t hesitate to contact Datadog Support for further assistance. They can provide more tailored guidance to help resolve the problem.
How can I tailor Datadog dashboards to focus on the metrics that matter most to my business?
To tailor Datadog dashboards to fit your business needs, start by pinpointing the key metrics that directly support your objectives. These might include areas like system performance, user activity, or transaction volumes. Incorporate custom metrics to monitor these KPIs effectively, and ensure they’re displayed prominently on your dashboards.
Make your data more meaningful by using features like unit overrides. Instead of showing raw numbers, provide context with specific units - for instance, "5,000 transactions" or "2.5 GB." This approach makes metrics easier to understand at a glance.
Keep your dashboards relevant by regularly reviewing and updating them. Remove widgets that no longer serve a purpose and prioritize elements that reflect your current goals. This practice ensures your dashboards stay clear, actionable, and aligned with your business’s changing priorities.