Setting Up Automated Log Analysis in Datadog
Learn how to automate log analysis with tools that enhance monitoring, identify issues, and optimize costs for better system performance.
Managing logs manually can be overwhelming, especially as your systems grow. Automated log analysis with Datadog simplifies this process, helping you monitor performance, detect issues, and stay secure - all while keeping costs under control. Here's a quick overview of what you'll learn:
- Enable Log Collection: Install Datadog Agent, activate log collection, and configure custom log sources.
- Set Up Pipelines: Organize raw logs into structured, searchable data with tools like Grok parsers and attribute remappers.
- Automate Anomaly Detection: Use Datadog's AI-driven Watchdog to spot unusual patterns and set up proactive alerts.
- Build Dashboards: Create dynamic, interactive dashboards to visualize trends and correlate logs with metrics and traces.
- Optimize Storage Costs: Use Flex Logs for affordable long-term storage and selective indexing to prioritize high-value logs.
Why it matters: With Datadog, SMBs can simplify log management, improve security, and reduce costs. For example, Datadog offers log ingestion at $0.10/GB and retention options starting at $1.06/GB. Plus, features like AI anomaly detection and flexible storage ensure you get the most out of your log data.
Want to get started? Follow these steps to scale your logging practices efficiently.
Datadog Log Collection and Integrations | Linux
Step 1: Enable Log Collection in Datadog
To start analyzing logs in Datadog, you’ll need to install and configure the Datadog Agent to collect logs from your systems and send them to Datadog.
Configure the Datadog Agent
First, install the Datadog Agent on your system. The installation process depends on your platform, whether it’s Linux, Windows, or a containerized environment. Check Datadog’s official documentation for detailed platform-specific instructions.
Once installed, enable log collection by modifying the datadog.yaml file. You can find this file at /etc/datadog-agent/datadog.yaml on Linux systems. Open the file and add the following line:
logs_enabled: true
This step activates log collection. Without it, the Agent will only gather metrics and traces, leaving out critical log data. After making this change, restart the Datadog Agent to apply the new settings. Use one of the following commands, depending on your system:
sudo systemctl restart datadog-agent
Or:
sudo service datadog-agent restart
Once the log collection feature is enabled, you can move on to configuring your custom log sources.
Add Custom Log Sources
Now that log collection is active, you’ll need to configure the specific log sources you want to monitor. Datadog supports a variety of collection methods, such as reading files, handling network connections (TCP or UDP), integrating with journald, or collecting Windows Event logs.
For custom application logs, create a dedicated configuration directory. Start by navigating to the Agent’s configuration folder and creating a new subdirectory named custom_log_collection.d under /etc/datadog-agent/conf.d/. Inside this folder, create a conf.yaml file to define your log source.
Here’s an example configuration for monitoring a custom application’s log files:
logs:
  - type: file
    path: /var/log/myapp/*.log
    service: myapp
    source: custom
    tags:
      - env:production
This setup tells the Agent to monitor all .log files in the /var/log/myapp/ directory. It also assigns a service name (myapp) and a source label (custom), making it easier to filter and analyze logs in Datadog.
Ensure the Agent has the necessary permissions to read your log files. If you encounter permission issues, you can adjust the file permissions with:
sudo chmod 644 /path/to/logfile.log
If your application generates structured JSON logs, Datadog can automatically parse the fields, making them searchable right away. For other log formats, Datadog’s processing pipelines can handle many common formats.
Verify Log Collection
Once your configuration is complete, it’s important to verify that logs are being collected and sent to Datadog. Start by checking the Agent’s status using the command:
datadog-agent status
This command provides detailed information about the Agent’s health, including whether the log collection feature is active. Look for the "Logs Agent" section in the output to confirm your log sources are correctly configured. If there are errors, they may point to issues like incorrect file paths, syntax errors, or permission problems.
Next, log in to the Datadog web interface and navigate to the Logs section in the dashboard. Look for recent log entries from your configured sources. Keep in mind that logs may take a few minutes to appear.
If you don’t see your logs in the dashboard, double-check your configuration file for errors and ensure the Agent has the correct file permissions.
Once logs are successfully collected, you can set up alerts based on specific log content and create dashboards to visualize log data alongside your other system metrics. This gives you a comprehensive view of your system’s performance and health.
Step 2: Set Up Automated Log Pipelines
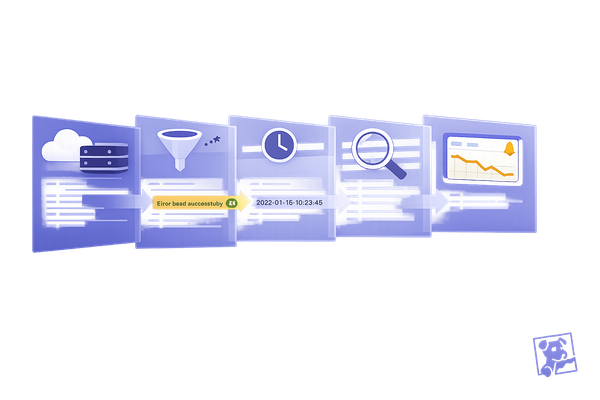
Once you've enabled log collection, the next step is to process and organize your raw logs. This transformation turns chaotic data into structured, searchable insights that your team can easily analyze and monitor.
Design Log Pipelines
Log pipelines are essential for effective log management in Datadog. They let you bring in logs from your entire system, parse and enrich them with context, tag them for better organization, create metrics, and spot anomalies quickly.
Start by setting up a pipeline for your most critical log sources. Head to the Logs section in Datadog, select Pipelines, and click New Pipeline. Give it a clear name that reflects its purpose, like "Web Application Logs" or "Database Error Logs."
The first step in building your pipeline is parsing. Grok parsers are particularly useful for pulling structured data out of unstructured log entries. For example, if your logs look like this:
2025-05-28 14:32:15 [ERROR] User authentication failed for user_id=12345 from IP=192.168.1.100
You can use a Grok parser with the following pattern:
%{TIMESTAMP_ISO8601:timestamp} \[%{WORD:level}\] %{DATA:message} user_id=%{NUMBER:user_id} from IP=%{IP:client_ip}
This setup extracts fields like the timestamp, log level, message, user ID, and client IP, making them accessible for filtering, alerts, and dashboards.
For consistency, use attribute remappers to standardize field names across different log sources. For instance, if one application uses "level" for severity and another uses "severity", remap both to a unified "status" attribute. This makes cross-application analysis much simpler.
Once your pipeline is ready, move on to standardizing log attributes.
Standardize Log Attributes
A consistent approach to naming attributes is key to efficient log analysis. Focus on unifying these core attributes across all logs:
service: The name of the application or service generating the log.env: The environment (production, staging, development).status: The log level or severity (info, warn, error, critical).source: The technology or framework generating the log (e.g., nginx, postgresql, custom-app).
Use attribute remappers to enforce these naming conventions. For example, if your web server logs use "severity" and your database logs use "log_level", remap both to "status" for uniformity.
Tags are equally important for organizing logs and tracking costs. Add tags that make filtering and analysis easier, such as:
tags:
  - team:backend
  - cost_center:engineering
  - region:us-east-1
This approach is especially useful when handling logs from multiple services. For example, a centralized SRE team managing logs from AWS CloudWatch can use pipelines to tag logs with cost attribution details, helping track resource usage across teams and projects.
Monitor Pipeline Performance
After setting up your pipeline, it's important to monitor its performance. Datadog's Log Pipeline Scanner is a no-code tool that lets you inspect log events in real time as they move through your pipelines. It highlights the processing steps applied to each log, making troubleshooting easier.
To access the Pipeline Scanner, go to Logs > Pipelines and click Scanner. Here, you can trace specific log events and see how they are processed at each step.
Common issues the Scanner can help you identify include:
- Unparsed logs: If your Grok patterns fail to match the log format, review and test them against sample logs.
- Missing tags: If some logs lack expected tags, check your attribute remappers and tag processors.
- Pipeline conflicts: When multiple teams modify the same log attributes, the Scanner shows which pipeline is making changes, helping you resolve conflicts.
If you notice problems in your dashboards - like missing metrics from custom application logs - the Pipeline Scanner can pinpoint whether another pipeline is altering logs in a way that disrupts queries.
Step 3: Automate Anomaly Detection with Watchdog
Once your pipelines are set up, it’s time to let AI take the reins in spotting problems. With Datadog's Watchdog, you get an automated monitoring assistant that analyzes logs and detects issues early, giving you a head start on troubleshooting.
Use AI-Driven Log Pattern Analysis
Watchdog leverages machine learning to monitor your infrastructure and applications, identifying issues like cloud service disruptions, high latency, or unusual error rates. It learns the typical behavior of your systems and flags anything that deviates from the norm.
The Log Anomaly Detection feature enhances your log management by highlighting anomalies, which helps speed up troubleshooting and reduces your mean time to resolution (MTTR). By clustering log patterns, Watchdog pinpoints irregularities that need your attention.
To activate Watchdog for your logs, head to Logs > Analytics in the Datadog dashboard and click on the Watchdog tab. Once your system has enough historical log data, Watchdog begins analyzing it automatically.
For instance, let’s say your app suddenly sees a spike in authentication errors during business hours - far beyond its usual range. Watchdog will flag this as an anomaly. It also examines related metrics, like traffic or checkout rates, to detect other irregularities.
The Correlations view is especially helpful for identifying root causes. If Watchdog spots a log anomaly, it searches for related issues in metrics, traces, or other logs from the same timeframe, giving you a clearer picture of what’s happening.
Configure Alerts for Anomalies
Proactive alerts ensure your team can address issues promptly, even outside regular hours. Watchdog Insights prioritizes anomalies based on details like severity (warning or error) and history (new pattern or spike), so you can focus on the most pressing problems first.
To set up a Watchdog monitor, navigate to Monitors > New Monitor, select Watchdog, and choose Logs as your data source. Define the scope of logs you want to monitor by filtering based on service, environment, or specific attributes. Tailor alert conditions to match the severity of anomalies. For critical services like payment processing, you might want alerts for any anomaly, while for less critical services, you could focus on high-severity issues to minimize unnecessary noise.
Craft clear and actionable alert messages. For example:
Watchdog detected a log anomaly in {{service.name}}:
- Anomaly type: {{anomaly.type}}
- Affected timeframe: {{anomaly.start_time}} to {{anomaly.end_time}}
- Severity: {{anomaly.severity}}

Runbook: https://your-company.com/runbooks/{{service.name}}
Dashboard: https://app.datadoghq.com/dashboard/{{dashboard.id}}
Set up notification channels that align with your team’s workflow. Use tools like PagerDuty or Slack for high-priority alerts that require immediate action, while email can handle lower-priority notifications. These alerts will guide your team to investigate anomalies and correlate them with metrics quickly.
Connect Anomalies with Metrics and Traces
Watchdog doesn’t just stop at identifying log anomalies - it also connects them to related metrics and traces. When you begin investigating an anomaly, Datadog automatically surfaces relevant data, such as infrastructure metrics or application traces, that occurred at the same time.
Clicking on a Watchdog anomaly opens an investigation panel, where you’ll find a timeline showing the anomaly alongside related events - like CPU spikes, increased memory usage, or delays in database queries.
For example, if Watchdog flags a pattern of database connection errors, the correlation view might reveal a simultaneous CPU spike, pointing you toward the underlying issue faster than analyzing logs alone. To make these connections more precise, ensure your logs, metrics, and traces share standardized tags (like service, env, and version).
When you identify a useful correlation that helps resolve an incident, document it in your runbooks. These records will make it easier for your team to handle similar issues in the future. You can also build custom dashboards that combine the most relevant correlations for your infrastructure and applications, streamlining your monitoring process over time.
Step 4: Build Custom Dashboards for Log Analysis
Once Watchdog is set up to monitor your logs for anomalies, the next step is creating dashboards that turn raw log data into insights your team can act on. These dashboards help you track trends, monitor performance, and make smarter decisions about your infrastructure. Let’s dive into how to set up visualizations that give your log data meaning.
Create High-Cardinality Visualizations
High-cardinality visualizations are perfect for analyzing data with many unique values, like client IPs or user IDs. These visualizations make it easier to detect trends and anomalies at a glance.
One effective option is toplists, which highlight the most frequent or significant values for specific log attributes. For example, you could create a toplist to identify which client IPs are generating the most error logs. This can help you spot potential security threats or problematic users.
To create a toplist widget, head to your dashboard and click Add Widget, then select Top List. Choose the log data source and define the metric you want to track, such as the count of log entries, the sum of response times, or the average of custom metrics. Group the results by a high-cardinality field like @http.client_ip or @user.id.
Another essential visualization is timeseries graphs, which allow you to track log-based metrics over time. Use these graphs to monitor trends like error rates by service, request volumes by region, or authentication failures by hour. These insights can help you uncover recurring issues.
For geographic analysis, geomap widgets are invaluable. Geomaps display user traffic distribution based on IP addresses from your logs, giving you a clear picture of your customer base and helping you identify regional performance issues or unusual traffic patterns that could indicate a security concern.
Add Dynamic Filters with Template Variables
Dynamic filters, powered by template variables, make your dashboards interactive and adaptable. They allow team members to focus on specific subsets of data without needing multiple static dashboards. These filters use tags and metadata from your infrastructure, often applied automatically by cloud providers and container orchestrators.
Start by defining template variables that align with your business needs. Common filters include service, environment, region, and status_code. To add a template variable, click the Settings gear icon on your dashboard, select Template Variables, and then click Add Variable. Choose the tag or facet you want to filter by, and Datadog will populate the available values automatically.
Template variables update dynamically, showing only relevant options. For example, you could start with a broad filter like service and then narrow down with more specific ones such as environment or container_id. You can even save specific dashboard views for easy sharing - like a "Payment Service - Production" view tailored for your team.
Combine Logs with Other Telemetry Data
Once you’ve set up interactive filters, take your dashboards a step further by integrating logs with other telemetry data. Datadog’s dashboards shine when you combine logs with metrics, traces, and Real User Monitoring (RUM) data, giving you a complete view of your system. This integration helps you correlate issues and see how they impact both your infrastructure and user experience.
For a unified system overview, use Screenboards to combine logs with metrics, traces, and annotations. When troubleshooting, Timeboards are particularly useful - they let you correlate log errors with metrics like CPU usage during the same timeframe. Adding RUM widgets, such as those showing page load times or user satisfaction scores, can help you understand how backend problems affect your customers.
| Dashboard Type | Best Use Case | Key Features |
|---|---|---|
| Screenboards | Visual presentations | Custom layouts with images and logs |
| Timeboards | Troubleshooting | Correlation within a single timeframe |
| Host Maps | Infrastructure overview | High-level system visualization |
To ensure consistent analysis, use the same time ranges across all widgets and apply the same template variables to both log and metric widgets. This ensures your data remains aligned when interacting with the dashboard.
Lastly, remember to update your dashboards regularly. As your business evolves, periodic reviews will help keep your dashboards aligned with your team’s current priorities and operational needs.
Step 5: Optimize Log Storage and Retention
Managing log storage effectively is key to balancing costs while preserving access to critical data. Datadog offers strategies to ensure you can retain essential logs without overspending.
Use Flex Logs for Cost Efficiency
Flex Logs provide an affordable way to store high-volume logs, costing just $0.05 per million logs per month. This approach separates storage from query costs and keeps logs queryable for 30 to 450 days.
Datadog suggests Flex Logs for scenarios involving high-volume logs (10 billion+ events per month) and long-term retention needs of 30 days or more. Examples include network flow logs, CDN logs, and load balancer logs - data that’s generated in large quantities but queried infrequently.
A hybrid strategy works best. Route 10–30% of production app logs (like error logs) into standard indexing for immediate access, extend them into Flex for 30 days, and send the rest directly to the Flex tier. This ensures critical logs are always available while keeping costs under control.
For real-time monitoring logs, avoid sending them directly to Flex. Logs critical for incident response, such as application logs during outages, should stay in standard indexing for quick troubleshooting.
Apply Selective Indexing for High-Value Logs
Selective indexing allows you to prioritize your budget for logs that are most relevant to daily operations. By setting up exclusion filters, you can prevent low-priority logs from being indexed while still keeping them archived for future use.
Logs like debug data, routine heartbeat messages, or low-priority system updates can take up significant storage but are rarely needed for immediate monitoring. Use Datadog’s Log Patterns view to identify high-volume log sources and decide which logs to exclude. This tool helps you spot trends in log generation and make informed decisions about indexing.
Even with exclusion filters, Datadog generates metrics before applying filters, so you can still track key data points without indexing the associated logs. Additionally, archived logs remain accessible through Logging without Limits™, and you can retrieve them later using Log Rehydration™ if needed.
Pair these practices with regular monitoring of your log storage metrics to maintain efficiency.
Monitor Storage Costs and Usage
Ongoing monitoring is essential for managing costs effectively. Datadog provides built-in tools to track log ingestion patterns and storage usage, helping you avoid unexpected charges.
- Usage dashboards: Set up dashboards to monitor daily log ingestion volumes, broken down by service and environment. These dashboards provide visibility into spikes in log generation that could affect your budget.
- Alerts: Configure alerts for when daily ingestion exceeds set thresholds, giving you an early warning of potential cost issues.
- Index quota reviews: Regularly check your index quotas to ensure they match your current needs. Adjust them as your infrastructure evolves to avoid data loss or unnecessary expenses.
You can also automate log filtering based on business hours or environment priorities. For instance, you might reduce debug log collection during off-peak hours or apply stricter filters in development environments while maintaining full logging for production systems.
To stay proactive, integrate these strategies into a regular review process:
| Storage Strategy | Best For | Cost Impact | Query Speed |
|---|---|---|---|
| Standard Indexing | Real-time monitoring, incident response | Highest | Fastest |
| Flex Logs | Compliance, historical analysis | $0.05/million logs | Fast (30–450 days) |
| Archive Only | Long-term storage, rarely accessed | Lowest | Requires rehydration |
Conduct monthly cost reviews to evaluate your log management expenses. Look for trends in data volume, application behavior changes, and opportunities to refine your strategy. This ongoing effort ensures you optimize storage costs as your systems grow.
Key Takeaways for SMBs
Datadog's automated log analysis is reshaping how small and medium-sized businesses (SMBs) monitor their infrastructure. It enhances system visibility while keeping costs in check. A smart starting point is to focus on monitoring your most critical applications and infrastructure first, then gradually expand to cover your full environment. From the outset, set clear key performance indicators (KPIs) tailored to your goals - whether that’s cutting downtime, speeding up response times, or optimizing resource use. This measured approach lays the groundwork for noticeable cost savings.
The financial perks can add up fast. For instance, Finout slashed costs by 30% using Datadog's analytics to identify optimization opportunities, and Resume Points trimmed 20% off their cloud expenses through improved tracking and resource allocation. These examples highlight how a well-tuned log analysis system can quickly justify its investment.
Automation is a game-changer, reducing manual effort by turning raw logs into actionable insights without heavy configuration. This process organizes unstructured data into searchable, filterable formats, improving alert accuracy and cutting down on false positives.
"As application complexity grows, so do log volumes. Organizations need to improve their visibility into these logs while staying within a reasonable budget."
- Michael Whetten, VP of Product at Datadog
Cost management becomes more straightforward with the right tools. Datadog’s Flex Logs provide an affordable option for long-term storage. By selectively indexing only high-value logs - like error, warning, and critical-status logs, which typically make up 10% to 30% of total log data - you can ensure premium rates are only applied where they’re truly needed.
Beyond cost control, automated log analysis drives operational improvements. For example, companies using AI in DevOps report a 50% drop in deployment failures, and 60% of developers say they’re more productive thanks to AI-driven insights. Datadog’s Watchdog feature makes these AI capabilities accessible to SMBs without requiring specialized machine learning expertise.
Success comes down to practical strategies. Start with conservative alert thresholds and tweak them based on real-world usage. Use built-in parsers to save development time, keep custom patterns simple for better performance, and roll out changes incrementally. Document your rules to ensure consistency across your team, and monitor parsing performance to avoid disruptions.
Regular upkeep is essential. Update dashboards to reflect shifting business priorities, conduct monthly cost reviews to refine your log management strategy, and adjust index quotas as your infrastructure evolves. Staying proactive helps you avoid falling into "monitoring debt."
For more tips and insights, check out Scaling with Datadog for SMBs at Scaling with Datadog for SMBs.
FAQs
How does Datadog's Watchdog feature use AI to improve log anomaly detection?
Datadog's AI-driven Watchdog transforms log anomaly detection by using machine learning to keep an eye on your data in real time. Instead of relying on fixed thresholds or manual setups, Watchdog learns your system's normal behavior and flags anything out of the ordinary - like sudden error surges or unexpected delays.
This hands-off approach means fewer manual tweaks and more actionable insights to pinpoint root causes quickly. By simplifying how issues are spotted and resolved, Watchdog empowers your team to work smarter, reduce downtime, and keep everything running smoothly.
How can Flex Logs and selective indexing in Datadog help reduce log storage costs?
Flex Logs in Datadog: A Budget-Friendly Solution
Datadog's Flex Logs offer an economical way to store massive amounts of log data, starting at just $0.05 per million logs per month. This approach provides businesses with a practical option to retain logs for long-term analysis without breaking the bank on storage costs. Plus, Flex Logs ensure you can access historical data instantly - no rehydration required - making it easier to manage resources and maximize your return on investment.
To make things even better, Datadog supports selective indexing. This feature allows you to pick and choose which logs to index for real-time analysis. By focusing only on the most important logs, you can cut down on storage and processing expenses while still meeting compliance standards and addressing investigative needs. Together, Flex Logs and selective indexing make it simple to handle log data efficiently, even as your logging demands grow.
How can I optimize my log pipelines in Datadog for better performance and accuracy?
How to Optimize Your Log Pipelines in Datadog
Boosting the performance and accuracy of your log pipelines in Datadog doesn’t have to be complicated. Here are some practical tips to keep things running efficiently:
- Simplify processors and parsing rules: Limit the number of processors in each pipeline to 20, and keep Grok processors to no more than 10 parsing rules. This keeps processing straightforward and avoids unnecessary complexity.
- Exclude irrelevant logs: Configure your logging agents to filter out logs you don’t need right at the source. Focusing on the essential logs not only improves accuracy but also reduces resource consumption.
- Prioritize critical logs: Route logs based on their importance to your business. This ensures that vital logs get the attention they need, especially during incidents, while optimizing resource allocation.
By sticking to these practices, you’ll create log pipelines that are efficient, reliable, and capable of delivering actionable insights.

