
Understanding Datadog Integrations for Better Insights
Explore how Datadog's extensive integrations empower SMBs to enhance monitoring, improve efficiency, and control cloud costs effectively.
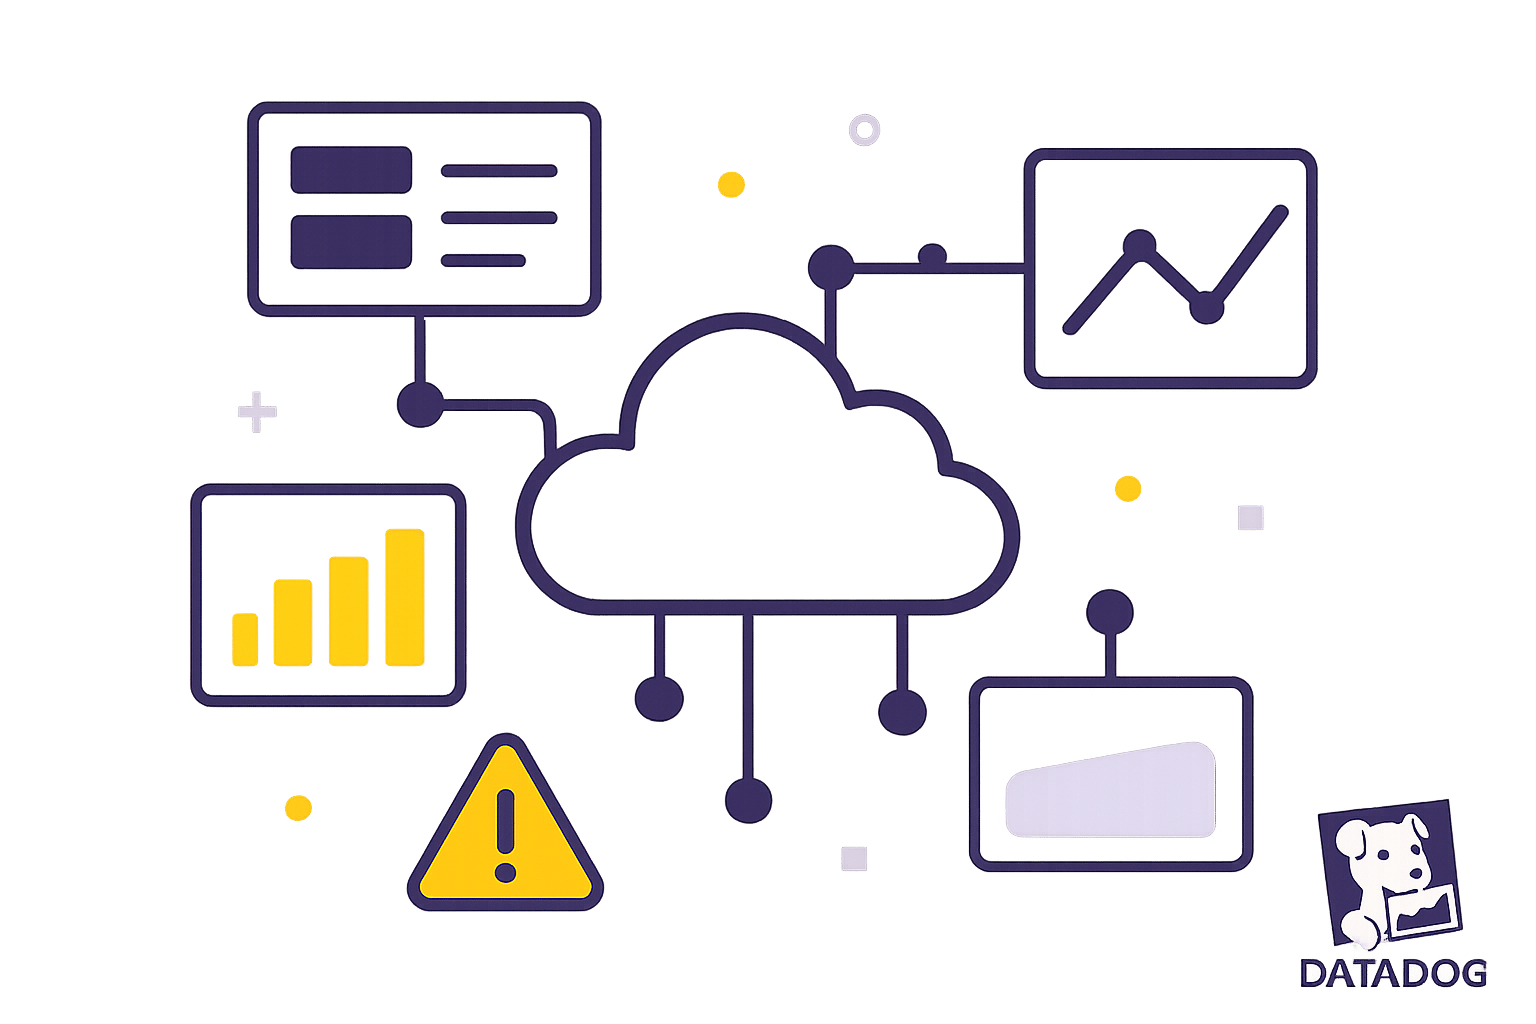
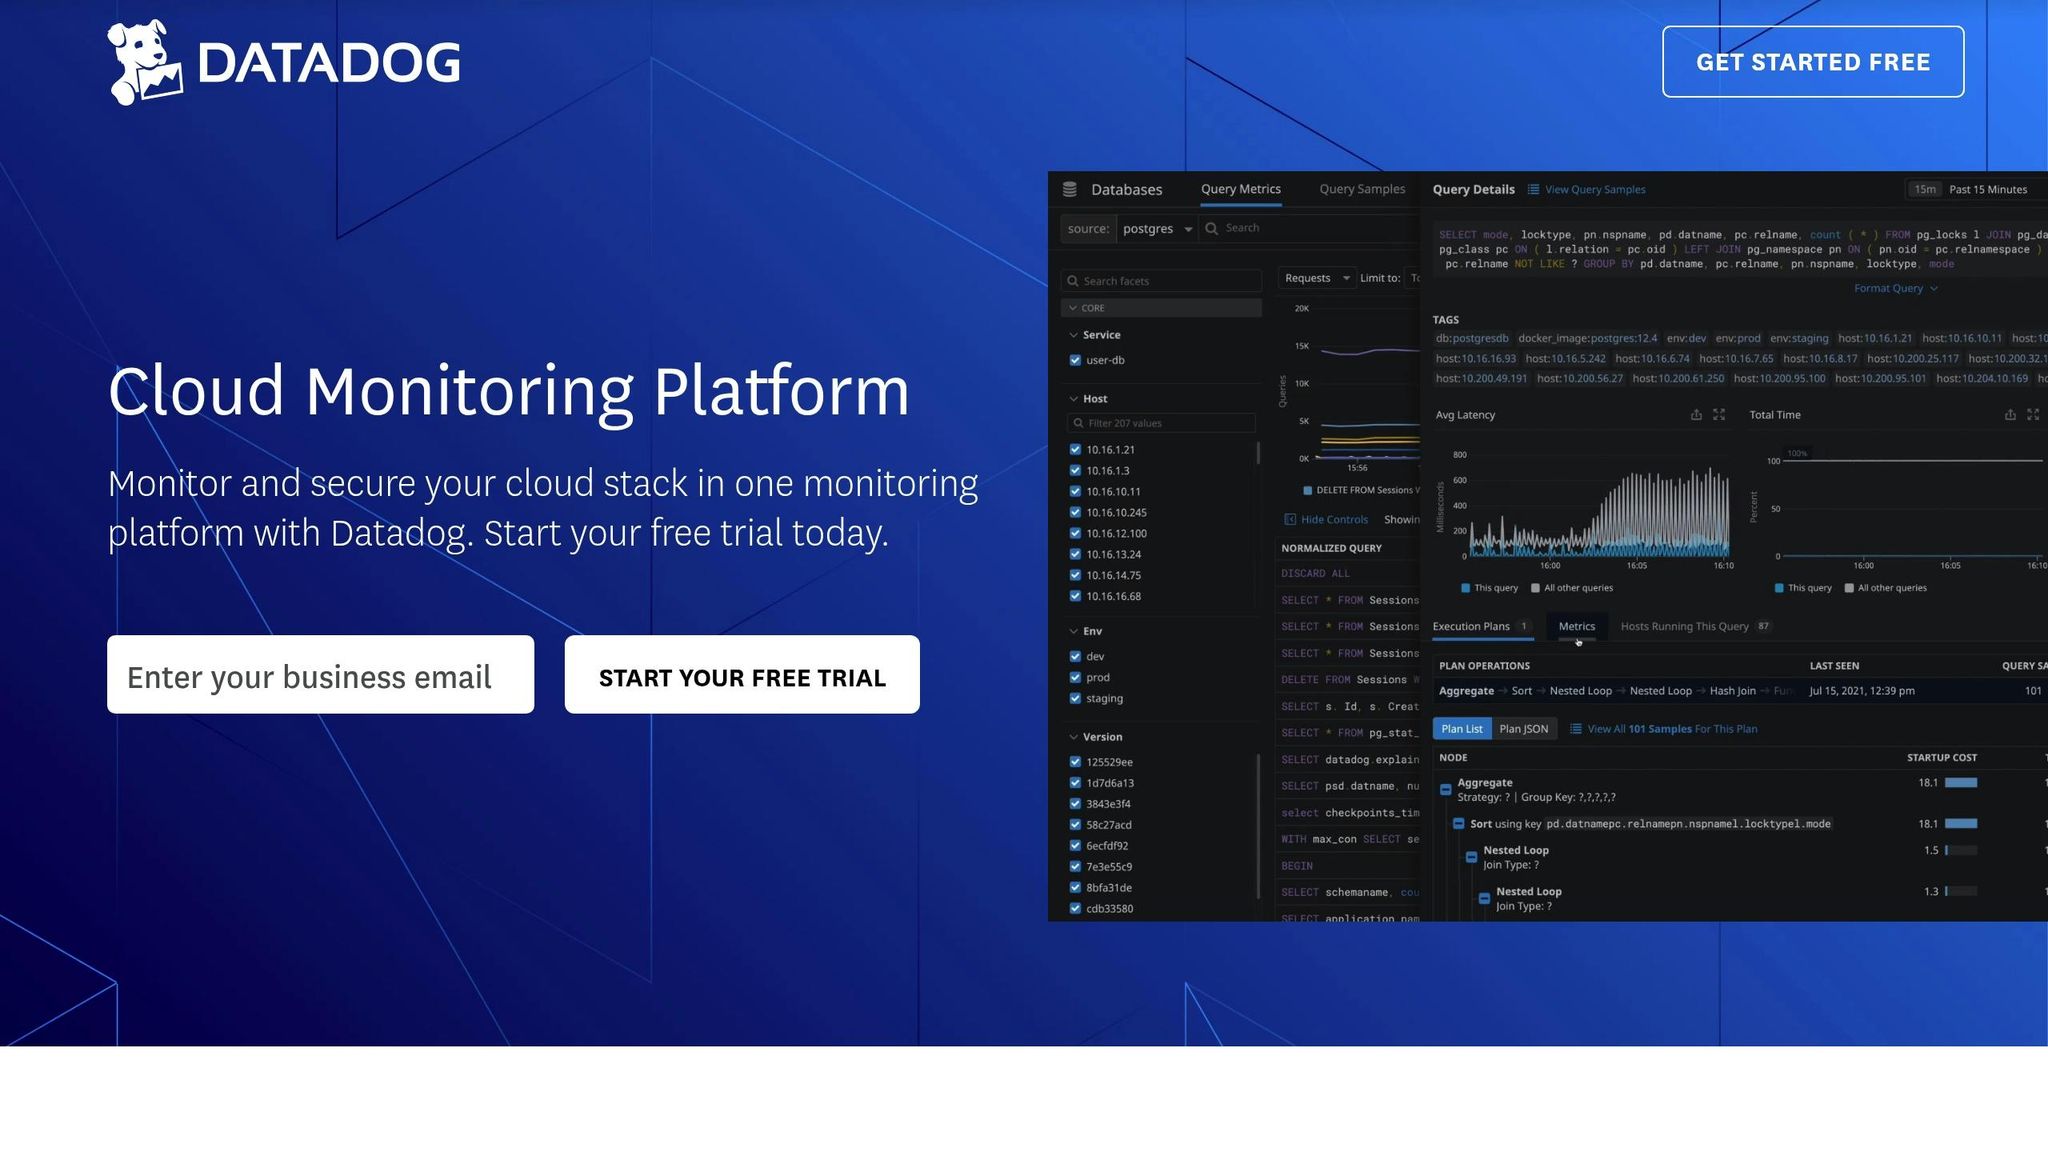
With over 850 integrations, Datadog helps small and medium businesses (SMBs) monitor their entire tech stack in one platform. From cloud services like AWS and Azure to databases and CI/CD tools, Datadog tracks performance, detects issues, and cuts costs. SMBs using Datadog report 40% higher efficiency and 25% faster incident response times.
Key Benefits of Datadog:
- Unified Monitoring: Combine cloud, app, and database insights in one dashboard.
- Ease of Use: No complex setup or coding knowledge required.
- Faster Incident Response: Detect and fix problems quickly with automated alerts.
- Cost Control: Track and reduce cloud expenses with built-in tools.
What Datadog Covers:
- Cloud Providers: AWS, Azure, Google Cloud.
- App Performance: Distributed tracing, error tracking.
- Databases: Query performance, resource usage.
- DevOps Tools: CI/CD pipelines, deployments.
Quick Tip: Use tags like env:prod or team:backend to organize resources and manage costs effectively.
Datadog isn’t just about performance - it helps SMBs save money, improve efficiency, and collaborate better across teams. Whether you're monitoring Azure storage latency or optimizing database queries, Datadog simplifies it all.
Datadog On Agent Integration Development
Cloud Provider Monitoring Setup
Datadog offers a unified platform to monitor multiple cloud environments, helping SMBs maintain a clear view of their infrastructure. With over 850 built-in integrations, it enables seamless monitoring across an entire cloud stack. This approach simplifies multi-cloud strategies, as outlined below.
Multi-Cloud Monitoring Basics
Datadog streamlines multi-cloud monitoring through automated data collection and centralized visibility. It automatically enrolls and tags dynamic hosts and containers, making it easier to manage resources across different cloud providers.
| Cloud Environment | Key Monitoring Features | Automatic Tagging & Collection |
|---|---|---|
| AWS | EC2 metrics, ECS containers, Lambda functions | Resource tags, availability zones |
| Azure | App Services, AKS, Functions | Resource groups, regions |
| Google Cloud | GKE, Cloud Run, Compute Engine | Projects, zones |
"Datadog helps us solve the pain point of observing a large hybrid cloud platform. It allows a single point of focus for our team to look at, adjust, and monitor our entire estate."
Azure Storage Monitoring Guide
To effectively monitor Azure Storage, focus on these key metrics and strategies:
-
Performance Metrics
- Monitor
SuccessE2ELatencyandSuccessServerLatencyto detect performance bottlenecks.
- Monitor
-
Optimization Tips
- Address high blob download latency with Azure Cache or CDN.
- Improve upload speeds by tweaking block sizes.
-
Resource Monitoring
- Keep an eye on various storage types:
- Blob storage (object storage)
- Table storage (NoSQL data)
- Queue storage (message buffering)
- File storage (SMB protocol)
- Keep an eye on various storage types:
Dashboard Creation and Tag Management
Organizing and monitoring cloud resources starts with effective tag management. Use the global env tag to distinguish between development, staging, and production environments. Add datacenter tags (e.g., datacenter: us1.prod) for better environment management and categorize services by function for more precise cost tracking. For AWS resources, key tags include Account, Autoscaling-group, Availability-zone, Instance-type, and Region.
When building dashboards, include an "Overview" section with essential service checks and metrics. Use template variables for dynamic filtering, allowing you to focus on specific issues. In Kubernetes environments, apply recommended labels like Component, Instance, Managed-by, Name, and Part-of.
Database and App Performance Tools
Datadog goes beyond just tracking cloud resources by offering tools to monitor databases and applications. These tools help SMBs keep their systems running smoothly by tracking key metrics and using AI-driven insights to detect and address issues before they escalate. With a focus on database and application metrics, businesses gain a clearer understanding of their systems.
Key Database Metrics to Monitor
Database performance monitoring centers around four main areas: query throughput, execution performance, connections, and buffer pool usage. Here's a breakdown of the most important metrics:
| Metric Category | Metrics | Why It Matters |
|---|---|---|
| Query Performance | Questions, Com_select, Query run time | Tracks execution times and flags slow queries |
| Resource Usage | Threads_connected, Buffer pool utilization | Keeps tabs on system capacity and memory usage |
| Error Tracking | Query errors, Aborted_connects | Identifies connection problems and issues with SQL statements |
| Throughput | Writes, Slow_queries | Measures database workload and spots bottlenecks |
For MySQL users, it's recommended to allocate up to 80% of physical memory to the buffer pool and adjust the default connection limit (151) based on workload demands.
With these metrics in place, businesses can shift focus to application performance for a more comprehensive view.
Application Performance Tools
Datadog's APM (Application Performance Monitoring) provides distributed tracing at the code level, connecting frontend and backend operations. By linking traces with infrastructure metrics, logs, and database queries, it delivers a full picture of performance.
Chris Seltzer, Engineering Manager at Compass, highlights the impact of Datadog's Database Monitoring: "Datadog Database Monitoring enables our engineers on both the product and infrastructure teams to pinpoint query performance issues and ultimately avoid prolonged downtime that disrupts the end-user experience".
Here are some standout features of Datadog’s APM:
- Thread-level tracing: Links traces with infrastructure metrics and frontend data.
- Code performance analysis: Offers insights into execution times and resource usage.
- Automated anomaly detection: Uses Watchdog AI to spot performance issues automatically.
Real-World Success Stories
Several companies have seen tangible results with Datadog's tools:
- Peloton: CTO & Co-founder Yony Feng shares, "Within the first 30 to 45 days, we were able to quickly identify the top five endpoints that had performance issues and reduce response times by 80 to 90%".
- Glovo: Amith Reddy, Site Reliability Engineer, notes, "With Datadog, we can identify inefficient queries and address them. We immediately saw resource consumption improvements".
- Zendesk: Staff Performance Engineer Anatoly Mikhaylov praises the Traces feature: "Datadog's Traces functionality is a next generation observability tool. It brings contextual information for high-volume services, and connects it to an individual request for analysis and troubleshooting".
Cost Management with Datadog
Keeping cloud costs under control is a priority for SMBs aiming to get the most out of their infrastructure investments. Alongside performance monitoring, managing expenses ensures teams can balance system health with financial efficiency.
Cloud Cost Tracking
Datadog simplifies cost tracking by automatically tagging and organizing spending data. This makes it easier to see where your money is going. The platform pulls cost data from a variety of sources, including:
| Cost Source Type | Supported Services |
|---|---|
| Cloud Providers | AWS, Azure, Google Cloud |
| SaaS Services | Databricks, MongoDB, Snowflake, OpenAI, Fastly, Twilio |
| Infrastructure | Container monitoring, Log management, Host monitoring |
With tagging options like team, service, or cloud account, you can filter costs to track changes over time. For instance, Datadog's analytics page helped identify a $204,000 (358%) cost spike in an RDS resource over three months.
Cost Reduction Methods
Cutting cloud expenses effectively requires smart resource management. Here are some actionable ways to reduce costs while maintaining performance:
-
Resource Optimization
Datadog's Cloud Cost Recommendations pinpoint areas where you can save. Suggestions include:- Pre-aggregating high-frequency metrics before sending them to Datadog.
- Using log sampling to reduce data volume for high-traffic services.
- Removing unused tags that could lead to unnecessary custom metrics.
- Auditing and discarding unused metrics.
-
Pricing Strategy
Understanding Datadog's pricing can help you manage costs better. Here’s a quick breakdown:- Infrastructure Monitoring: $15 per host/month.
- Container Monitoring: $1 per container/month (committed use).
- Log Management: $1.27 per million log events and $0.10 per GB processed.
-
FinOps Practices
Datadog supports advanced FinOps practices, offering discount programs that can cover up to 70% of eligible cloud spending in mature implementations.
These methods help ensure your budget stays in check while maintaining system performance.
Budget Alert Setup
To avoid unexpected costs, Datadog offers real-time alerting tools. These alerts notify teams when spending approaches predefined limits, enabling proactive cost management.
"Extending your visibility and more closely monitoring your cloud costs can position you to successfully adopt FinOps, which provides a framework that can help you maximize the value you get from your cloud spend." - Datadog
For example, when a web store scaled up its RDS instances and moved to larger instance types, Datadog's Cost Change Summary view immediately highlighted the increased expense, the number of instances, and the cost per instance. This allowed for quick adjustments to manage spending.
Here are key alerts to set up for better budget control:
- Spike Alerts: Detect sudden cost increases to address them immediately.
- Usage Alerts: Keep track of resource usage trends over time.
- Budget Thresholds: Set warnings at 75% and 90% of your budget limits.
These tools and strategies make it easier to stay on top of your cloud expenses and avoid surprises.
Integration Setup Guide
Set up and configure Datadog integrations to improve monitoring across your systems.
Integration Setup Steps
- Planning Determine your monitoring needs and define key metrics. Clearly document goals and what you aim to achieve.
- Agent Configuration Install the Datadog agent to start collecting metrics and connecting your services.
-
Service Integration
Use Datadog's marketplace to connect your services. Make sure to provide the necessary credentials and settings:
Configuration Element Required Information Connection Details Host URL, Port Number Authentication Username, Password/API Key Access Permissions Read/Write Privileges Metric Collection Custom Metrics, Collection Interval
Once your integrations are in place, configure alerts to tackle issues as they arise.
Alert Configuration Guide
Set up alerts to ensure you can respond to issues quickly. Datadog offers several monitor types:
- Metric Monitors: Track specific performance metrics.
- Host Monitors: Keep an eye on system-level performance.
- APM Monitors: Monitor how your applications are performing.
- Cloud Cost Monitors: Watch your cloud spending.
- Integration Monitors: Focus on metrics tied to specific services.
Here’s a quick guide to alert thresholds:
| Alert Level | Response Time | Notification Method |
|---|---|---|
| Critical | Less than 5 minutes | Email, SMS, Slack |
| Warning | Less than 15 minutes | Email, Slack |
| Info | Less than 1 hour |
Dashboard Setup Tips
-
Organize Your Structure
Start with an overview that highlights key metrics and service checks. Group data from broad to detailed levels, and include:
- Service health statuses
- Key performance metrics
- Error rates and logs
- Resource usage statistics
-
Design for Clarity
Keep visuals consistent across dashboards:
- Use title case for headers
- Align x-axes of adjacent graphs
- Match chart types to the data (e.g., area charts for volume, bar charts for counts)
- Add clear legends with easy-to-read labels
-
Set Up Template Variables
Use template variables for dynamic filtering:
Variable Type Use Case Example Environment Filter by deployment prod, staging, dev Service Filter by component api, database, cache Team Filter by ownership backend, frontend, ops
Conclusion: Making the Most of Datadog Integrations
Datadog integrations simplify infrastructure and application management for SMBs, offering clear insights into system performance and resource usage across organizations.
They also help cut costs. Alexander Tilkin, Cofounder and CTO of Complyt, highlights this point:
"In an hour, we cut our total AWS costs by 40 percent. When you have a tool that's very fast, integrates with your cloud provider, and lets you understand where you spend your money, it's very easy to dig deep into utilization of your compute resources."
With Datadog, teams can manage both performance and expenses without compromise. Tim Ewald, CTO at Kevel, puts it this way:
"It's not about tradeoffs between cost and performance: cost is a need, just as important as scalability and security. CCM has empowered engineers in our organization to understand this and act on cost data in the same way they would on performance, to maintain efficiency as we scale."
To get the most out of Datadog, consider these tactics:
- Use detailed sampling controls at the host, service, and endpoint levels to maintain visibility while managing costs.
- Apply Tag Pipelines for accurate cost allocation across cloud resources.
- Take advantage of automated recommendations that combine observability data with provider billing details.
- Use the Datadog Agent to enable distributed tracing for end-to-end performance insights.
Datadog's integrations make it easier to act on insights while keeping the platform straightforward. Chris Peraza, Cloud Engineer at Whatnot, explains:
"Datadog APM enables our developers to see the entire path from our iOS and Android clients all the way down to services they have built."
These approaches solidify Datadog as a go-to solution for optimizing both performance and expenses.
FAQs
How do Datadog integrations help SMBs improve efficiency and respond to incidents faster?
Datadog integrations empower small and medium businesses (SMBs) to enhance efficiency and speed up incident response by providing real-time visibility across their systems. These integrations consolidate data from various tools, such as cloud platforms, databases, and application performance monitoring tools, enabling teams to quickly identify and address issues.
With built-in integrations for collaboration tools like Slack, Zoom, and Microsoft Teams, Datadog ensures seamless communication during incidents. This allows teams to coordinate effectively, involve the right stakeholders, and resolve issues faster, reducing the mean time to resolution (MTTR). By streamlining workflows and improving system visibility, Datadog helps SMBs maintain reliable and high-performing infrastructure.
What are the best practices for using tags in Datadog to improve monitoring and manage costs effectively?
Using tags effectively in Datadog can help you organize and analyze your data more efficiently. Tags are key:value pairs that allow you to group and filter data for better insights into your systems. You can use tags to quickly search, aggregate, and pivot between metrics and logs, making it easier to monitor performance and troubleshoot issues.
Datadog automatically imports tags from platforms like AWS and Kubernetes, ensuring consistent identification of hosts and services. To further customize your setup, you can add your own tags directly in the Datadog Agent’s configuration file. For best results, follow unified service tagging by using the standard tags: env, service, and version.
To manage costs, review and remove unused or redundant tags, as Datadog charges for metrics created by custom tags. By keeping your tagging strategy streamlined, you can optimize both resource monitoring and cost efficiency.
How does Datadog APM improve application performance monitoring, and what are the advantages of using distributed tracing?
Datadog's Application Performance Monitoring (APM) enhances visibility into your applications by providing AI-driven distributed tracing. This feature tracks requests as they flow through your system - from frontend devices to backend services and databases - helping you identify bottlenecks and troubleshoot issues at the code level.
With distributed tracing, you can visualize the entire lifecycle of a request, uncover performance failures, and understand how different services interact. Key benefits include faster detection and resolution of issues, better collaboration across teams, and actionable insights into user behavior and system performance. These capabilities allow you to optimize your applications and improve overall reliability.


