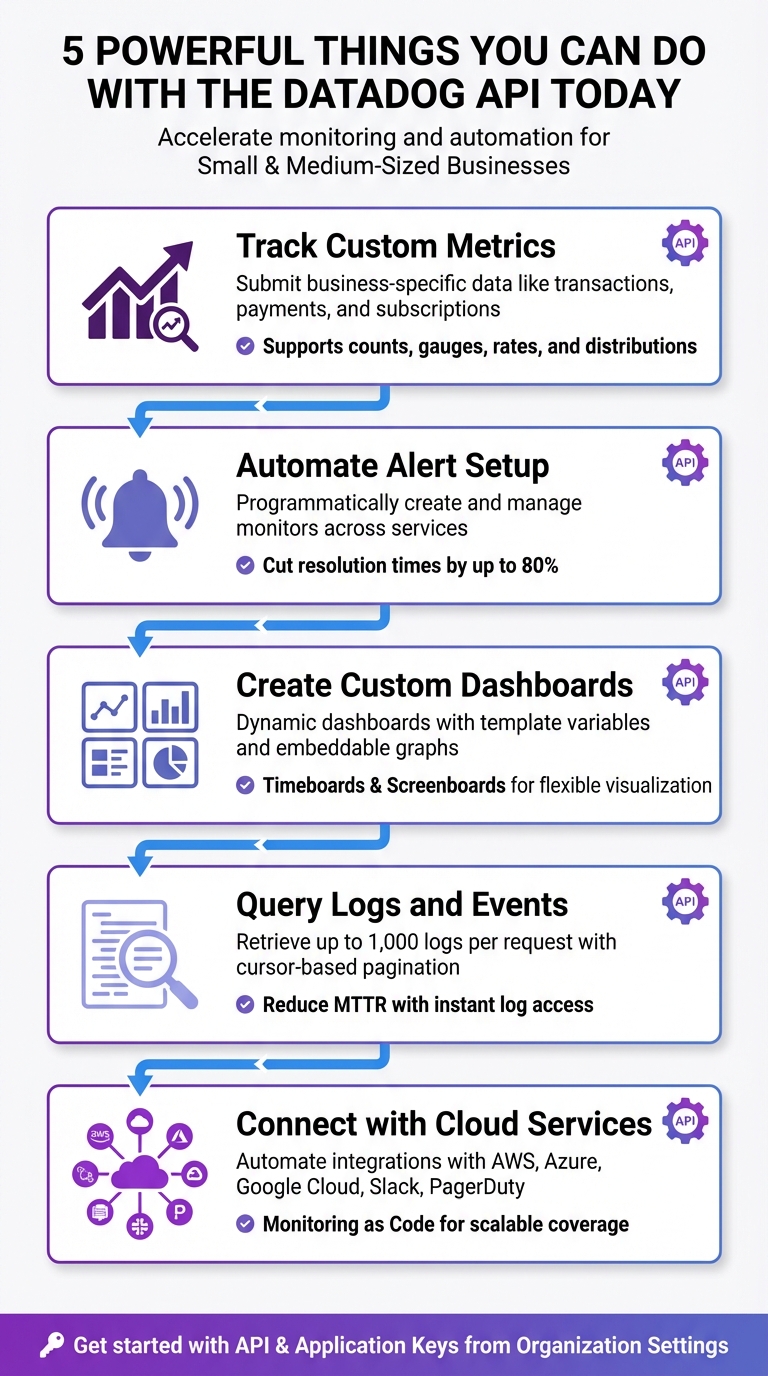
5 Powerful Things You Can Do with the Datadog API Today
Use the Datadog API to automate monitoring: submit custom metrics, manage alerts and dashboards, query logs, and connect cloud services.
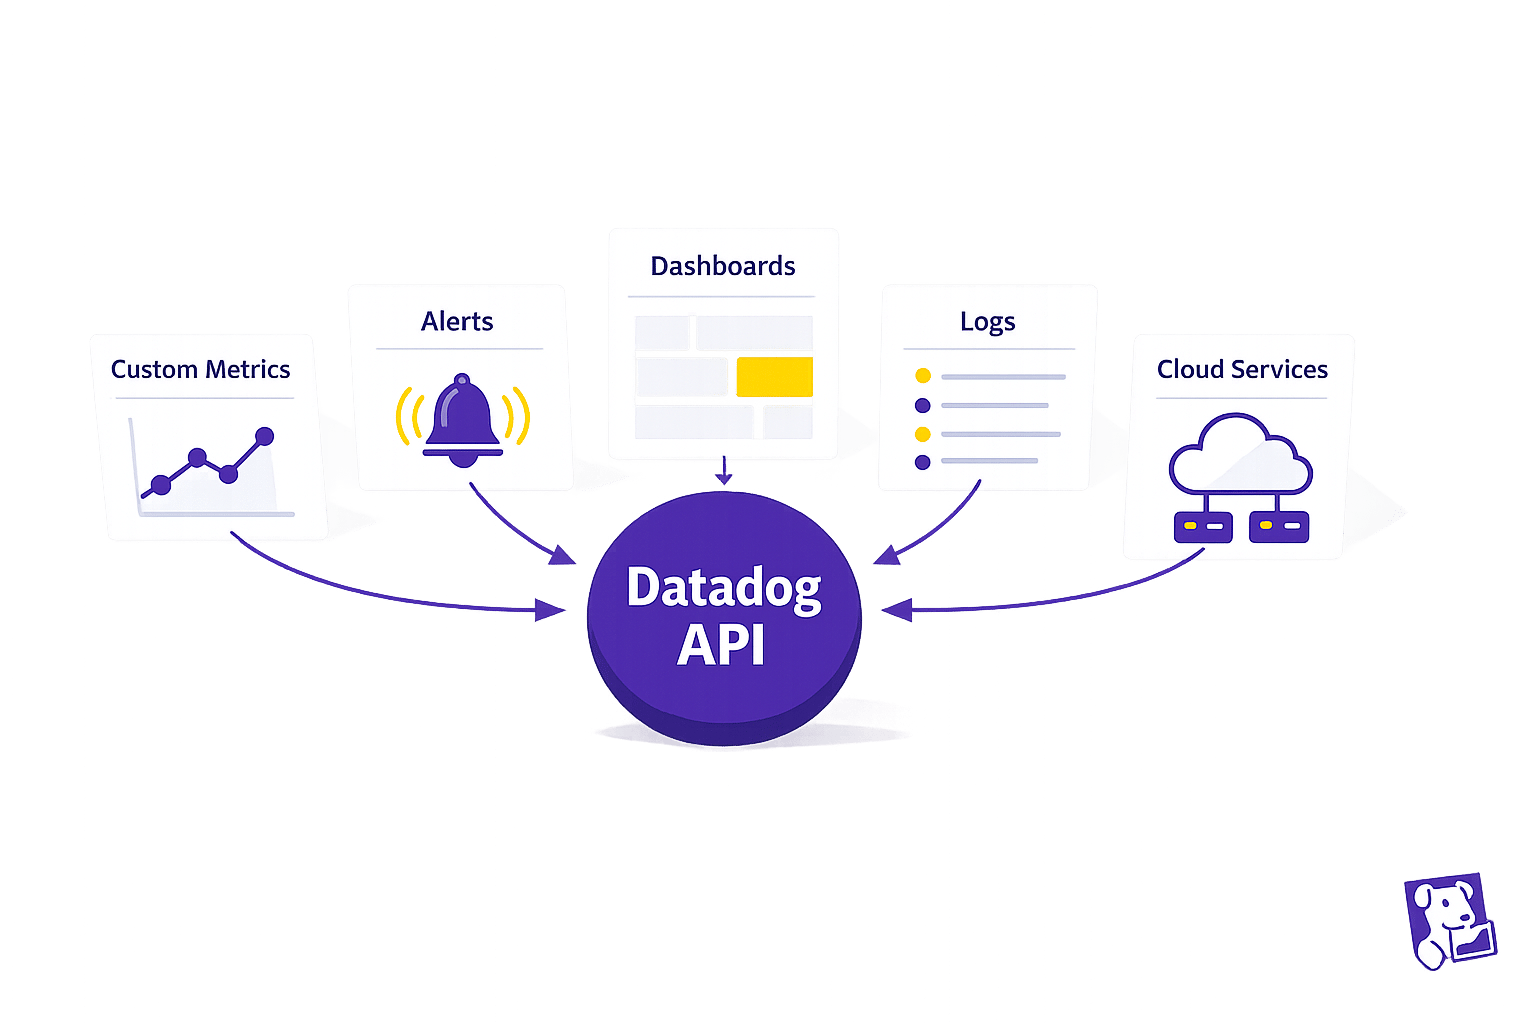
The Datadog API can save time and improve efficiency by automating key monitoring tasks. Whether you're an SMB juggling multiple responsibilities or looking to scale your operations, this API allows you to programmatically manage metrics, alerts, dashboards, logs, and integrations. Here's a quick summary of what you can do:
- Track Custom Metrics: Submit and analyze business-specific data like transactions or customer activity.
- Automate Alerts: Programmatically set up, update, and manage alerts for faster issue detection and response.
- Create Custom Dashboards: Build dynamic dashboards that adjust to your needs without manual effort.
- Query Logs and Events: Quickly retrieve and filter logs for troubleshooting and insights.
- Integrate with Cloud Services: Automate workflows and ensure consistent monitoring across platforms like AWS or Slack.
5 Key Capabilities of the Datadog API for SMBs
Session 20 | Datadog Advance | Working with Api
1. Create Custom Metrics for Your Business Workloads
Standard monitoring tools are great for tracking basics like CPU usage or memory, but they often miss the metrics that matter most to your business. Custom metrics let you focus on business-specific data points - like how many orders were processed today, how quickly payments are being handled, or the number of active subscriptions. Let’s dive into how this can work for SMBs.
Practicality for SMBs
Using the Datadog API, you can easily submit your own time-series data through the submitMetrics endpoint. Whether you prefer official client libraries like TypeScript or Python, direct HTTP POST requests, or even PowerShell scripts for Windows environments, the API offers plenty of flexibility. This is especially useful for setups like serverless environments or cloud infrastructures with restrictions, where installing a full Datadog Agent on every machine isn’t practical.
Impact on Monitoring Efficiency
Custom metrics give you insights that standard integrations just can’t provide. Want to track payment speeds or order volumes? You can do that. The API supports various metric types - counts, gauges, rates, and distributions - while allowing you to attach tags for filtering and grouping as your infrastructure grows. For high-throughput workloads, DogStatsD helps by aggregating data and reducing network traffic, while direct API calls are better for ingesting historical data or handling low-frequency updates. This approach not only automates monitoring but also ensures it’s tailored to your unique needs.
Ease of API Implementation
Getting started is straightforward. You’ll need an API Key to identify your account and an Application Key for management endpoints, both of which you can find in your Organization Settings. From there, you create a simple JSON payload that includes your metric name, timestamp-value pairs, metric type, and any relevant tags. As Srinivasan Gopalakrishnan explains:
"Custom metrics are application-level signals that only you can define... Unlike logs, metrics are cheap to query, easy to visualize, and perfect for alerts".
Once submitted, your metrics display instantly in Metrics Explorer, making it easy to visualize and set up alerts. Ready to handle growth? Let’s look at scaling.
Scalability for Growing Workloads
As your data needs expand, Metrics Without Limits™ helps you control costs by letting you decide which tag keys to index and which aggregations to store. Using the createTagConfiguration method, you can set up allow-lists or deny-lists for tags, ensuring only the most relevant business dimensions are indexed. Before submitting new metrics, the estimateMetricsOutputSeries method can help you evaluate potential cardinality, so there are no surprises with costs. Keep payload sizes under 500 KB (5 MB decompressed), with each metric point using roughly 100 bytes.
2. Automate Alert Setup and Notifications
Practicality for SMBs
Manually setting up alerts across different services can eat up a lot of time. With the Datadog Monitors API (available at the /api/v1/monitor endpoint), you can handle alert creation, updates, and deletions programmatically. This means you can define a set of alert templates once and consistently apply them across your services. Plus, the Webhooks integration lets you connect these monitors to third-party or internal tools, ensuring your team gets notified where they already work. By automating alert setup, you’re paving the way for quicker incident responses.
Impact on Monitoring Efficiency
Automated alert management can drastically improve how fast you detect and address issues. In fact, businesses that use automated alerts often cut resolution times by as much as 80%. Instead of manually checking for updates, webhooks provide real-time notifications and can even trigger automated remediation scripts when alerts go off. The API also allows you to schedule maintenance windows using Downtimes, so you can mute alerts during deployments and minimize unnecessary noise. Additionally, Monitor Quality metrics help you adjust and refine alerts to avoid false positives. These tools combine to significantly boost efficiency, making the implementation process worthwhile.
Ease of API Implementation
Getting started with the API isn’t as complicated as it might seem. You can test API calls using the Datadog Postman collection. The API supports a variety of monitor types, such as metric, integration, event, process, and service check monitors, offering flexibility to match your needs. To streamline implementation, follow best practices like programmatically assigning tags to ensure alerts reach the right teams, securely storing API keys, and using backoff/retry logic to handle rate limits. These steps help ensure a smooth experience.
Scalability for Growing Workloads
Automated alerts through the API are built to scale effortlessly as your infrastructure expands. For example, you can integrate alert deployment into your CI/CD pipeline to automatically monitor new components, such as Kubernetes clusters or cloud instances. For more advanced needs, Composite Monitors let you combine multiple alerts into one, reducing noise and focusing on overall system health. API rate limits depend on your plan: the Free tier supports 100 requests per minute for up to 5 hosts, while the Pro tier handles up to 1,000 requests per minute. To optimize performance, you can batch multiple operations into single API calls, keeping monitoring efficient as your workload grows.
3. Build Custom Dashboards to Track Performance
Practicality for SMBs
With the Dashboards API, you can manage dashboards programmatically - creating, updating, or deleting them without the hassle of manual clicks. This approach ensures consistency across environments. There are two main dashboard types to know: Timeboards, which use an automatic grid layout with a fixed time scale, and Screenboards, which offer free-form layouts with independent widget time scales. One standout feature is the use of template variables. These allow a single dashboard to adjust dynamically based on tags like service, environment, or customer_id. Instead of building separate dashboards for each project, you can simply switch views using a dropdown menu. This setup makes it easier to gain performance insights across different contexts.
Impact on Monitoring Efficiency
Custom dashboards, built on automated metrics and alerts, give you a unified view for quick performance assessments. With API-driven dashboards, you can unlock advanced analytics tools like anomalies() and rollup(). For instance, the anomaly detection algorithm flags data points that deviate significantly - more than 2 standard deviations - from the norm, using a lagging rolling quantile. Meanwhile, the rollup() function aggregates data into time buckets, making it easy to summarize trends, such as consolidating hourly data into a single point for better high-level reporting. Additionally, the Embeddable Graphs API allows you to generate secure URLs for specific graphs. These can be integrated into internal portals or shared with stakeholders, eliminating the need for full Datadog access.
Ease of API Implementation
To streamline the process, you can test JSON payloads using the Datadog Postman collection. Dashboards are defined in JSON, where you specify layout details, widget types, and queries. High-performing dashboards can be cloned as templates, saving time and reducing manual effort. To create a new dashboard, simply send a POST request to the /api/v1/dashboard endpoint with your JSON payload. This straightforward setup makes it easy to scale your dashboard capabilities as needed.
Scalability for Growing Workloads
As your infrastructure grows, API-based dashboards adapt seamlessly. By adopting a "Monitoring-as-Code" approach, you can store dashboard configurations in version control systems like Git, simplifying recovery and audits. For containerized environments, the Datadog Operator supports DatadogDashboard Custom Resource Definitions (CRDs), allowing you to manage dashboards alongside application code. This means dashboards can be automatically generated whenever new cloud resources or applications are deployed, ensuring no monitoring gaps during expansion. Template variables in your API calls also ensure dashboards stay relevant, no matter how many hosts or services you add.
4. Query Logs and Events for Immediate Insights
Practicality for SMBs
The Logs Search API offers small teams a way to streamline troubleshooting by automating access to log data. It allows you to filter logs using tags, time ranges, or specific queries like status:error or status:critical. On top of that, the Events API lets you dig into system changes, deployments, or alerts that might explain unusual log activity. For example, if an alert flags a problem, you can pull up logs and events together to check whether a recent configuration tweak caused a surge in application errors. This combination can significantly cut down Mean Time to Resolution (MTTR).
Impact on Monitoring Efficiency
Automating log retrieval takes monitoring efficiency to the next level. By instantly pulling relevant logs, you save time and reduce MTTR. The Log Analytics API allows you to create custom reports and aggregate data, making it easier to spot trends - like a sudden increase in error codes tied to specific workloads. If your team uses custom dashboards, you can embed real-time log aggregations directly into them. This gives developers quick access to insights without requiring full access to the Datadog platform.
Ease of API Implementation
Datadog makes API implementation approachable with detailed documentation and Postman collections to test queries before rolling them out. The API can fetch up to 1,000 logs per request. For larger datasets, it uses a cursor-based pagination system. This means you can navigate through millions of logs by making successive calls with the page[cursor] parameter. Always check the next_cursor in the response metadata to see if there’s more data to retrieve. Using Postman to test and refine JSON queries can also help minimize unnecessary data transfer.
Scalability for Growing Workloads
As log volumes grow, programmatic querying stays efficient, while manual searches in the user interface can become slow and impractical. Cursor-based pagination is essential for handling requests that exceed 1,000 logs. Tagging logs by service and environment helps narrow search results, speeding up query response times. The API supports advanced filtering and aggregation, enabling you to extract actionable insights from large datasets before transferring the data. This ensures your monitoring processes remain fast and efficient, even as your workloads scale.
5. Connect with Cloud Services to Automate Workflows
Practicality for SMBs
With the Datadog API, you can streamline integrations with platforms like AWS, Azure, Google Cloud, Slack, and PagerDuty. This enables automation of integration setups, saving time and effort. For instance, when provisioning a new cloud account using the AWS Organizations API, you can immediately call the Datadog Integration API to ensure monitoring is in place from the start. This eliminates the need for manual setup and ensures no gaps in monitoring coverage. Additionally, you can programmatically route notifications by embedding handles such as @slack-channel-name or @pagerduty in alert messages, triggering workflows automatically within your communication tools.
Impact on Monitoring Efficiency
When combined with custom metrics and automated alerts, integrating cloud services significantly boosts monitoring efficiency. Automating the setup of integrations not only saves time but also ensures uniformity across your environments. Metrics flow directly into Datadog’s prebuilt dashboards, providing immediate insights. The Workflow Automation API takes this a step further by enabling automated responses, such as restarting cloud instances or clearing caches directly from Datadog monitors.
David Lentz from Datadog highlights this advantage:
"With programmatic access to these integrations, you can automate the configuration of your monitoring and alerting coverage as your infrastructure scales or evolves".
This reduces the need for manual adjustments and accelerates incident resolution.
Ease of API Implementation
Datadog simplifies API implementation with tools like its Postman collection, which allows you to test API calls before deploying them in production. The Action Catalog provides ready-to-use connections for AWS services and generic HTTP requests, reducing the need for custom coding. For secure execution of internal scripts, the Private Action Runner can be triggered by the Datadog API. You can also use the filter_tags parameter (e.g., env:staging) to focus on relevant hosts, helping to control costs and minimize unnecessary data.
Scalability for Growing Workloads
As your infrastructure expands, programmatic integration ensures consistent and repeatable monitoring coverage. The Monitor API supports "Monitoring as Code", enabling automatic deployment of alerts whenever new cloud infrastructure is added. For services not directly supported in the Action Catalog, you can leverage the Webhooks integration to send JSON payloads to custom cloud functions like AWS Lambda or Azure Functions. This adaptability allows your monitoring processes to scale seamlessly alongside your workloads, eliminating the need for manual reconfiguration with each new resource.
Conclusion
The Datadog API equips small and medium-sized businesses with tools to automate monitoring, track custom metrics, and scale operations without the burden of manual tasks. By submitting custom metrics, such as transactions, user activity, and KPIs, your team can focus on solving real challenges instead of wasting time on routine processes.
To get started, retrieve your API and Application Keys from the Organization Settings. Use tools like Postman or official client libraries in Python and Ruby to test your initial requests. Make sure to store your keys securely - either in environment variables or a vault. Establish a consistent tagging system, such as env:production or service:payment-processor, to make filtering and data correlation easier.
As Apidog highlights:
"By mastering the Datadog API, you'll be able to programmatically create and manage dashboards, monitors, and alerts; submit custom metrics from any application; and automate incident management workflows."
Experiment with new integrations in a sandbox environment, and build dashboards to monitor API usage, including call volumes and error rates. This proactive approach helps identify issues early and ensures you stay within rate limits. With its RESTful architecture and JSON format, the API is straightforward for developers familiar with web services, making it easier to adopt and implement.
FAQs
When should I use DogStatsD vs direct API calls for metrics?
DogStatsD is a smart choice for scenarios that demand high-throughput performance. By functioning as a local agent, it processes large volumes of metrics with minimal delay, making it perfect for real-time monitoring needs.
On the other hand, direct API calls work well for submitting metrics less frequently or in more controlled situations. They provide flexibility for tailored actions or workflows but may lead to increased latency and overhead when dealing with high data volumes.
How do I avoid runaway custom-metric costs from high-cardinality tags?
To keep costs under control when dealing with high-cardinality tags in Datadog, focus on reducing the number of unique tag combinations. Simplify your metrics by cutting out inactive or redundant ones and tweaking how often data is collected. Take advantage of tools like "Metrics Without Limits" to manage stored metrics effectively and emphasize using low-cardinality tags. Make it a habit to review your tags and metrics regularly to identify and remove unnecessary high-cardinality tags. This approach helps maintain efficient monitoring while keeping expenses in check.
What’s the easiest way to manage monitors and dashboards as code?
Using Datadog's API is a simple way to create, update, and manage monitors and dashboards programmatically. This approach supports automation, version control, and scaling, making it especially helpful for small and medium-sized businesses. Alternatively, tools like Terraform allow you to define monitors as code, ensuring consistent and repeatable configurations across your infrastructure. Whether you choose the API or Terraform, both methods provide an efficient and scalable way to handle these resources.