5 Steps to Handle API Rate Limits in Datadog
Learn effective strategies to manage API rate limits, improve performance, and ensure seamless data collection with practical techniques.
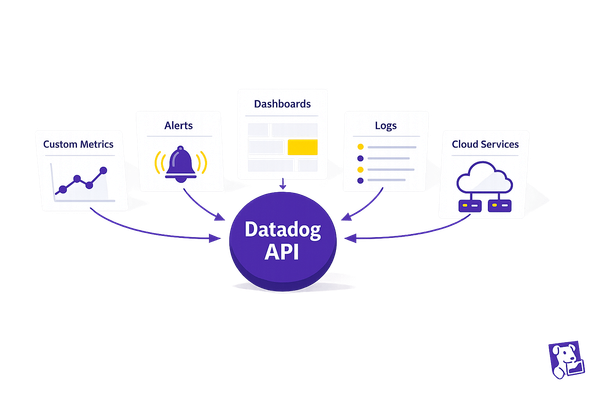
Managing API rate limits in Datadog is essential to keeping your systems running smoothly and avoiding interruptions. Here's a quick breakdown of the five steps you can take to handle rate limits effectively:
- Track and Monitor Usage: Understand your API usage by checking response headers and setting up dashboards to monitor request volumes and endpoint activity.
- Optimize API Calls: Group requests into batches, use pagination to limit data retrieval, and cache frequently accessed data to reduce redundant calls.
- Implement Backoff and Retry Logic: Handle rate limit errors (HTTP 429) with exponential backoff strategies and retry limits to prevent overloading the API.
- Use Webhooks: Replace constant polling with webhooks for real-time updates, reducing API demand while staying informed about critical events.
- Compare Mitigation Strategies: Combine approaches like batching, caching, and webhooks to suit your specific needs and traffic patterns.
Step 1: Track and Monitor Your API Usage
To manage Datadog's API rate limits effectively, the first step is understanding your current API usage. Having a clear picture of your usage patterns is critical to avoiding rate limit issues.
Check Your Rate Limits
Start by getting familiar with the specific rate limits that apply to your organization. Datadog enforces different limits for various API endpoints, and these limits influence how you should structure your API calls.
Here’s a quick look at the current rate limits for some commonly used Datadog API endpoints:
| API Endpoint | Rate Limit | Time Period |
|---|---|---|
| Metric Retrieval | 100 requests | Per hour per organization |
| Event Submission | 500,000 events | Per hour per organization |
| Query a Timeseries | 1,600 requests | Per hour per organization |
| Log Query | 300 requests | Per hour per organization |
| Graph a Snapshot | 60 requests | Per hour per organization |
| Log Configuration | 6,000 requests | Per minute per organization |
Since all users in your Datadog account share these quotas, teams with multiple members or automated processes can hit the limit faster than expected.
To check your current rate limit status, look at the response headers from any API call you make. These headers provide real-time insights into your usage. For ongoing tracking, set up monitoring to keep an eye on these metrics.
Monitor API Call Volume
To stay on top of your API usage, instrument your code to emit custom metrics and set up a dashboard that tracks key data, such as hourly API usage, endpoint-specific activity, and rate limit consumption.
For each API call, add code to increment a custom metric. Tag these metrics with details like the API endpoint, application name, and request type. This level of tagging helps you pinpoint which parts of your system are consuming the most quota.
Your dashboard should include widgets that display:
- Hourly request volumes
- Requests by endpoint
- Percentage of rate limit consumed
Set up alerts to notify you when you hit 80% of any rate limit. This gives you enough time to adjust before reaching the cap.
For organizations running multiple applications or services, a centralized logging system can be invaluable. Log all API calls with timestamps and endpoint details to create a clear audit trail. This helps you identify usage spikes and uncover opportunities for optimization.
Once you have a solid understanding of your usage, the next step is to address rate limit errors as they arise.
Identify Rate Limit Errors
Building on your monitoring setup, make it a priority to detect and respond to 429 errors. When you exceed Datadog's rate limits, the API will return a 429 "Too Many Requests" error. These errors are a clear sign that your API usage needs immediate adjustment.
For example, a Datadog agent once exceeded 600 requests per hour, resulting in metrics temporarily halting until the limit reset.
To handle this, set up error monitoring specifically for 429 responses. Log these errors along with details like the API endpoint, the action your application was attempting, and the timestamp. This information helps you spot patterns and understand when and why rate limiting occurs.
Pay close attention to the X-RateLimit-Reset header in 429 responses. This header tells you when you can resume making requests. Avoid retrying immediately after a 429 error, as this can worsen the issue.
Monitor your application logs for these errors and configure alerts to notify you when they occur. Even a single 429 error indicates that you're nearing your rate limit, and addressing the issue early can help prevent disruptions to your monitoring and data collection.
Step 2: Improve API Call Patterns
Streamline your API calls to lower request frequency and avoid hitting rate limits.
Batch and Group API Requests
Rather than making individual API calls for every operation, combine multiple operations into a single API request. This strategy significantly reduces the total number of API calls.
Take a cue from the Datadog Agent, which automatically groups metrics before sending them to Datadog. This method is far more efficient than submitting each metric individually and helps you stay within rate limits.
For your custom applications, gather multiple metrics and send them together in one request. Apply the same logic to log submissions and event creation. Increasing batch sizes can enhance throughput while cutting down the number of requests. For instance, if you currently send 100 individual metric submissions per hour, batching them into 10 requests with 10 metrics each slashes your API call volume by 90%.
However, remember to balance batch size with the need for up-to-date data. Similarly, optimize how you retrieve data by using pagination and fine-tuned parameters.
Use Pagination and Efficient Parameters
After batching requests, refine your strategy by limiting the volume of data retrieved and filtering results effectively. When pulling data from Datadog's APIs, use pagination parameters to control how much data is returned in each response. This avoids oversized responses that can waste bandwidth and slow down processing.
Stick to a consistent pagination approach by using parameters like page[limit] to define the number of records per request. For example:
params = {
    "filter[from]": int(time.time()) - 3600,  # Last hour
    "filter[to]": int(time.time()),
    "filter[query]": "service:api status:error",
    "page[limit]": 1000,
    "sort": "-timestamp"
}
Additionally, leverage sorting and filtering parameters to fetch only the data you need. Instead of retrieving all metrics and filtering them locally, use Datadog's query parameters to narrow down the results directly at the API level. This reduces both the size of the response and the processing workload for your systems.
When querying metrics across different dimensions, be as specific as possible:
query="avg:api.response_time{*} by {region}"
This focused approach ensures you get the exact data you need without overloading the API with broad or unfocused requests.
Finally, limit redundant calls by caching frequently accessed data.
Cache Frequently Accessed Data
Pair efficient request handling with caching to reduce repetitive API calls. Many monitoring tasks involve accessing the same static or semi-static data - like configuration details, dashboard layouts, or historical metrics - multiple times.
Set up a local cache for data that rarely changes, such as monitor configurations, dashboard definitions, or user permissions. By caching these elements for several hours, you can eliminate dozens of unnecessary API requests.
For time-series data, consider how often you need updates. If your application displays metrics that don’t require minute-by-minute updates, cache the results and refresh them at sensible intervals. For example, a dashboard showing daily trends doesn’t need to query the API every time it’s viewed.
Use cache expiration policies that match the update frequency of your data. Configuration data might be cached for hours, while real-time metrics could be cached for just a few minutes. This way, you maintain reasonably up-to-date data while keeping API usage low.
To handle critical updates, include cache-busting mechanisms. If a user manually refreshes a dashboard or makes configuration changes, allow the cache to be bypassed so fresh data can be fetched directly from the API.
Step 3: Add Backoff and Retry Logic
Incorporating smart retry mechanisms is key to handling API rate limits effectively and ensuring your application remains resilient.
Learn Backoff Strategies
Exponential backoff is a reliable method to manage retries, gradually increasing the wait time between attempts. This gives Datadog's servers a chance to recover while reducing the risk of your application being blocked.
Here’s how it works: start with a short delay (like 1 second), then double the wait time after each retry. Add a small random jitter to avoid multiple clients retrying simultaneously. This method adapts dynamically to the severity of rate limits.
Unlike fixed wait strategies that may be too harsh or too lenient, exponential backoff strikes a middle ground. If the rate limit is mild, retries won’t delay you unnecessarily. For stricter limits, the backoff extends appropriately to prevent further issues.
Detect and Handle Rate Limit Responses
Your application should be able to identify when it has hit a rate limit and adjust accordingly. Datadog signals this with an HTTP 429 "Too Many Requests" status code and provides headers to guide your retry approach.
Here’s an example of how to handle rate limits with exponential backoff:
import requests
import time
import random

def make_api_request_with_backoff(url, headers, payload=None, max_retries=5):
    retries = 0
    while retries < max_retries:
        response = requests.post(url, headers=headers, json=payload) if payload else requests.get(url, headers=headers)
        if response.status_code == 429:  # Too Many Requests
            # Extract rate limit details
            limit = response.headers.get('X-RateLimit-Limit', 'Unknown')
            remaining = response.headers.get('X-RateLimit-Remaining', 'Unknown')
            reset = int(response.headers.get('X-RateLimit-Reset', 60))
            print(f"Rate limit hit: {remaining}/{limit} requests remaining. Reset in {reset} seconds.")
            # Calculate backoff time with jitter
            backoff_time = min(2 ** retries + random.uniform(0, 1), reset)
            print(f"Backing off for {backoff_time:.2f} seconds")
            time.sleep(backoff_time)
            retries += 1
        else:
            return response
    raise Exception(f"Failed after {max_retries} retries due to rate limiting")
Pay close attention to the Retry-After header in 429 responses. If present, it specifies the exact wait time before retrying. Use this value instead of a calculated backoff time to align with Datadog’s recommendations. Additionally, handle other HTTP status codes like 500 or 503, which indicate server-side issues that may resolve with retries. However, errors like 401 or 403 typically point to authentication problems that retries won’t fix.
Set Retry Limits and Log Errors
To prevent endless retry loops, set a maximum number of retries - five attempts is often sufficient. This gives your application multiple chances to succeed without causing excessive delays. Also, configure timeouts to avoid prolonged waits.
Log retry attempts and errors to refine your strategy. Track metrics like retry frequency, success rates after retries, and average backoff times. This data helps pinpoint patterns and optimize your approach.
For instance, logging rate limit encounters can look like this:
import logging

logging.basicConfig(level=logging.INFO)
logger = logging.getLogger(__name__)

# In your retry logic
logger.warning(f"Rate limit exceeded. Attempt {retries + 1}/{max_retries}. "
               f"Waiting {backoff_time:.2f} seconds before retry.")

# After all retries fail
logger.error(f"API request failed after {max_retries} retries. "
             f"Endpoint: {url}, Final status: {response.status_code}")
This type of logging not only helps you understand API usage patterns but also highlights endpoints that frequently hit rate limits. By identifying these areas, you can focus on optimizing the most problematic parts of your application.
"Organizations that implement strategic API usage patterns typically see a 30-40% reduction in monitoring costs while improving data quality." – Cloud monitoring specialists
Step 4: Use Webhooks and Alternative Data Collection Methods
Once you've fine-tuned your API call patterns and implemented solid retry strategies, it's time to explore ways to reduce API demand further. One effective approach is using alternative methods like webhooks, which can deliver real-time updates without constant polling.
Use Webhooks for Real-Time Updates
Webhooks act as event-driven HTTP callbacks that notify your application as soon as something important happens - like system alerts, updates, or threshold breaches. Unlike traditional API polling, where your application repeatedly requests data to check for changes, webhooks allow the server to send updates automatically when new data is available.
To set up webhooks in Datadog, you'll need to generate an API key in your account and create a webhook endpoint to receive updates. Make sure to configure your endpoint with headers like Accept: application/json, Content-Type: application/json, and DD-API-KEY: ${YOUR_API_KEY}. For example, Datadog webhooks can send instant notifications to tools like Slack whenever a critical threshold is breached, ensuring your team stays informed without delay.
Benefits of Webhooks for SMBs
For small and medium-sized businesses, webhooks can be a game-changer in terms of cost and efficiency. Instead of wasting resources on frequent polling, webhooks streamline data delivery by sending updates only when necessary. According to Zapier, just 1.5% of polling requests typically result in new data, meaning the majority of those calls are redundant and consume unnecessary bandwidth and server resources.
Webhooks not only reduce this overhead but also help lower API usage fees. Their event-driven nature ensures that as your system scales - whether you're monitoring 10 servers or 100 - webhooks only trigger when an event occurs, making them far more efficient than constant polling. This efficiency is especially valuable for businesses looking to optimize their operations without overspending.
When to Use Webhooks Over Polling
Deciding between webhooks and polling depends on your specific monitoring needs. Webhooks are ideal for scenarios requiring real-time updates, especially when events are sporadic. On the other hand, polling works better for situations where updates are frequent and regular intervals are acceptable.
| Scenario | Best Choice | Reason |
|---|---|---|
| Alert notifications | Webhooks | Immediate response needed for critical, infrequent events |
| Dashboard updates | Polling | Regular intervals suffice for frequent data changes |
| Incident response | Webhooks | Real-time updates enable quick action |
| Historical data collection | Polling | Batch processing is more efficient for large datasets |
For example, webhooks shine in situations like GitHub triggering a CI/CD pipeline after a code push or a CRM receiving an alert when a lead submits a form. These examples show how webhooks deliver updates only when meaningful events occur, avoiding unnecessary noise.
"Polling is the process of repeatedly hitting the same endpoint looking for new data. We don't like doing this (it's wasteful), vendors don't like us doing it (again, it's wasteful) and users dislike it (they have to wait a maximum interval to trigger on new data). However, it is the one method that is ubiquitous, so we support it." – Zapier
Keep in mind that webhooks need to be configured in advance. You'll have to provide the service with the necessary details about where and how to send data. This upfront effort is well worth it, as it significantly reduces API usage and ensures faster response times for critical events.
Step 5: Compare and Choose the Best Mitigation Strategies
Now that you've worked through the earlier steps, it's time to evaluate and select the most effective combination of mitigation strategies for your specific setup. The goal is to align these strategies with your API traffic patterns and operational requirements for optimal performance.
Comparison of Mitigation Strategies
-
Batching API Requests
By combining multiple API calls into a single request, batching helps reduce the overall number of requests made, which can lower the load on your system. -
Caching Frequently Accessed Data
Caching allows you to store commonly requested data temporarily, cutting down on redundant API queries and improving response times. -
Backoff and Retry Logic
This method ensures that your system can handle temporary rate limit responses or network issues by retrying requests after a calculated delay. -
Webhooks
Webhooks provide real-time updates by pushing data to your system, eliminating the need for constant polling.
Combining these strategies often delivers the best results. For instance, you might rely on caching for data that doesn’t change often, use batching for bulk operations, and implement webhooks for time-sensitive updates. The right mix will depend on your API traffic patterns, such as peak request periods and call frequency.
It's also important to understand how your API provider's rate-limiting algorithm works. For example, fixed window algorithms might lead to sudden bursts of traffic, whereas sliding windows distribute the load more evenly. This knowledge can help you fine-tune your approach.
Conclusion
By following these five steps - from monitoring API usage to integrating webhooks - you can ensure your operations stay on track without unnecessary interruptions. A structured approach to managing API rate limits in Datadog helps maintain seamless monitoring workflows.
These strategies work best when applied together, creating a solid foundation for API management. Start by analyzing your current API usage to establish a baseline. Then, optimize your call patterns by batching, grouping, or caching requests to minimize redundant calls. Employ backoff and retry logic to handle temporary rate limits, and use webhooks to eliminate the need for constant polling.
Proper rate limiting not only ensures smoother server performance by controlling traffic and avoiding resource overload, but it also strengthens security by mitigating risks like denial-of-service attacks, brute force attempts, and API misuse. Whether you're using Datadog’s free tier for smaller projects or upgrading to the Pro tier for extended data retention and higher API limits, these strategies help you get the most out of your setup.
Begin with one or two methods that address your immediate needs, and expand your approach as your monitoring demands grow.
FAQs
How can I find the rate limits for Datadog API endpoints, and why does it matter for managing API usage?
When working with Datadog's API, you can find the rate limits for specific endpoints in the response headers, particularly the X-RateLimit-Limit header. These headers give you important details, like your current request limit and the reset time.
It's important to keep track of these limits to avoid hitting them, which would trigger rate limit errors (HTTP 429). By keeping an eye on your API usage and pacing your requests, you can ensure seamless access and uninterrupted integration with Datadog's services.
What are the advantages of using webhooks instead of polling for real-time updates in Datadog, and how can I set them up effectively?
Using webhooks in Datadog offers a smarter alternative to traditional polling. Instead of repeatedly making API calls to check for updates, webhooks provide real-time notifications by instantly pushing data whenever an event happens. This not only speeds up the update process but also cuts down on resource consumption and lowers infrastructure expenses, making it a more efficient and dependable solution than polling.
To get started with webhooks in Datadog, navigate to the Webhooks integration in the Datadog console. Enter the target URL where you want the data sent, and customize the payload to include the specific information you need. Once everything is set up, Datadog will handle the rest - automatically sending updates or alerts based on the events you’ve defined. This ensures you receive timely and accurate information without unnecessary overhead.
What is exponential backoff, and why is it better than fixed delays for handling API rate limit errors?
Exponential backoff is a retry technique where the wait time between attempts grows progressively after encountering API rate limits. With each retry, the delay usually doubles, giving the server more breathing room to recover and lowering the risk of repeated failures.
Unlike fixed delays, this approach adapts to the server's load, helping to prevent overwhelming the system. It also increases the likelihood of successful requests by spacing out retries more effectively. By reducing redundant attempts and responding to server conditions, exponential backoff provides a smarter and more reliable way to manage rate limit errors.

