Common Application Performance Issues Datadog Solves
Learn how a unified platform addresses slow apps, errors, and resource bottlenecks for small and medium businesses to enhance performance.
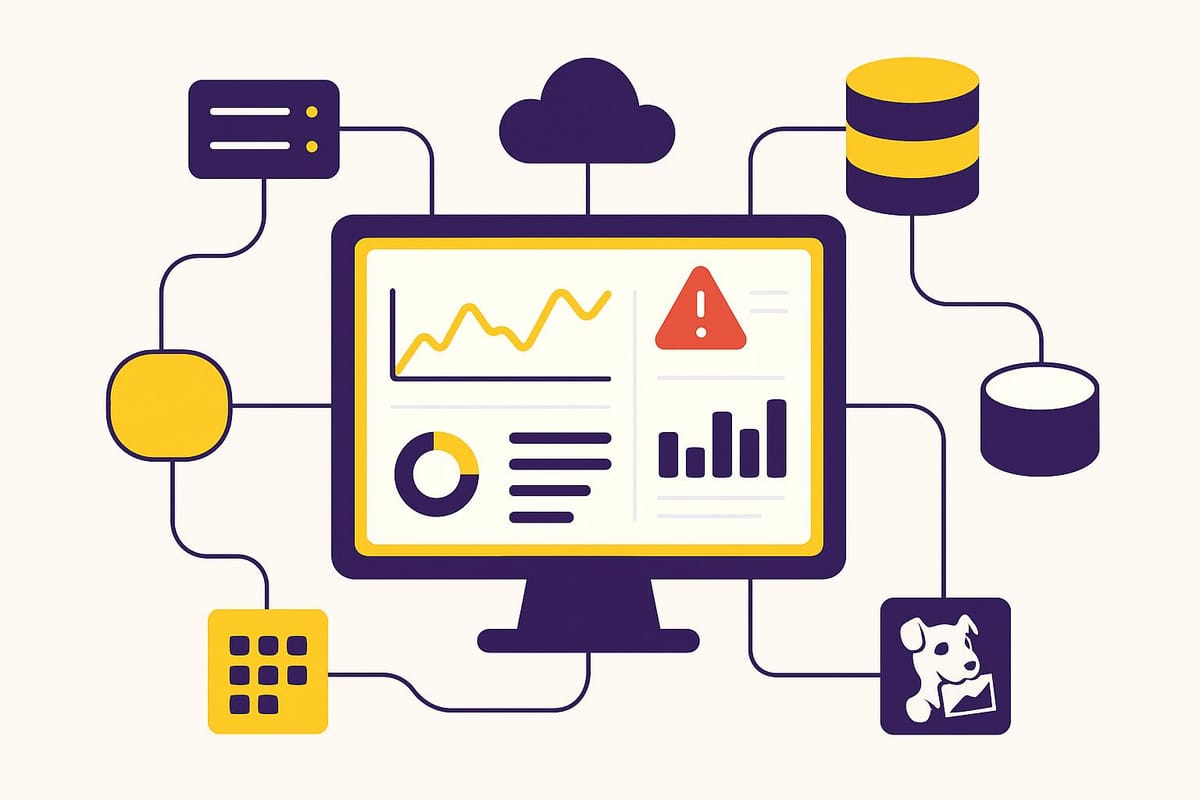
Struggling with slow apps, errors, or costly downtime? Here's how Datadog helps small and medium businesses (SMBs) solve these issues:
- Slow Response Times: Tracks delays with real-time monitoring and AI-powered tools to pinpoint bottlenecks.
- Frequent Errors & Outages: Detects and analyzes errors fast, reducing downtime and its financial impact.
- Resource Bottlenecks: Monitors infrastructure to optimize CPU, memory, and storage use, cutting costs.
- Log Management Challenges: Centralizes logs, making it easier to troubleshoot and resolve issues quickly.
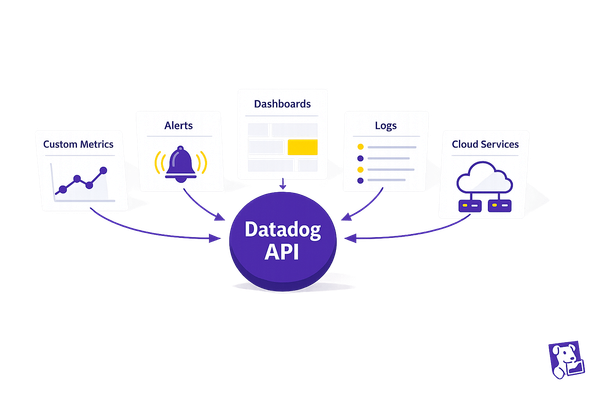
Datadog unifies metrics, logs, and traces into one platform, helping SMBs improve performance and reliability while keeping costs under control. With flexible pricing, it's designed to grow with your business.
Datadog Application Performance Monitoring (APM)
Slow Response Times and Latency Issues
When an application slows down - whether it’s a lagging webpage or an API timing out - users notice. And when users notice, satisfaction drops, and your bottom line can take a hit. For small and medium-sized businesses (SMBs), slow response times are one of the most obvious performance challenges, directly impacting customer satisfaction and loyalty. These latency issues disrupt user experience and can drive customers away.
The root causes of these delays often hide deep within complex systems - whether it’s slow database queries, inefficient code, or network congestion. Without the right tools, pinpointing these problems can feel like searching for a needle in a haystack.
Real-Time Latency Monitoring with APM
Datadog's Application Performance Monitoring (APM) takes the guesswork out of identifying delays. With code-level distributed tracing powered by AI, APM tracks every step of a request - from the browser to backend services - revealing exactly where bottlenecks occur.
APM doesn’t just skim the surface; it follows the entire journey of a user request. For instance, when someone clicks a button on your site, APM traces that interaction through every service, database query, and external API it touches. This level of detail enables teams to pinpoint performance issues with laser-like accuracy.
"Datadog APM enables our developers to see the entire path from our iOS and Android clients all the way down to services they have built." - Chris Peraza, Cloud Engineer, Whatnot
One Datadog customer, within just 30 to 45 days, identified their top five problematic endpoints and slashed response times by 80–90%. For SMBs, this kind of insight is invaluable. Datadog’s unified platform allows teams to seamlessly switch between frontend and backend metrics, traces, and logs - all within a single interface.
"Our biggest concern as our team grew was time to diagnose issues. APM's been a real game changer for us in terms of troubleshooting." - Paul Hinze, Director of Infrastructure, HashiCorp
Beyond tracing, Datadog also empowers teams with proactive monitoring to catch issues early.
AI-Powered Detection with Watchdog
Datadog’s Watchdog takes performance monitoring to the next level by automatically detecting latency spikes and other performance anomalies.
Powered by AI, Watchdog analyzes billions of data points to identify unusual patterns and summarize them into easy-to-understand "stories". This helps teams act quickly, often resolving issues before they impact users.
What sets Watchdog apart is its ability to catch subtle performance problems that traditional monitoring might miss. Whether it’s detecting latency spikes in microservices, spotting elevated error rates on specific endpoints, or flagging network issues in cloud zones, Watchdog ensures nothing slips through the cracks.
"Watchdog helps our teams focus on the signals that matter by surfacing events that typically aren't caught by traditional monitors. Looking at Watchdog every morning helps me gain a better understanding of everything happening across our entire technology stack." - Brent Montague, Site Reliability Architect, Cvent
Watchdog also excels at distinguishing internal issues from external ones. For example, it quickly identified a latency spike caused by a Mixpanel outage, saving teams from wasting time chasing the wrong problem. For SMBs that rely heavily on third-party APIs, this external monitoring is a game-changer, with automatic alerts flagging service degradations as they happen.
High Error Rates and Service Interruptions
When applications break, user trust takes a hit. For small and medium-sized businesses, spikes in error rates or unexpected service outages can lead to immediate setbacks - lost revenue, unhappy customers, and a tarnished reputation. Recent data shows that 89% of firms faced at least one unplanned outage in 2016. On average, IT downtime costs businesses about $9,000 per minute across industries. For smaller companies, these costs typically range from $137 to $427 per minute. The financial strain is undeniable, but the real challenge lies in identifying what went wrong and ensuring it doesn’t happen again. Whether caused by technical glitches, human errors, security breaches, or misconfigurations, high error rates and prolonged downtimes are costly in more ways than one.
Datadog steps in to simplify error detection and analysis, helping businesses tackle these challenges head-on.
Error Monitoring and Root Cause Analysis
Datadog's Error Tracking tool provides a centralized way to monitor errors across both frontend and backend systems. It groups similar errors automatically and links them to relevant logs and traces, making it easier for developers to spot patterns and fix issues quickly. By offering unminified stack traces with direct links to the source code, Datadog significantly reduces the time teams spend troubleshooting.
Another standout feature is Datadog's Watchdog RCA (Root Cause Analysis). This tool identifies relationships between symptoms across applications and infrastructure to pinpoint the root cause of problems. For instance, Watchdog RCA detected that a faulty deployment of the address-service caused a cascade of errors and latency issues over a six-hour period between February 15 and 16. It provided detailed error data and sample request traces, allowing for swift resolution. Additionally, Watchdog Impact Analysis highlights which services are underperforming and identifies the most affected areas, enabling teams to focus on what matters most.
Smart Alerting and Dashboards
Datadog’s alerting system, combined with customizable dashboards, ensures teams are notified immediately about potential issues while providing a clear overview of system health, error rates, and performance trends. These tools allow teams to quickly identify and address problems, minimizing downtime and disruptions.
Another key feature is Datadog's external monitoring capabilities. It can distinguish between internal system challenges and external issues, such as degraded performance from APIs or cloud providers. This saves teams from wasting time on problems outside their control. By offering a comprehensive approach to monitoring and alerting, Datadog helps businesses shift from reactive troubleshooting to proactive system management, ensuring stability and reducing resource strain.
Resource Bottlenecks and Infrastructure Problems
When resources like CPU, memory, or storage hit their limits, performance takes a nosedive, and costs can spiral out of control. For SMBs working with tight IT budgets, these resource bottlenecks not only drag down user experience but also waste money on underused or oversized systems.
The real challenge isn’t just about having enough resources - it’s about knowing where the bottlenecks are and making the most of what you already have. Many businesses struggle with limited visibility into their infrastructure, which makes it tough to catch issues before they impact users. At the same time, they may overspend on resources they don’t need, leaving critical systems underpowered.
Complete Infrastructure Monitoring
Datadog steps in to solve this problem by offering a clear, real-time view of your entire infrastructure. It collects metrics every 15 seconds, covering CPU, memory, disk, and network performance, so teams can catch bottlenecks early - before they snowball into bigger problems.
What makes Datadog stand out is its flexibility to work with virtually any setup. With integrations for Kubernetes, serverless platforms, and over 900 other technologies, it doesn’t matter if you’re running a hybrid cloud or containerized apps - you get a unified view of everything.
But Datadog doesn’t stop at just collecting metrics. It connects infrastructure data with traces, logs, processes, and events, giving teams a full picture of how resource issues affect application performance. For instance, if a database server’s CPU usage spikes, you can drill down to see which queries are causing it and how they’re affecting user requests. Customizable alerts, powered by machine learning, even predict potential problems, allowing teams to act before they escalate. This kind of insight not only helps fix issues faster but also opens the door to smarter resource allocation and cost savings.
Cost Reduction through Better Resource Management
Optimizing resources isn’t just about better performance - it’s also about cutting unnecessary costs. With detailed usage analytics and cost insights, Datadog helps SMBs pinpoint inefficiencies and reduce waste.
Take this example: A FinOps team used Datadog’s GPU Monitoring to find that 20% of their GPUs were sitting idle, while some container pods weren’t fully utilizing their cores. By consolidating workloads, they managed to significantly cut expenses.
Datadog offers practical tools to keep costs in check. Resource scheduling ensures monitoring aligns with actual usage patterns, avoiding needless overhead. Workloads can be consolidated onto fewer instances or containers, reducing the number of active hosts being monitored. For Kubernetes users, features like adjusting pod density or integrating with autoscalers like Karpenter help maintain the right number of resources - scaling up during busy periods and scaling down when demand drops.
The platform also helps reduce monitoring expenses. Teams can pre-aggregate high-frequency metrics, filter out low-value logs, and audit unused custom metrics to avoid unnecessary charges. Simplifying custom metrics by reducing high-cardinality tags can further lower costs. Additionally, Datadog’s integration with CloudNatix combines infrastructure data with cloud cost insights, enabling automated workflows that help optimize both resource usage and spending.
Datadog’s pricing is straightforward: Infrastructure Monitoring starts at $15 per host per month (billed annually), APM at $31 per host per month, and Log Management at $0.10 per GB ingested. For most SMBs, the savings from eliminating waste and optimizing resource usage far outweigh the costs of monitoring, making it a smart investment.
Poor Log Management and Troubleshooting
Modern applications churn out massive amounts of logs across various components - servers, APIs, and more. For SMBs, this flood of data can be overwhelming, especially when time and resources are limited. When users encounter slow response times or error messages, teams often scramble to diagnose the root cause, wasting hours sifting through scattered logs. This delay in resolving issues not only frustrates users but also drives up operational costs.
Storing logs in traditional formats, like text files or basic databases, compounds the problem. These methods make it harder to search and correlate logs, especially in distributed systems. For example, a single user request in a microservices architecture might interact with several services, each logging data in different formats and locations.
Log Collection and Search Features
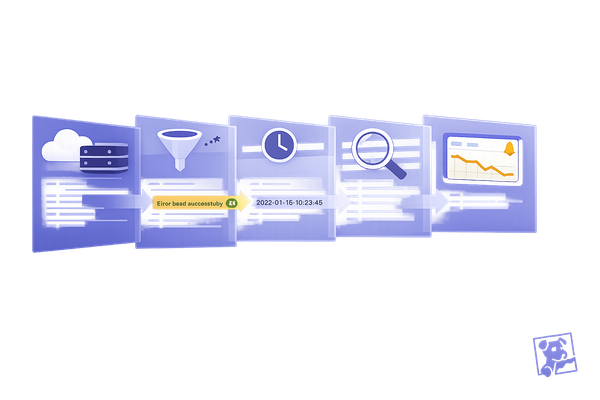
Datadog simplifies the chaos of log management by automating the collection of logs from your entire infrastructure. Whether your applications run on AWS, Azure, Google Cloud, or on-premises servers, Datadog processes log data in real time. This provides the visibility needed to catch performance issues before they escalate. The platform doesn’t just collect logs - it enriches and indexes them, making it easy to search by attributes like timestamps, error codes, or user IDs.
The search functionality is powerful yet efficient. You can filter logs by time, service, error level, or custom attributes, and get results quickly - even from millions of entries. This streamlined organization directly links logs with performance data, allowing for faster identification and resolution of issues.
Connected Log and APM Workflows
Datadog takes log management a step further by integrating it with Application Performance Monitoring (APM), creating a unified system for troubleshooting. This connection bridges the gap between different types of monitoring data, speeding up the resolution process.
With this integrated approach, you can get a complete picture of what’s happening during a specific transaction or user request. For instance, if APM highlights latency in your checkout service, you can immediately pull up related error logs, database queries, and infrastructure metrics from the same timeframe - no need for manual data gathering.
Datadog’s distributed tracing capabilities complement log data, showing the full journey of user requests across microservices. Plus, the platform’s automatic service discovery ensures that new services are seamlessly incorporated into the system, so their logs are instantly available.
The pricing structure supports this comprehensive model. Datadog’s APM starts at $31 per host per month, while log management pricing includes ingestion at $0.10 per GB and indexing from $1.06 per million log events monthly (billed annually). For SMBs, the time saved through faster troubleshooting and issue resolution often makes these costs worthwhile.
With around 28,700 customers, including 3,390 spending over $100,000 annually on Datadog services, the benefits of connected log and APM workflows are clear. This unified approach not only accelerates troubleshooting but also improves overall system visibility, helping SMBs scale with confidence.
Complete Observability for SMBs
Small and medium-sized businesses (SMBs) often need enterprise-level visibility but lack the resources to juggle multiple monitoring tools. Datadog solves this challenge by offering complete observability through a single platform that integrates metrics, logs, and traces. By unifying insights on performance, errors, and resource usage, Datadog provides SMBs with a comprehensive monitoring solution.
With this approach, SMBs can track everything from server health to user experience - all from one dashboard. No more switching between tools for infrastructure monitoring, application performance, and log analysis. Datadog brings all of this together, building on its existing solutions that address latency, errors, and resource management.
Simplified Operations with Combined Dashboards
Datadog’s platform makes operations easier by offering prebuilt dashboards and Watchdog AI, which continuously scans for anomalies and alerts teams before issues affect users.
With over 850 integrations, setup and maintenance are streamlined, allowing SMBs to spend less time managing tools and more time focusing on their products. This efficiency is especially valuable for smaller teams with limited resources.
The Bits AI assistant further enhances usability by helping teams quickly understand alerts and troubleshoot problems. For SMBs without dedicated DevOps personnel, this feature can be a game-changer.
| Feature | Datadog |
|---|---|
| Platform Coverage | Unified monitoring for infrastructure, APM, logs, and security |
| Cloud-Native Support | Kubernetes, serverless, multi-cloud |
| Integrations | 850+ |
| AI & Automation | Watchdog AI, Bits AI assistant |
| Pricing | Modular, pay-as-you-go options |
Growth Support for Expanding SMBs
As SMBs grow, their monitoring needs often become more complex. Datadog is built to scale alongside businesses, handling everything from simple web apps to intricate microservices architectures. Its cloud-native support covers Kubernetes clusters, serverless environments, and multi-cloud setups, ensuring businesses can adapt to increasing demands.
Take Peloton, for example. Using Datadog’s APM, they identified five problematic endpoints and reduced response times by up to 90%. This level of optimization is crucial for businesses managing higher user loads and transaction volumes.
Datadog’s modular pricing model is another advantage. SMBs can start small, paying only for what they need, and add features as they grow. This flexibility eliminates the risk of outgrowing a monitoring solution or paying for unnecessary features.
Being named a Leader in the Gartner Magic Quadrant™ for Observability Platforms adds credibility, assuring SMBs that Datadog is a forward-thinking solution that evolves with industry trends. This scalability and flexibility keep SMBs agile as they expand.
For SMBs wanting to maximize their Datadog experience, resources like Scaling with Datadog for SMBs provide expert advice and actionable tips tailored to the unique challenges of smaller businesses.
Conclusion
Application performance problems can seriously impact small and medium-sized businesses (SMBs). Issues like slow response times, frequent errors, resource limitations, and poor log management can harm customer satisfaction and stall business growth. Datadog steps in to tackle these challenges with a unified platform that offers real-time monitoring, AI-driven detection, and full observability, helping SMBs streamline performance without hassle.
With Datadog, operations are simplified through features like real-time monitoring and intelligent alerting. Its flexible, usage-based pricing allows SMBs to start small and scale up as needed, making it easier to minimize downtime and improve operational efficiency in a competitive market.
For SMBs aiming to optimize application performance, Datadog offers tools to minimize disruptions, improve user experience, and run more efficiently. Its combination of proactive monitoring, smart alerts, and unified observability creates a strong foundation for growth in today’s digital-first world.
If you're looking for more expert advice and practical tips designed specifically for SMBs, check out resources like Scaling with Datadog for SMBs for tailored strategies and best practices.
FAQs
How does Datadog's AI-powered Watchdog help identify performance issues that traditional monitoring tools might overlook?
Datadog's Watchdog leverages advanced machine learning to sift through massive amounts of data from your systems automatically. It identifies unusual patterns, anomalies, and potential root causes - all without needing manual setup or fixed thresholds.
This hands-off yet highly effective approach ensures that even minor performance issues, which traditional tools might overlook, are caught early. With real-time, actionable insights, Watchdog enables quicker problem resolution, helping you keep your applications running smoothly.
How does integrating Datadog's log management with APM benefit small and medium-sized businesses?
Integrating Datadog's log management with its Application Performance Monitoring (APM) offers SMBs a comprehensive way to monitor and manage their systems. By linking logs, metrics, and traces, teams can pinpoint and resolve issues faster, minimizing downtime and boosting system reliability.
This setup also promotes teamwork by delivering shared insights that everyone can act on. SMBs gain a clearer picture of application performance, can analyze user behavior, and fine-tune their systems to align with business objectives - all within a single platform. This unified approach simplifies operations and supports growth as your business expands.
How does Datadog's pricing model help small and medium-sized businesses grow while keeping costs under control?
Datadog’s pricing approach is tailored to help small and medium-sized businesses (SMBs) manage costs effectively. By offering usage-based pricing, you’re only charged for what you actually use, making it easier to scale your monitoring needs without breaking the bank.
The platform’s tiered structure lets businesses adjust their service levels as their requirements grow or shift. Plus, Datadog includes tools to help track and manage expenses, giving SMBs the ability to stay within their budgets while expanding their infrastructure smoothly.

