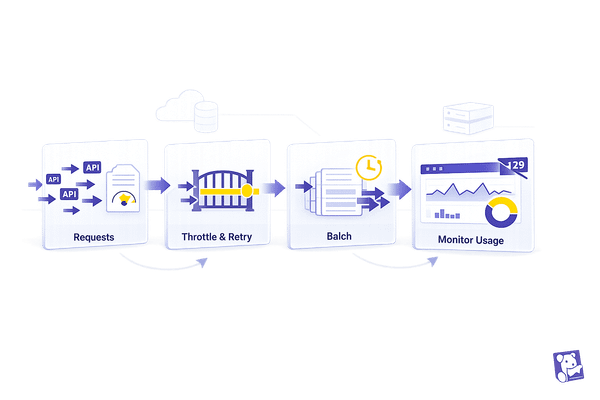
Ultimate Guide to API Rate Limiting for Datadog
Read Datadog rate-limit headers, implement retries and throttling, batch requests, and monitor usage to avoid 429 errors.

Read Datadog rate-limit headers, implement retries and throttling, batch requests, and monitor usage to avoid 429 errors.
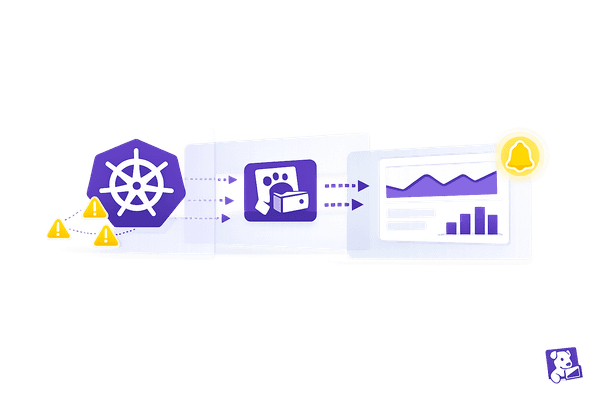
Extend Kubernetes event history with Datadog, collect warning events via the Agent, and turn them into dashboards and alerts.
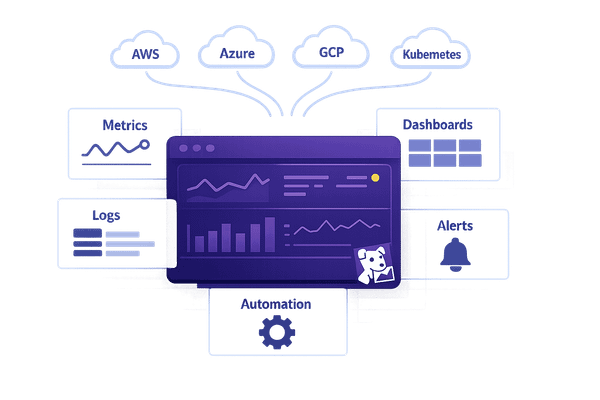
How to connect Datadog to AWS, Azure, GCP, and Kubernetes; configure metrics, logs, dashboards, alerts, and automation.
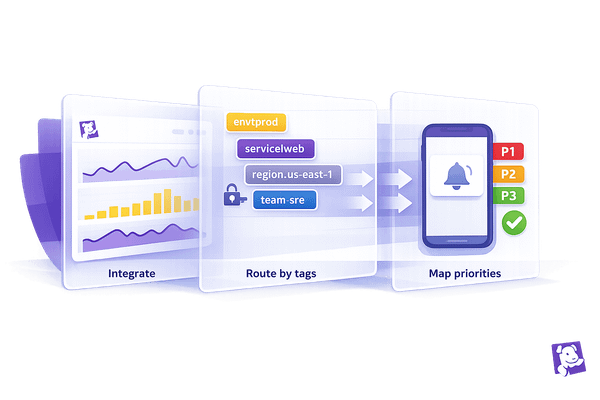
Setup and optimize Datadog–PagerDuty integration: secure keys, map priorities, route alerts via tags, test flows, and reduce alert fatigue.
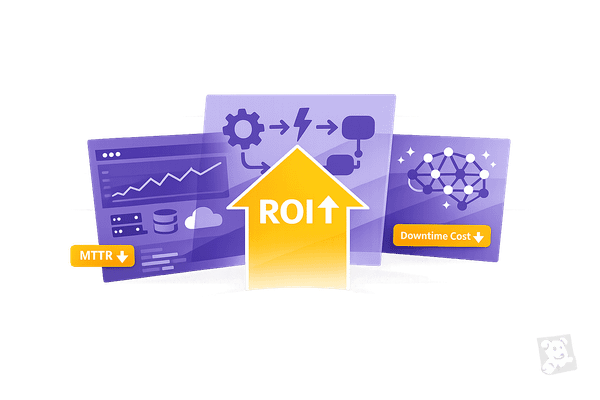
Cut MTTR, reduce downtime costs, and prove incident-resolution ROI with unified monitoring, automation, and AI.
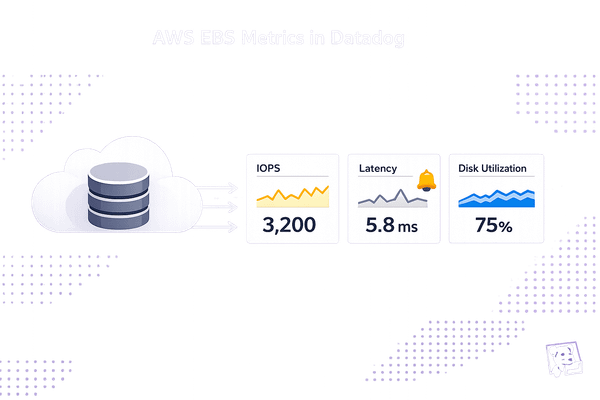
Monitor AWS EBS performance in Datadog: key metrics, setup steps, alerts, and dashboard tips to optimize IOPS, latency, and disk utilization.
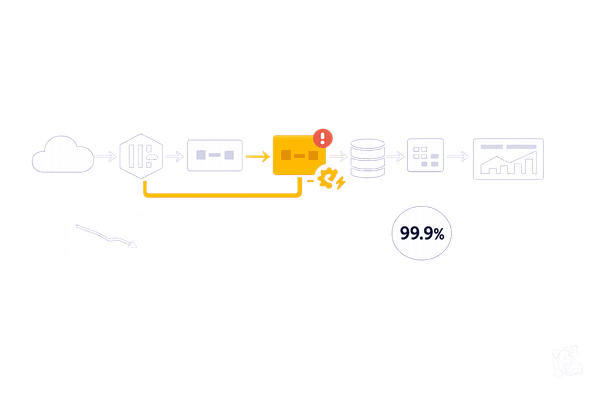
Map service relationships, detect bottlenecks, and automate fixes to improve performance, reliability, and reduce MTTR.
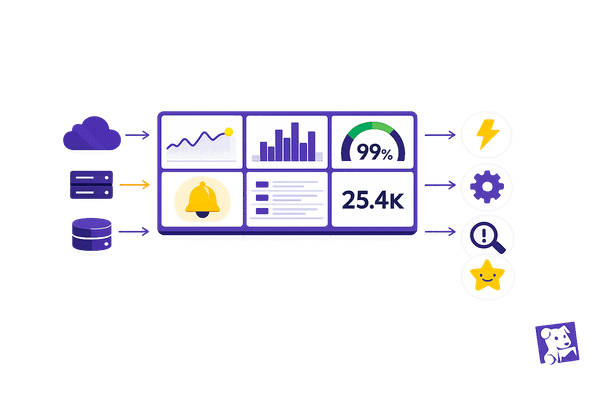
How SMBs use real-time dashboards to speed decisions, reduce manual work, detect issues early, and improve customer experience.
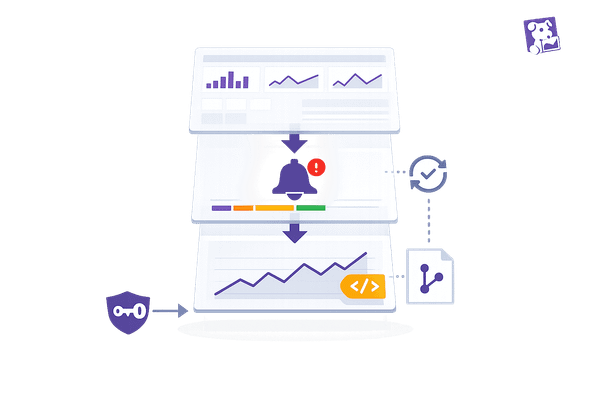
Automate Datadog dashboards, monitors, and custom metrics with secure API keys, retry handling, and version-controlled configs.
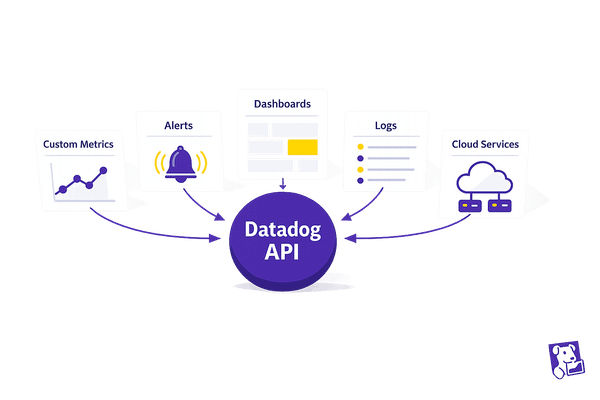
Use the Datadog API to automate monitoring: submit custom metrics, manage alerts and dashboards, query logs, and connect cloud services.
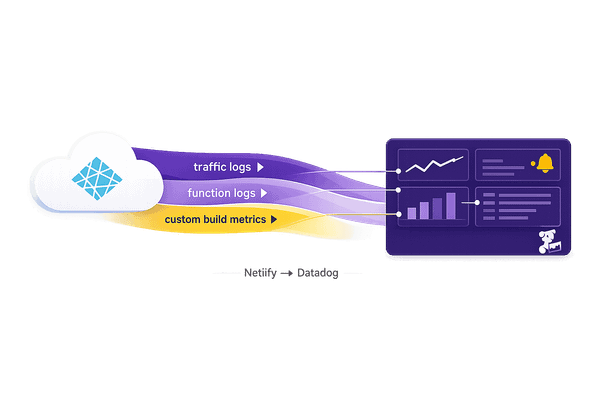
Forward Netlify traffic and function logs to Datadog, push custom build metrics, and build dashboards and alerts for long-term monitoring.
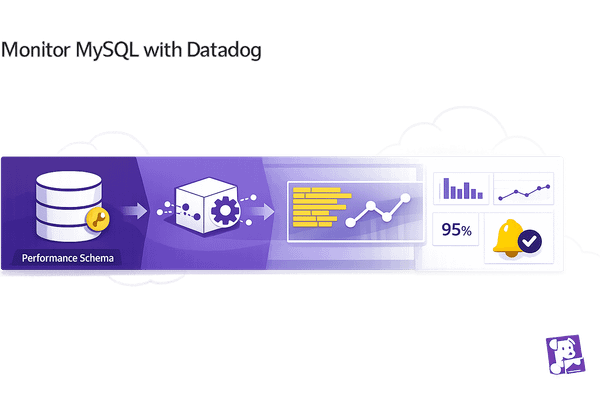
Guide to monitor MySQL with Datadog: create a monitoring user, enable Performance Schema, install the Agent, collect logs, configure alerts and build dashboards.