Ultimate Guide to AWS EBS Metrics in Datadog
Monitor AWS EBS performance in Datadog: key metrics, setup steps, alerts, and dashboard tips to optimize IOPS, latency, and disk utilization.
Managing AWS Elastic Block Store (EBS) volumes is critical for scaling with Datadog to optimize application performance and cost control. Without proper monitoring, issues like running out of storage, hitting IOPS limits, or overpaying for underutilized resources can disrupt your systems. Datadog bridges the gaps left by AWS CloudWatch by offering deeper insights and faster metric collection. Here's what you need to know:
Key Takeaways:
- EBS Basics: EBS provides persistent storage for EC2 instances. Volume types include SSDs (gp2, gp3, io1, io2) and HDDs (st1, sc1), each suited for specific workloads.
- Why Monitoring Matters: Track storage space, IOPS, throughput, and latency to avoid app crashes, slowdowns, or overspending.
- Datadog Advantages: Datadog collects system-level metrics (e.g., disk space usage) not available in CloudWatch and provides updates as frequently as every second.
Core Metrics to Watch:
- I/O Performance: Monitor
VolumeReadOpsandVolumeWriteOpsto track IOPS usage and avoid hitting limits. - Throughput: Use
VolumeReadBytesandVolumeWriteBytesto measure data transfer rates. - Latency: Keep an eye on
VolumeTotalReadTimeandVolumeTotalWriteTimeto spot delays. - Queue Length: High
VolumeQueueLengthindicates bottlenecks in processing I/O requests. - Disk Space: Use Datadog’s
system.disk.in_useandsystem.disk.freemetrics to prevent storage exhaustion.
Getting Started:
- Set Up AWS Integration: Create an IAM role with permissions for CloudWatch and EC2 metrics. Use Datadog’s CloudFormation QuickStart for easy setup.
- Install the Datadog Agent: Gain visibility into system-level metrics unavailable in CloudWatch.
- Verify Metrics: Check Datadog’s Metrics Explorer for
aws.ebs.*andsystem.disk.*data.
Optimizing EBS Performance:
- Match volume type to workload (e.g., gp2 for general use, io1 for high IOPS).
- Monitor instance EBS bandwidth to avoid network-related throttling.
- Set alerts for key thresholds like low burst balance or high queue length.
Datadog’s unified dashboard combines EBS and EC2 metrics, helping you pinpoint bottlenecks and optimize resource usage. By actively monitoring these metrics, you can improve application reliability and control costs effectively.
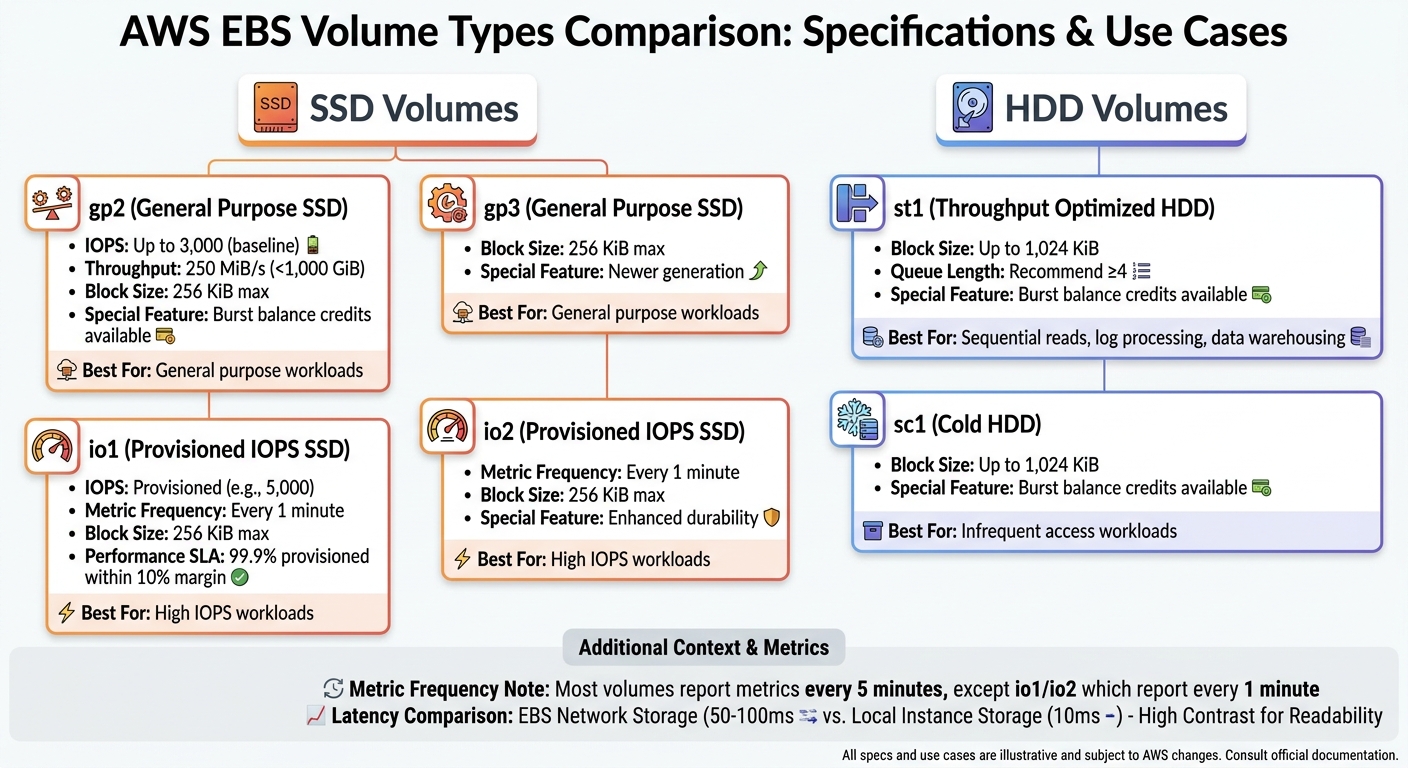
AWS EBS Volume Types Comparison: Performance Specs and Use Cases
How to use DataDog to find utilisation of AWS EBS volume | Datadog | AWS learning | Datadog tutorial
sbb-itb-bc9f286
Setting Up AWS EBS Monitoring in Datadog
To get started with monitoring Amazon EBS volumes in Datadog, you'll need to connect your AWS account and decide how to bring EBS metrics into the platform. Using Datadog's automated CloudFormation setup simplifies this process, giving you access to hypervisor-level metrics from CloudWatch (like IOPS and throughput) and system-level metrics from the Datadog Agent (like disk space usage).
Prerequisites for AWS Integration
Before diving into EBS monitoring, you’ll need to create an IAM role in AWS that grants Datadog the necessary permissions to access CloudWatch data. This role must allow actions like reading CloudWatch metrics, describing EBS volumes, and retrieving resource tags. Key permissions include:
| Permission Category | Required Actions | Purpose |
|---|---|---|
| CloudWatch | cloudwatch:Describe*, cloudwatch:Get*, cloudwatch:List* |
Accesses EBS performance data (IOPS, throughput, latency) |
| EC2 | ec2:DescribeVolumes, ec2:DescribeInstances, ec2:DescribeStatus |
Identifies volume details, attachments, and health |
| Tagging | tag:GetResources, tag:GetTagKeys, tag:GetTagValues |
Enables filtering and grouping metrics by AWS tags |
| Account Info | iam:ListAccountAliases, account:GetAccountInformation |
Displays AWS account details in Datadog |
To ensure security, the IAM role must include a trust relationship allowing Datadog's AWS account (464622532012) to assume it. A unique External ID (provided by Datadog during setup) prevents unauthorized access, addressing the "confused deputy" issue.
The quickest way to set up this role is by using Datadog's CloudFormation "QuickStart" stack. This tool automatically creates the role with all required permissions, saving time and reducing errors. For additional volume metadata, attach the AWS-managed SecurityAudit policy to the role. Once the IAM role is ready, you can move on to configuring the AWS integration in Datadog.
Configuring AWS Integration in Datadog
With the IAM role in place, head to the Datadog AWS integration page and choose your setup method. CloudFormation is the go-to option for most users because it handles the technical details automatically. Alternatively, you can use Terraform, AWS Control Tower, or configure the role manually in the AWS Console.
Datadog provides two methods for collecting EBS metrics: Metric Polling and Metric Streams.
- Metric Polling is the default option, where Datadog queries the CloudWatch API roughly every 10 minutes. This results in a slight delay before new metrics appear.
- Metric Streams with Amazon Data Firehose offers faster updates, reducing latency to 2–3 minutes.
Keep in mind that CloudWatch collects EBS metrics at different intervals depending on the volume type. Most volumes report metrics every 5 minutes, but io1 and io2 volumes update every minute.
"Because CloudWatch collects metrics via a hypervisor, it does not report internal, system-level metrics such as disk usage on your volumes." - Maxim Brown, Datadog
To close the gap between hypervisor and system-level metrics, install the Datadog Agent on your EC2 instances. This agent captures critical data like system.disk.in_use and system.disk.free directly from the operating system. After configuration, verify that metrics are being collected in Datadog.
Verifying Metric Collection
Navigate to Metrics > Explorer in Datadog and search for aws.ebs.* to ensure CloudWatch data is being received. Metrics like aws.ebs.volume_read_ops, aws.ebs.volume_write_ops, and aws.ebs.volume_queue_length should appear. To confirm the Datadog Agent is installed, search for system.disk.*.
If metrics are missing, check the Issues tab on the Datadog AWS Integration page. Common problems include missing permissions (like ec2:DescribeVolumes) or incorrect External IDs in the IAM trust relationship.
Once Datadog detects incoming data, it automatically installs default dashboards, giving you a visual overview of your EBS performance. You can also create custom dashboards to monitor metrics tailored to your applications. Keep in mind that EBS metrics are specific to AWS regions. If your volumes span multiple regions (e.g., us-east-1 and us-west-2), ensure the integration covers all relevant regions.
Key AWS EBS Metrics to Monitor
When your EBS volumes are connected to Datadog, you'll notice a flood of metrics arriving. To stay ahead of potential issues, focus on a handful of critical metrics that can help you identify and address problems before they affect your users.
I/O Operations and Throughput Metrics
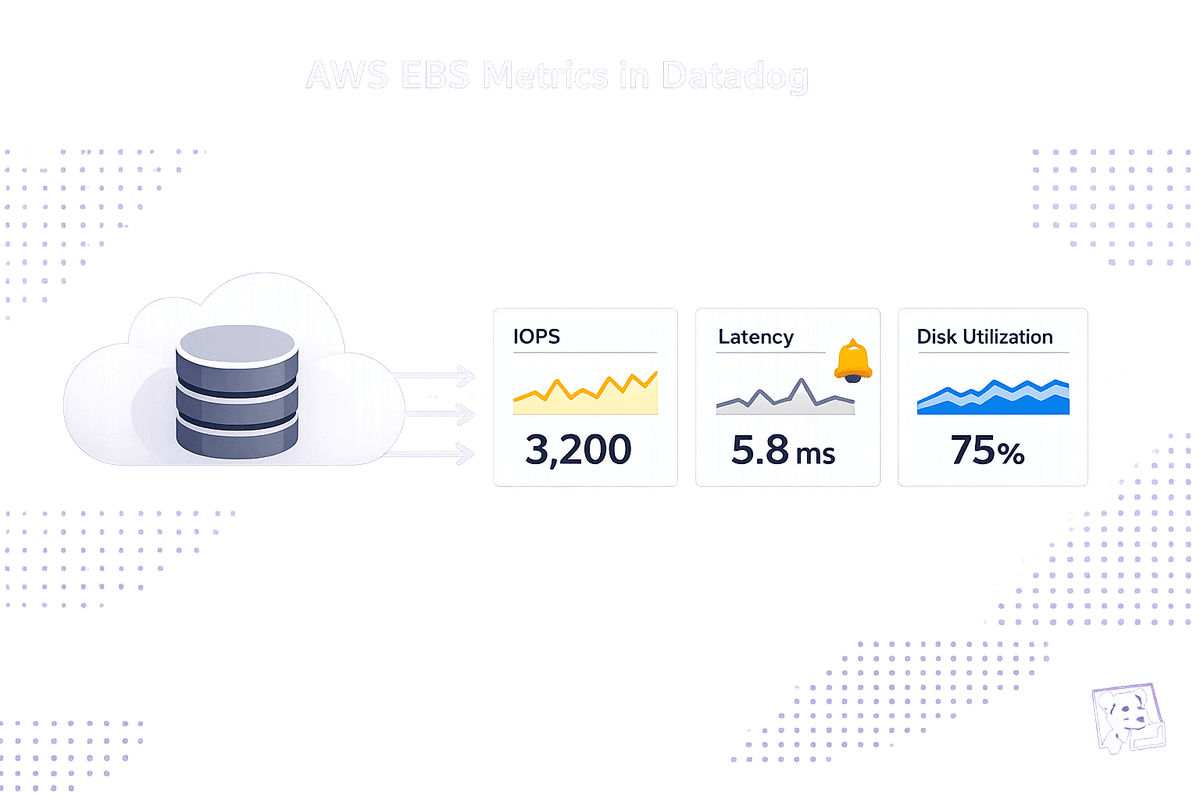
Metrics like VolumeReadOps and VolumeWriteOps track the total number of I/O operations completed by your volume. By dividing these values by the reporting interval (usually 5 minutes, or 1 minute for io1/io2), you can calculate the IOPS (Input/Output Operations Per Second). This is key to understanding if you're nearing the performance limits of your volume type. For instance, a General Purpose SSD (gp2) volume may be configured for 3,000 IOPS. If you're consistently hitting 2,800 IOPS, you're operating close to its capacity.
Similarly, VolumeReadBytes and VolumeWriteBytes measure the amount of data being read or written. Converting these to MiB/s gives you a clear picture of throughput. Keep in mind that a gp2 volume under 1,000 GiB is capped at 250 MiB/s. Using a 256 KiB block size, this limit is reached at just 1,000 IOPS, even if the volume supports higher IOPS. This can create a bottleneck that might catch you off guard.
Block size also matters. SSD volumes limit I/O blocks to 256 KiB, while HDD volumes can handle up to 1,024 KiB. For workloads like sequential reads (e.g., log processing or data warehousing), if VolumeReadBytes shows average I/O sizes larger than 256 KiB, switching to a Throughput Optimized HDD (st1) might offer better performance for the cost.
These metrics are the foundation for identifying performance delays, which are further explored through latency metrics.
Latency Metrics
VolumeTotalReadTime and VolumeTotalWriteTime measure the time it takes to complete I/O operations from start to finish. By dividing these by the total number of operations, you can calculate the average latency per request. High latency often signals that your volume has hit its IOPS or throughput limits. For perspective, EBS network storage typically has a latency of 50–100 ms, while local instance storage averages around 10 ms.
Another important metric is VolumeQueueLength, which shows the number of I/O requests waiting to be processed. For SSDs, aim for a queue length of one for every 1,000 IOPS. For example, if you've provisioned 5,000 IOPS, a queue length consistently above 5 indicates you're pushing the volume too hard. HDDs, on the other hand, benefit from higher queue lengths (at least 4) to optimize sequential I/O performance.
Provisioned IOPS (io1) volumes are designed to meet 99.9% of their provisioned performance within a 10% margin. If you're experiencing latency spikes on io1 volumes, check whether your EC2 instance's EBS bandwidth is the limiting factor. For example, an r4.large instance has a maximum EBS bandwidth of 425 Mbps. Even if your volumes can theoretically handle more, they won’t exceed the instance's limit.
Beyond latency, keeping an eye on disk utilization and storage balance is just as important.
Disk Space and Utilization Metrics
For gp2, st1, and sc1 volumes, BurstBalance is a key metric. It reflects the percentage of remaining I/O or throughput credits. When this drops to 0%, your volume throttles to baseline performance, which can slow down applications. Set alerts for when BurstBalance falls below 20% to give yourself time to investigate or scale up before throttling occurs.
"Ideally your volumes should always be doing something. Monitor [VolumeIdleTime] to identify any volumes that spend time inactive, leaving provisioned resources unused." - Maxim Brown, Datadog
VolumeIdleTime tracks how many seconds in a reporting period your volume was inactive. High idle time could mean over-provisioned volumes wasting money or, in some cases, application-level issues preventing requests from reaching the disk. Use this metric to spot underutilized resources or uncover deeper problems.
While CloudWatch doesn’t provide actual disk space usage, the Datadog Agent can fill this gap. Install it on your EC2 instances to monitor system.disk.in_use and system.disk.free. Running out of disk space can cause "No space left on device" errors, potentially crashing applications. With Datadog's anomaly detection, you can predict when a volume will hit full capacity based on current growth, giving you time to expand storage proactively.
Advanced Monitoring and Optimization Techniques
Once you've mastered the core EBS metrics, diving into advanced monitoring methods can help uncover root causes and fine-tune performance.
Correlating EBS Data with EC2 Metrics
EBS volumes are tightly linked to EC2 instances. Since EBS is network-attached storage, its performance depends heavily on the network capacity of your EC2 instance. If your instance isn't EBS-optimized, other network activities - like handling web traffic - can slow down disk performance.
"Disk performance is thus tightly linked to network performance and throughput. Some EC2 instance types do not separate EBS bandwidth from general network activity."
– Maxim Brown, Datadog
Check your instance's maximum EBS bandwidth. Even if your volume can handle higher throughput, instance limits will cap performance. For example, an r4.large instance maxes out at 425 Mbps. To identify bottlenecks, use Datadog's Metrics Explorer to plot aws.ebs.volume_queue_length alongside aws.ec2.cpuutilization or aws.ec2.network_in/out. This helps determine if disk slowness stems from high CPU wait times or network congestion.
For Nitro-based instances, AWS provides metrics like InstanceEBSIOPSExceededCheck and InstanceEBSThroughputExceededCheck under the AWS/EC2 namespace. These metrics can reveal if your application is exceeding the instance's EBS limits.
Use these insights to build targeted dashboards for real-time monitoring.
Creating Datadog Dashboards for EBS Insights
Combining EBS and EC2 metrics can give you a complete view of your system's performance. Since CloudWatch reports total operations over a time period, you can use Datadog's metric math to calculate per-second IOPS or throughput. For example, divide VolumeReadOps by 300 to get per-second values.
While CloudWatch provides data with 1- to 5-minute granularity, installing the Datadog Agent on your EC2 instances gives you 15-second resolution. This also lets you collect system-level metrics like system.disk.in_use, which CloudWatch doesn't track. Adding percentile aggregations (such as p95 or p99) to your dashboards can highlight worst-case scenarios and performance outliers.
For queue length monitoring, aim for one pending operation per 1,000 IOPS on SSD volumes. For HDD volumes processing 1 MiB sequential operations, set a baseline of at least four pending operations. Tagging dashboards with VolumeId, InstanceId, or custom application tags can further pinpoint performance issues to specific clusters.
Setting Up Alerts and Anomaly Detection
Proactive alerts can help you address potential issues before they escalate. For example, monitor aws.ebs.volume_queue_length to detect sustained high values that suggest throughput limits are being hit. For Provisioned IOPS volumes, a good threshold is one pending operation per 1,000 IOPS.
"A sustained increase of VolumeQueueLength way above 1 on a standard EBS volume should be treated as exhausting the throughput of that EBS volume."
– Alexis Lê-Quôc, Datadog
You should also set alerts for aws.ebs.burst_balance to notify your team when a volume's burst balance falls below 20%. This gives you time to upgrade capacity or switch to io1/io2 volumes before throttling occurs. Additionally, monitor aws.ebs.volume_status for state changes to "impaired", which signals that AWS has disabled I/O to prevent data corruption and requires immediate action.
Datadog's Watchdog feature offers AI-driven anomaly detection for EBS metrics. It automatically highlights "Insights" and "Impact Analysis" to identify storage bottlenecks causing application latency. If an EBS alert triggers, cross-check your EC2 instance's network throughput. If the instance is at its bandwidth limit, the EBS volume may be throttled, even if it hasn't reached its own limits. Integrate Watchdog with your alerts for continuous monitoring and smarter anomaly detection.
Conclusion
Keeping a close eye on AWS EBS through Datadog helps uncover performance issues, manage costs effectively, and scale resources efficiently. By observing key metrics like I/O operations, latency, and disk utilization, you can catch potential problems before they disrupt your applications. The Datadog Agent offers 15-second resolution for system-level metrics such as system.disk.in_use, providing visibility that goes beyond what CloudWatch can detect through the hypervisor.
The numbers highlight the importance of this approach: 94% of enterprises overspend in the cloud, often due to insufficient insight into resource usage. Even more concerning, 9 out of 10 enterprises fail to track disk utilization, a critical metric for controlling storage costs.
"Choosing and configuring the right EBS volumes significantly boosts performance and lowers AWS costs."
– Maxim Brown, Datadog
Using Datadog, you can optimize volume sizes, spot underused resources, and connect EBS and EC2 metrics to avoid costly missteps. For example, installing the Datadog Agent on EC2 instances allows you to capture system.disk.in_use metrics, set alerts for when BurstBalance drops below 20%, and monitor VolumeQueueLength to prevent throughput limitations. Building dashboards that integrate EBS and EC2 data offers a complete view of your infrastructure's performance.
FAQs
What alert thresholds should I use for BurstBalance and VolumeQueueLength?
There aren't fixed thresholds for BurstBalance and VolumeQueueLength because these metrics vary based on your specific environment. However, a common approach is to set alerts if BurstBalance drops below 20-30% or if VolumeQueueLength grows to levels that suggest I/O bottlenecks. To establish meaningful thresholds, review the typical performance patterns of your workload. For more detailed recommendations, refer to AWS documentation or use performance baselines as a reference.
How do I tell if slow EBS is the volume limit or the EC2 instance bandwidth limit?
To figure out why your EBS performance might be lagging, you’ll need to keep an eye on a few key CloudWatch metrics. Start by looking at metrics for your EBS volume, such as IOPS, throughput, and latency. These can help you spot if the volume is hitting its limits.
Next, shift your focus to the EC2 instance’s network metrics - things like throughput and packets. These will reveal if bandwidth saturation is the culprit.
Here’s the breakdown:
- If you notice high latency or IOPS saturation, it’s likely an issue with the EBS volume itself.
- On the other hand, if the EBS metrics look fine but the network metrics show signs of saturation, your EC2 instance might be running into bandwidth constraints.
By pinpointing which metrics are out of line, you’ll have a clearer idea of where the problem lies.
Why do my EBS metrics show up late in Datadog, and how can I speed them up?
EBS metrics in Datadog might show up later than expected due to delays in AWS CloudWatch's data collection and API response times. Here's how it works: CloudWatch gathers data at intervals - usually every 10 minutes. While some metrics offer 1-minute granularity, delays of 10 to 12 minutes are fairly common.
If you're looking to reduce this delay, make sure your CloudWatch metrics are set to use 1-minute granularity. However, keep in mind that Datadog’s AWS integration comes with a default polling interval of 10 minutes, and this setting cannot be changed.