Ultimate Guide To Incident Resolution ROI With Datadog
Cut MTTR, reduce downtime costs, and prove incident-resolution ROI with unified monitoring, automation, and AI.
When incidents disrupt your business, every second counts - and costs. For SMBs scaling with Datadog, downtime not only drains revenue but also erodes customer trust and team morale. Datadog offers a centralized, AI-powered platform to help SMBs reduce Mean Time to Resolution (MTTR), cut costs, and improve efficiency.
Key Takeaways:
- Incident Costs: Downtime can cost SMBs up to $5,000 per minute, with additional losses from SLA penalties and customer churn.
- Challenges: Small IT teams often face tool sprawl and manual processes, delaying response times.
- Datadog’s Solution: Unified dashboards, automated workflows, and AI tools like Bits AI streamline incident management and root cause analysis.
- ROI Example: An SMB saving 18 minutes per incident at $5,000/minute could save $3.2M annually, with up to 5,955% ROI.
By consolidating monitoring, logs, and alerts, Datadog empowers SMBs to respond faster, reduce costs, and focus on what matters most - their customers and growth.
Incident Management I Datadog Essentials
sbb-itb-bc9f286
The Financial Impact of Incidents on SMBs
Datadog's ability to minimize downtime takes on a new level of importance when you consider the financial consequences of incidents. These costs go far beyond the immediate disruption. For small businesses, every minute of downtime can cost between $137 and $427, while mid-sized companies might face losses ranging from $1,000 to $5,000 per minute. These numbers only scratch the surface, as the full impact also includes lost revenue, redirected engineering resources, and diminished customer confidence.
Relying on manual processes for incident response adds another layer of waste. Tasks like manual post-mortems consume valuable engineering hours. For instance, handling 18 incidents per month can rack up over $35,000 annually in engineering time - time that could otherwise be spent driving growth. Considering that a Site Reliability Engineer (SRE) typically costs about $110 per hour, the financial drain becomes even clearer.
The damage to reputation is just as critical. A staggering 90% of IT leaders acknowledge that outages harm customer trust, yet 69% say their boards still don't invest enough in safeguarding that trust. The problem is only growing, with customer-impacting incidents increasing by 43% over the past year. For SMBs, where every customer counts, this can be a game-changer.
Metrics for Calculating Incident Costs
Tracking the right metrics is essential to understanding the true cost of incidents. Two key metrics to monitor are:
- Mean Time to Detect (MTTD): How quickly your team identifies an issue.
- Mean Time to Resolution (MTTR): The total time it takes to fully resolve an incident.
Together, these metrics help pinpoint where costs pile up during outages.
To estimate the cost of a single incident, use this formula: Multiply the number of engineers involved by their hourly rate, then multiply by the duration of the incident in hours. For example, if three engineers earning $110 per hour each spend four hours resolving an issue, the labor cost alone is $1,320. For SaaS businesses, you can add revenue losses using this formula: (Annual Revenue ÷ 8,760 hours) × percentage of customers affected. If your company makes $1.2 million annually and an incident affects 25% of your customers for two hours, that’s an additional $68 in lost revenue - before factoring in churn. These calculations provide a baseline for evaluating how Datadog can help reduce overall costs.
Establishing Your Baseline for ROI Measurement
Before implementing Datadog, it’s critical to calculate your current incident costs. This baseline will serve as a benchmark for measuring improvement. Start by documenting the frequency of outages over the past few months, the average MTTR for each type of incident, and the number of engineers typically involved in resolving them. Don’t forget to include the "coordination tax" - the time spent in the first 10 to 15 minutes setting up communication channels, identifying on-call staff, and launching dashboards.
You should also track the "documentation tax", which refers to the time engineers spend piecing together incident timelines from chat logs and other records for post-mortems. Without a clear starting point, proving the ROI of any new tool or process becomes nearly impossible. A simple spreadsheet that logs incident dates, durations, the number of engineers involved, customer impact percentages, and estimated total costs will make your ROI calculations much more persuasive when justifying your investment in Datadog. This groundwork lays the foundation for using Datadog to optimize incident resolution and maximize your ROI.
Datadog Features That Improve Incident Resolution ROI
Datadog's platform offers a variety of tools designed to reduce Mean Time to Resolution (MTTR) and cut down on incident resolution costs. These features work together seamlessly, creating an efficient response process that integrates smoothly into your workflows.
Incident Management and Team Collaboration
Datadog simplifies incident management by streamlining response processes. Automated notification rules ensure the right people are alerted immediately through Slack, email, PagerDuty, or Opsgenie, based on factors like incident severity or affected services. Plus, the Slack mirroring feature keeps conversations synced to the incident timeline, so teams don’t waste time switching between apps.
With Bits AI, collaboration gets even better. It generates real-time summaries of incidents and automatically drafts updates for stakeholders. It also flags related incidents declared within 20 minutes of each other, helping teams avoid redundant investigations. The incident timeline serves as a centralized record, capturing actions, updates, and related Jira tickets.
"An effective incident management plan depends on accessible, integrated tools as well as direct channels of communication." – Datadog
Need to declare an incident? You can do it with a single click, whether from a dashboard graph, alert, or the mobile app. This minimizes delays between detection and triage. The mobile app also enables on-the-go troubleshooting, ensuring teams can respond quickly, no matter where they are.
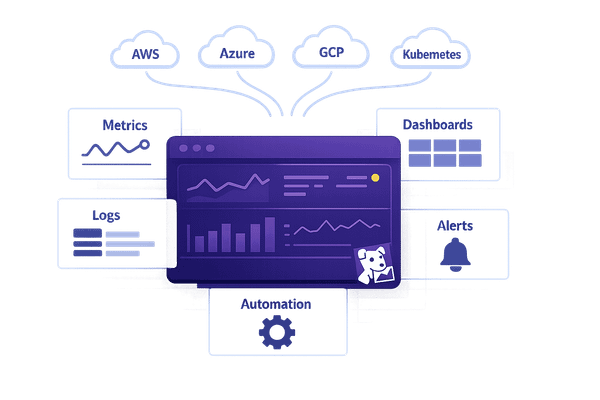
Monitoring with Dashboards and Alerts
Datadog’s dashboards act as a central hub for spotting and diagnosing issues early. By pinning interactive graphs to incident timelines, responders get instant context, combining telemetry data with event details. The Service Map offers a real-time view of data flows and dependencies, making it easier to zero in on the root cause of failures.
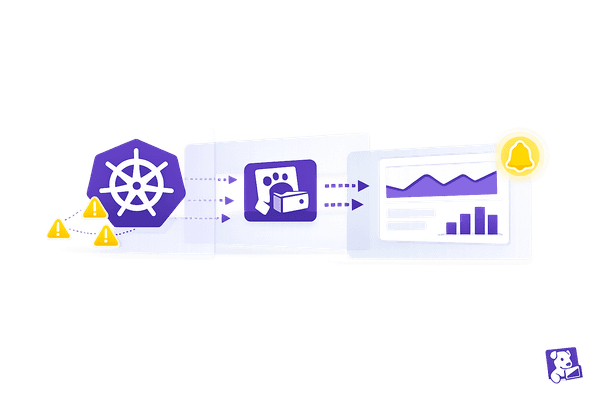
Watchdog, Datadog’s AI-powered monitoring tool, takes a proactive approach by identifying faulty deployments, anomalies, and cloud or SaaS API issues before they escalate. This shift from reactive to preventive monitoring helps teams avoid costly outages and improves overall efficiency.
The Incident Analytics Dashboard provides insight into MTTR trends and service reliability over time, helping teams identify which services are most disruptive. Additionally, customizable alert templates save engineers valuable time during high-pressure moments by automating communication tasks.
Log Management for Faster Troubleshooting
Datadog’s Log Management centralizes log data from across your infrastructure, making it easy to search and analyze. Log pipelines use tools like parsers and remappers to structure raw log data, allowing teams to filter by specific attributes such as customer_id or request_id. This automation cuts down on the time spent manually reviewing logs.
Logs are automatically correlated with traces, linking errors directly to requests for faster diagnosis. With unified service tagging, teams can jump from a metric spike directly to relevant logs without losing context. As Datadog explains:
"Seamlessly pivot between metrics, traces, and logs to find the root cause of an incident." – Datadog
The Log Explorer provides a fast and intuitive search interface, enabling teams to filter logs by facets and attributes to quickly isolate errors or patterns. Log-based monitors can also be configured to trigger alerts based on specific log patterns or error rates, catching potential issues early. With over 1,000 integrations, Datadog ensures that signals from nearly any part of your infrastructure can be surfaced. These capabilities not only speed up recovery but also help small and medium-sized businesses reduce overall incident costs.
| Feature | Primary MTTR Benefit |
|---|---|
| Bits AI | Reduces manual work by generating real-time summaries and stakeholder updates |
| Service Map | Speeds up root cause identification with dependency visualization |
| Slack Mirroring | Prevents context switching by syncing chat history to incident timelines |
| Notification Rules | Ensures immediate involvement of the right responders based on pre-set criteria |
| Log Pipelines | Structures raw data for instant filtering, streamlining troubleshooting |
How to Measure Incident Resolution ROI with Datadog
Datadog Incident Resolution ROI Calculator for SMBs
Configuring Datadog to Track MTTR Metrics
To track Mean Time to Resolution (MTTR) effectively, start by setting up Datadog to log incident timestamps as soon as they're detected. Pull in incidents from various sources - like graph widgets, the Incidents UI, or alerts - to make sure your "Time Detected" data is as precise as possible.
Integrate Datadog with tools like Slack, ServiceNow, or Jira to automate ticket creation and capture real-time response data. These integrations ensure every step of the incident response process is recorded, from who took action to what was done.
Add custom fields to tag incidents by factors like severity, affected service, or root cause. This tagging system makes it easier to analyze data later, such as comparing MTTR for SEV-1 versus SEV-3 incidents or identifying trends for specific product lines. Use the Timeline tab to pin key messages and import Slack conversations directly into the incident record.
Access the Incident Management Overview dashboard through the Analytics section on the Incidents page. This dashboard offers a clear view of historical trends and MTTR metrics, helping you monitor performance. For deeper insights, use Datadog Notebooks to create automated postmortems that pinpoint bottlenecks.
"We used to spend hours figuring out where to route an alert. Now Datadog talks to our ITSM, and the ticket goes straight to the right team." – Chris Montgomery, Site Reliability Engineer & Observability SME, ECCO Select
This comprehensive setup not only enhances response times but also helps small and medium-sized businesses (SMBs) see the value Datadog adds to incident resolution ROI. With accurate MTTR data, you can measure performance improvements using Datadog's analytics tools.
Comparing Incident Data Before and After Datadog
Once Datadog is configured, compare its metrics to your legacy data to gauge improvements. Use historical data from tools like Jira, ServiceNow, or manual logs to establish a baseline for metrics such as Mean Time to Detect (MTTD), MTTR, documentation time, and stakeholder update frequency.
With Datadog in place, review incident trends using the Incident Management Overview dashboard. Filter data by severity, service, or custom fields to ensure you're comparing similar incidents. For instance, compare SEV-1 outages before and after Datadog to get an accurate picture of the changes.
One example: the USDA Forest Service cut their MTTR from 50 minutes to 20 minutes - a 60% improvement - by integrating Datadog with their ITSM platform.
Additionally, track the customer impact duration alongside MTTR to calculate the financial cost of downtime. Datadog's automated postmortems add valuable context, showing not just how much MTTR improved, but why. For SMBs, the 14-day free trial provides a chance to test the platform and compare initial results to existing processes.
| Metric | Pre-Datadog (Baseline) | Post-Datadog (Measured) | Improvement |
|---|---|---|---|
| Mean Time to Detect (MTTD) | Manual/Siloed | Automated Alerts | Up to 85% reduction |
| Mean Time to Resolve (MTTR) | 50 minutes (manual coordination) | 20 minutes (unified workflow) | 60% reduction |
| Documentation Time | 90 minutes (manual postmortems) | 10–15 minutes (AI-generated drafts) | 75–90 minutes saved |
| APM Deployment Time | Manual provisioning | Automated with Terraform | 75% reduction |
ROI Calculation: Formula and Examples
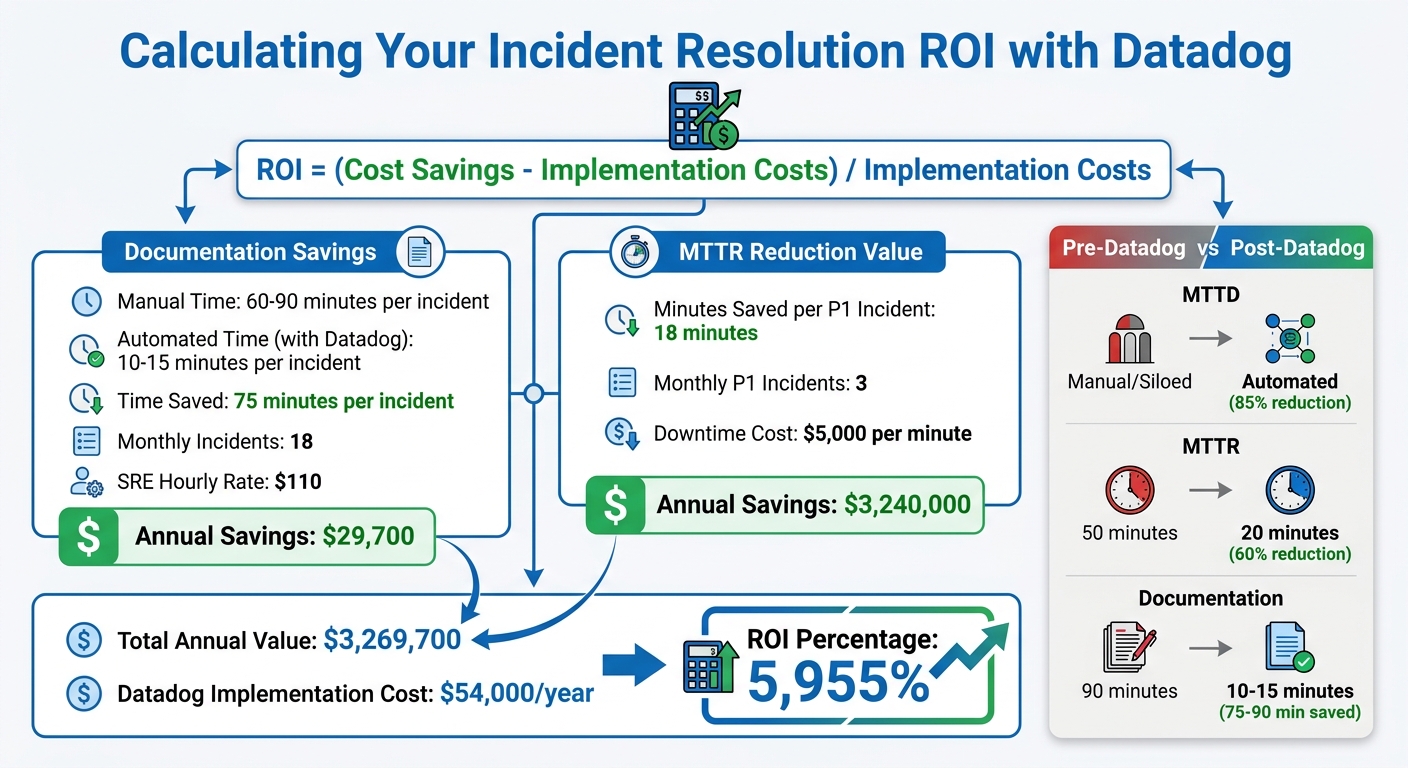
To calculate ROI, use this formula: ROI = (Cost Savings – Implementation Costs) / Implementation Costs. Key savings areas include reduced MTTR (lower downtime costs), less manual effort on documentation, and faster onboarding for on-call engineers.
Let’s break down documentation savings. Manual postmortems typically take 60–90 minutes per incident. With Datadog's tools like Slack mirroring and Bits AI, this time drops to 10–15 minutes. For an SMB handling 18 incidents monthly, with an SRE hourly rate of $110, the annual savings are $29,700.
Now, look at MTTR reduction. If downtime costs $300,000 per hour (or $5,000 per minute), and you save 18 minutes per P1 incident across three such incidents monthly, the annual savings total $3,240,000.
Add these together, and the total annual value is $3,269,700. If Datadog's implementation costs $54,000 annually, the ROI percentage comes out to 5,955%. For organizations implementing SRE practices, ROI averages around 200%, so even conservative estimates show significant benefits.
Don’t forget the "coordination tax" - the 10–15 minutes spent per incident on tasks like setting up Slack channels and finding on-call engineers. Datadog's automated rules can cut this to under two minutes.
| ROI Component | Formula | SMB Scenario Example |
|---|---|---|
| Documentation Savings | (Manual Time - Automated Time) × Monthly Incidents × 12 × Hourly Rate | (75 min saved × 18 incidents × 12) × $110/hr = $29,700/yr |
| MTTR Reduction Value | (Minutes Saved per P1 × Monthly P1s × 12) × (Downtime Cost per Min) | (18 min saved × 3 P1 incidents × 12) × $5,000/min = $3,240,000/yr |
| Total Annual Value | Documentation Savings + MTTR Reduction Value | $29,700 + $3,240,000 = $3,269,700 |
| ROI Percentage | ((Total Value - Software Cost) / Software Cost) × 100 | (($3.26M - $54k) / $54k) × 100 = 5,955% |
Ways to Increase Incident Resolution ROI with Datadog
Datadog combines centralized monitoring and incident analytics with automation to help businesses improve cost efficiency and streamline incident resolution.
Automating Incident Response with Workflows
Datadog's Workflow Automation simplifies incident management by automating repetitive tasks. These workflows can be triggered directly from monitors or security signals to perform actions like restarting cloud instances, clearing caches, or scaling resources automatically. Through the Action Catalog, Datadog integrates with platforms like AWS, Google Workspace, and Jira, enabling seamless automation for ticketing and infrastructure changes. This is particularly helpful for small and medium-sized businesses (SMBs) that often lack the resources to manually coordinate responses.
The Incident Workbench further enhances efficiency by providing a centralized hub where responders can analyze live data and communicate via Slack, all without needing to switch between tools. This streamlined approach reduces delays and keeps teams focused on resolving issues quickly.
Using AI-Powered Features to Prevent Incidents
Datadog's proactive monitoring tools help businesses avoid incidents before they disrupt operations, boosting ROI. For example, Watchdog integrates with CI/CD pipelines to immediately detect if a new code deployment causes latency or error spikes. This allows teams to roll back problematic changes quickly, addressing issues at their source.
The AI Voice Interface in Datadog On-Call is another game-changer. It provides real-time summaries of incidents directly to your mobile, identifying affected services even before you log in. Responders can acknowledge alerts and ask follow-up questions about the issue's impact or root cause, all while on the go.
"With our AI voice interface and handoff notifications, you can immediately assess the issue and take action fast." – Shah Ahmed and Addie Beach, Datadog
Additionally, Bits AI serves as an SRE assistant, helping engineers investigate incidents, suggest fixes, and summarize complex data to speed up the resolution process. Watchdog’s automated root cause analysis pinpoints potential causes and dependencies, saving time by reducing the need for manual investigations. These tools, combined with efficient on-call scheduling, ensure incidents are resolved faster and with less effort.
Building Efficient On-Call Schedules
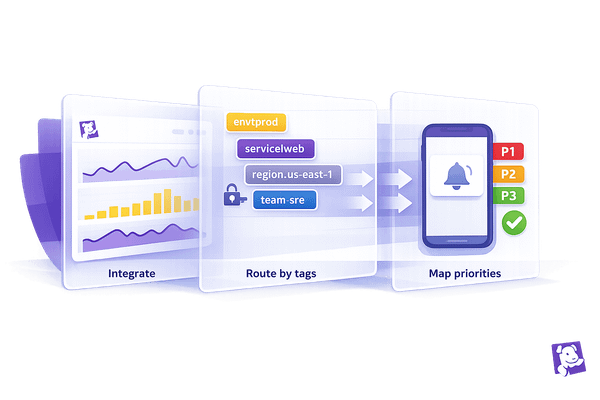
Effective on-call scheduling minimizes delays and ensures incidents are handled promptly. Multi-layered escalation policies notify backup responders if the primary engineer doesn’t acknowledge an alert within a set timeframe, ensuring no issue is overlooked. Routing rules further enhance efficiency by directing alerts to the right teams based on factors like service type, severity, or environment.
Automated handover summaries provide incoming engineers with immediate context on active incidents and recent changes, making shift transitions seamless. To reduce alert fatigue, anomaly detection replaces static thresholds, triggering alerts only when system behavior deviates from normal patterns. For SMBs with globally distributed teams, follow-the-sun scheduling ensures 24/7 coverage across time zones while preventing burnout. This balanced approach keeps teams responsive and well-rested.
Conclusion: Getting the Most ROI from Datadog
Datadog offers a range of tools that can significantly enhance incident resolution, but the return on investment (ROI) largely depends on how effectively you use them. A smart starting point is to focus on the essentials - Infrastructure Monitoring and APM. These features are particularly effective in reducing mean time to resolution (MTTR) and can lead to meaningful cost savings. As Root Cause, Lead Engineer at Let's Code Future, wisely observed:
"Datadog is a great tool. But tools don't prevent outages. Disciplined incident response does."
Managing costs is another key factor in maximizing ROI. Companies can cut their monitoring expenses by over 40% by filtering out unnecessary logs before ingestion, adjusting log retention periods to 7–15 days, and performing monthly audits of per-host spending. For instance, in March 2026, a 12-person engineering team managed to lower their annual Datadog costs from $60,000 to $36,000. They achieved this by analyzing 50 incidents, removing unused features, and automating incident documentation processes - saving an additional 180 hours annually.
Process improvements also play a major role. Implementing evidence-based root cause analysis with accurate log correlation can reduce repeat incidents by 68%. Additionally, automating tasks like timeline extraction and reporting can save up to 20 hours each month, translating to approximately $3,000 in senior engineer time.
To ensure you’re getting the most out of Datadog, consistently track metrics like MTTR, incident frequency, and resolution costs before and after implementation. Use the weekly usage dashboard to enforce strict limits on custom metrics and log ingestion. By following these steps, you can make Datadog a truly strategic asset for your organization, as outlined throughout this guide.
FAQs
Which Datadog features reduce MTTR the most for SMBs?
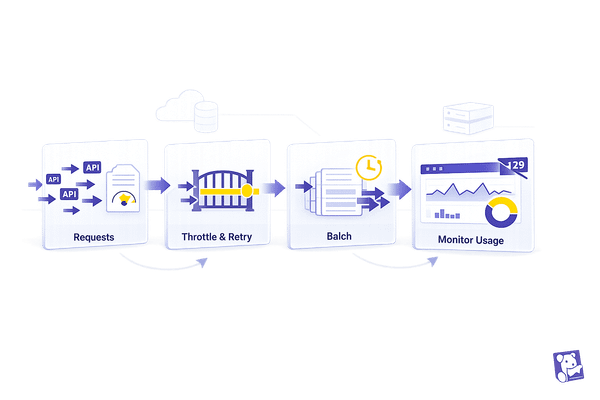
Datadog's Incident Management tools and Alert API play a crucial role in helping SMBs cut down on Mean Time to Resolution (MTTR). These tools automate the detection of incidents, simplify workflows, and ensure teams are notified without delay. With features like automated system issue alerts and integrations with platforms like Slack and PagerDuty, they make responses quicker and more efficient. This reduces downtime, limits manual effort, and ensures issues are resolved faster and more reliably.
What incident data do I need to baseline ROI before Datadog?
To get a clear picture of ROI before implementing Datadog, start by collecting detailed data on key metrics. Look at incident types (like high CPU usage or database failures), alert triggers, response times, and the steps involved in resolution workflows. This baseline will make it easier to track and measure improvements once Datadog is in use.
How can I lower Datadog costs while improving incident ROI?
To manage Datadog costs while improving the return on investment (ROI) for incident management, small and medium-sized businesses (SMBs) can take a few practical steps to optimize resource usage and control expenses.
Start by monitoring resource consumption regularly. This helps identify areas where usage can be streamlined. For example, you can reduce log volume by implementing sampling rules and retention policies. Filtering out non-essential logs can also make a big difference in cutting down unnecessary costs.
When it comes to custom metrics, focus on limiting high-cardinality tags and removing any redundant ones. High-cardinality tags can significantly inflate costs, so it’s important to use them selectively.
Lastly, prioritize collecting data that directly supports incident monitoring. Concentrate on key performance indicators (KPIs) like error rates and resource utilization. This approach ensures you strike a balance between cost efficiency and maintaining effective incident tracking.