How To Monitor Kubernetes Event Metrics in Datadog
Extend Kubernetes event history with Datadog, collect warning events via the Agent, and turn them into dashboards and alerts.
Monitoring Kubernetes events in Datadog helps you detect and resolve issues like pod scheduling failures, resource constraints, and node health problems. Kubernetes events are short-lived (retained for just 1 hour by default), but with Datadog, you can extend event history to 13 months. This enables better troubleshooting, pattern recognition, and root cause analysis.
Here’s how to get started:
- Set up Datadog: Install and configure the Datadog Agent in your Kubernetes cluster using Helm or the Datadog Operator.
- Enable event collection: Activate event monitoring by setting environment variables like
DD_COLLECT_KUBERNETES_EVENTSandDD_LEADER_ELECTION. - Build dashboards and alerts: Turn raw events into usable metrics, create visual dashboards, and set up alerts for critical issues such as
NodeNotReadyorFailedScheduling.
Datadog on Kubernetes Monitoring
sbb-itb-bc9f286
Prerequisites for Monitoring Kubernetes Event Metrics in Datadog
Before you dive into setting up Kubernetes event metrics monitoring with Datadog, make sure your environment is properly prepared. This will help you avoid configuration roadblocks.
Required Tools and Accounts
To get started, you'll need an active Datadog account and a valid Datadog API key for authenticating the Agent. Additionally, you must know your Datadog Site (e.g., datadoghq.com or us3.datadoghq.com) to correctly set the DD_SITE environment variable during installation.
On the Kubernetes side, your cluster should meet these requirements:
- Kubernetes version: Minimum of 1.16.0, though 1.22.0 or higher is recommended for full compatibility.
- Datadog Agent: Version 7.19.0 or later.
- Datadog Cluster Agent: Version 1.9.0 or later is highly recommended, as it manages leader election to prevent duplicate event ingestion.
Here’s a quick summary of the key requirements:
| Requirement | Minimum Version / Detail |
|---|---|
| Kubernetes | 1.16.0+ (1.22.0+ recommended) |
| Datadog Agent | 7.19.0+ |
| Datadog Cluster Agent | 1.9.0+ |
| Datadog API Key | Base64 encoded for Kubernetes Secrets |
| Deployment Method | Helm, Datadog Operator, or DaemonSet |
You'll also need kubectl for cluster management and, if applicable, helm for simplified deployments. If your cluster uses default RBAC settings, you'll need to configure a ClusterRole, ServiceAccount, and ClusterRoleBinding to enable event access. Alternatively, using the Datadog Operator or Helm charts can automate much of this setup, making them ideal for teams looking to minimize manual configuration.
Basic Knowledge of Kubernetes
You don’t need to be a Kubernetes expert, but a working understanding of core concepts is essential. Focus on these areas:
- Pods, Deployments, Namespaces, and Nodes: These are the building blocks of Kubernetes.
- DaemonSets: Learn how they work, as the Datadog Agent is deployed as a DaemonSet to ensure it runs on every node in your cluster.
- Labels and Annotations: These are crucial for Datadog's Autodiscovery feature, which uses them to tag workloads.
- RBAC (Role-Based Access Control): Familiarize yourself with concepts like
ServiceAccountandClusterRole. This will help you understand why specific permissions are needed and how to resolve access issues if they arise.
Having this foundational knowledge will make configuring event monitoring in Datadog smoother and troubleshooting easier.
How to Configure Datadog to Collect Kubernetes Events
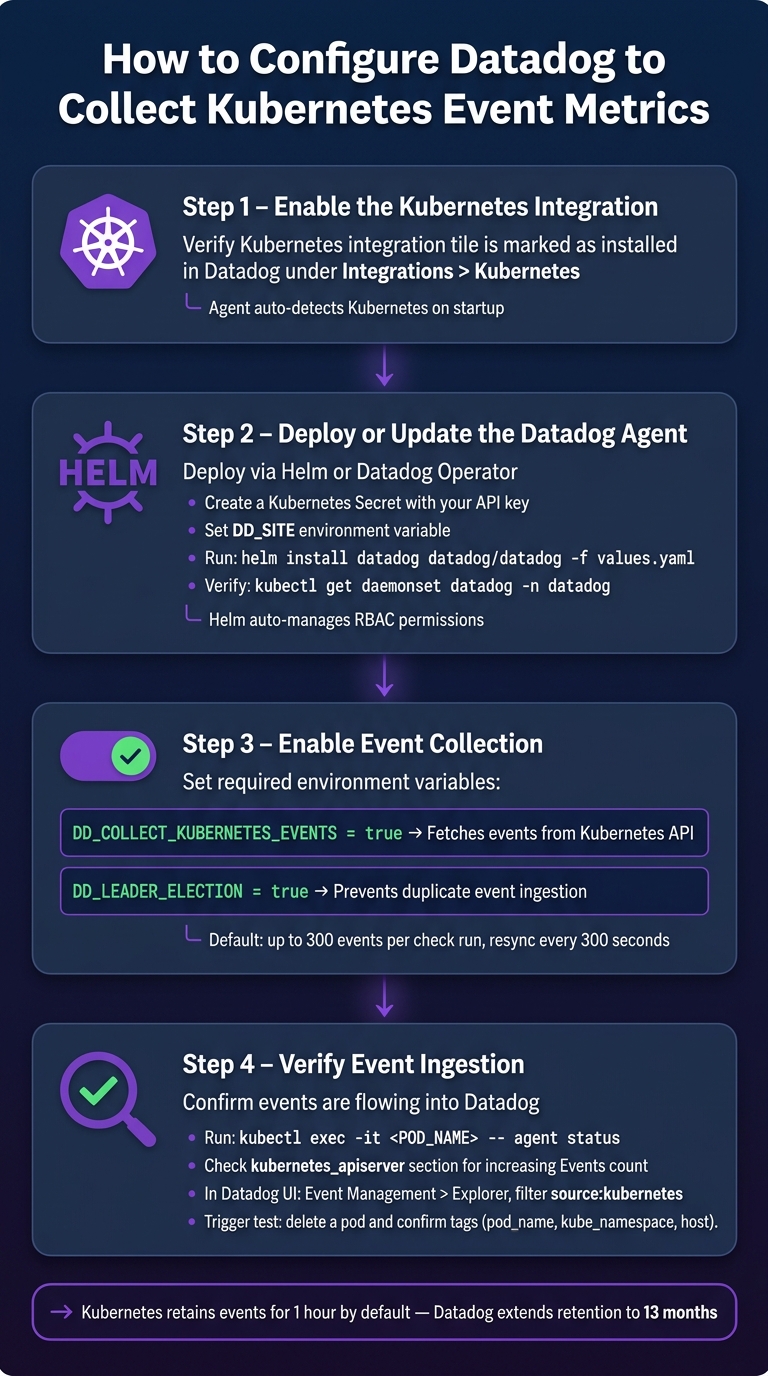
How to Monitor Kubernetes Event Metrics in Datadog: Step-by-Step Setup
Follow these steps to set up Datadog for collecting Kubernetes events.
Enable the Kubernetes Integration
The Datadog Agent comes with Kubernetes integration pre-installed - no additional setup is required. Once the Agent is running within your cluster, it will automatically detect Kubernetes and begin gathering standard metrics and labels. To ensure the integration is active, go to Integrations > Kubernetes in your Datadog account and confirm that the integration tile is marked as installed. At this point, while basic metrics are being collected, you'll need further configuration to enable event collection. The next step involves deploying or updating the Datadog Agent.
Deploy or Update the Datadog Agent
To avoid potential configuration issues, it's recommended to deploy the Datadog Agent using either the Datadog Operator or Helm instead of manually setting up a DaemonSet. For a Helm-based deployment:
- Create a Kubernetes Secret containing your Datadog API key.
-
Set the
DD_SITEenvironment variable to match your Datadog site (e.g.,datadoghq.comfor US1). -
Run the Helm installation command:
helm install datadog datadog/datadog -f values.yaml -
Verify the DaemonSet using:
kubectl get daemonset datadog -n datadog
The Helm chart simplifies the process by automatically managing RBAC permissions.
Turn On Event Collection
To enable event collection, configure the following environment variables within your Datadog Agent setup:
| Environment Variable | Value | Description |
|---|---|---|
DD_COLLECT_KUBERNETES_EVENTS |
true |
Enables the Agent to fetch events from the Kubernetes API. |
DD_LEADER_ELECTION |
true |
Ensures only one Agent instance collects cluster-wide events, avoiding duplicates. |
Without DD_LEADER_ELECTION, every Agent pod in your cluster could collect the same events, resulting in duplicate data in your Datadog account.
For more control, you can modify the kubernetes_apiserver.d/conf.yaml file. For example:
- Set
unbundle_events: trueto convert grouped events into individual Datadog events. - Use
filtered_event_typesto exclude less useful events, such as those with aNormaltype or aFailedGetScalereason.
By default, the Agent collects up to 300 events per check run, with a resync period set to 300 seconds.
Verify Event Ingestion in Datadog
Once the Agent is deployed and event collection is enabled, use the following command to check its status:
kubectl exec -it <DATADOG_AGENT_POD_NAME> -- agent status
Review the kubernetes_apiserver section to ensure the "Events" count is increasing and the status reads "OK". Alternatively, you can verify live event ingestion in the Datadog UI by navigating to Event Management > Explorer and filtering for source:kubernetes.
To confirm everything is working, trigger a test event by deleting a pod. Check that the events include relevant metadata tags such as pod_name, kube_namespace, and host. These tags make it easier to query and analyze events.
How to Turn Kubernetes Events into Usable Metrics
Transforming Kubernetes events into actionable metrics is essential for effective monitoring. Once the Datadog Agent starts ingesting events, the next step is to refine that data into meaningful queries, dashboards, and monitors that highlight real issues instead of overwhelming you with noise.
Identify Key Kubernetes Event Types
Kubernetes events are classified into two categories: Normal (informational) and Warning (indicating potential issues). For proactive monitoring, it's best to focus on Warning events. Nicholas Thomson, Technical Content Writer at Datadog, explains:
"Monitoring Kubernetes events involves filtering out noise to detect critical issues. If you can filter events properly, that signal can provide insights that help you reduce mean time to resolution (MTTR)."
The following Warning event reasons are especially important for maintaining cluster stability:
| Event Reason | What It Signals |
|---|---|
FailedScheduling |
Insufficient CPU/memory or mismatched taints/tolerations |
NodeNotReady |
Kubelet crash or network issues that might lead to pod evictions |
ImagePullBackOff |
Missing secrets or an incorrect image registry path |
FailedMount |
Incorrect mount paths or misconfigured mount options |
Evicted |
Node under memory or disk pressure |
BackOff |
Container crash-loop, often signaling high-priority application issues |
Once these critical event types are identified, you can convert them into time-series data using focused queries.
Build Event Metric Queries
In Datadog's Event Management Explorer, start by filtering and aggregating events with a query like:
source:kubernetes type:warning
This removes routine informational events. To get more specific, refine your query by targeting key reasons, such as reason:FailedScheduling or reason:NodeNotReady. For even greater precision, use Boolean logic (e.g., type:warning AND NOT reason:Evicted) to exclude less critical events like evictions. Wildcards can also help broaden your search - for instance, pod_name:*canary captures events tied to canary deployments.
Once you've filtered the event streams, convert them into time-series data by creating a custom metric. This allows you to track the frequency of specific events over time, making it easier to spot trends or anomalies.
Create Dashboards for Event Metrics
With your queries ready, build a dashboard to get a clear, cluster-wide overview. Useful widgets might include:
- Time-series graphs of Warning events grouped by
kube_namespace - Top-list widgets showing nodes with the highest number of
NodeNotReadyevents - Count widgets tracking
BackOffevents in critical namespaces
A powerful approach is overlaying events onto resource metric graphs. For example, plotting FailedScheduling event markers on a CPU utilization graph can quickly show if scheduling failures align with resource saturation. Organize widgets by facets like kube_namespace, pod_name, or node to pinpoint instability hotspots. This can be particularly helpful for small to medium-sized businesses managing multiple services in shared clusters.
Set Up Monitors for Event Metrics
To set up monitoring, go to Monitors > New Monitor > Event in Datadog. Configure a query like type:warning reason:NodeNotReady, and set thresholds to trigger alerts when event counts exceed a specific limit within a given time window. Enable Multi Alert mode to group notifications by attributes such as host or kube_namespace. Include template variables like {{event.title}}, {{event.text}}, and {{event.tags.kube_namespace}} to provide responders with crucial context before they log into Datadog.
Best Practices for SMBs Using Kubernetes Event Metrics
Focus on High-Priority Event Patterns
For small and medium-sized businesses (SMBs), keeping an eye on events that could lead to downtime is crucial. These include issues like node health problems, container restarts, scheduling failures, and volume-related errors. Nicholas Thomson, Technical Content Writer at Datadog, emphasizes:
"Monitoring these events can help you troubleshoot issues affecting your infrastructure."
Pay extra attention to events such as NodeNotReady, container restarts, and evictions. Also, track scheduling errors like FailedScheduling and volume issues such as FailedAttachVolume, as these can signal potential cascading problems.
Use Tags and Naming Conventions
Organizing your event feed with consistent tagging can make troubleshooting much easier. Datadog’s Unified Service Tagging system uses labels like env, service, and version to link events, metrics, and traces across your environment. Applying these tags to workload definitions and pod templates ensures better visibility.
| Tag | Label | Why It Matters for SMBs |
|---|---|---|
env |
tags.datadoghq.com/env |
Separates production from staging environments |
service |
tags.datadoghq.com/service |
Groups events by application for easier tracking |
version |
tags.datadoghq.com/version |
Identifies if issues are tied to recent deployments |
team |
Custom label/annotation | Routes alerts to the correct team or engineer |
By setting the DD_KUBERNETES_POD_LABELS_AS_TAGS environment variable, Datadog can automatically pull in Kubernetes labels, minimizing the need for manual tagging. Once tagging is standardized, you can seamlessly integrate event data into your incident response processes.
Connect Events to Incident Workflows
When issues arise, the Kubernetes Explorer side panel becomes a valuable tool. It provides quick access to events, logs, APM traces, and network metrics for the affected resource. During investigations, use the 7-day YAML definition history in the Kubernetes Explorer to check if recent configuration changes contributed to the problem. Overlaying markers for events like FailedScheduling or Evicted on latency graphs can also help determine whether performance issues stem from scheduling constraints rather than application bugs.
Review Event Metrics to Address Recurring Issues
Regularly reviewing event metrics can strengthen your operations. For instance, if you notice consistent ImagePullBackOff events in the same namespace, it could point to a missing registry secret. Identifying trends in warning events can also help you measure the effectiveness of infrastructure improvements.
Leverage Datadog's saved queries and dashboard widgets to simplify these reviews. For example, if you see a weekly rise in BackOff events within a critical namespace, it might be time to reassess resource limits for your containers before minor issues turn into major outages. These practices can help your team catch and resolve problems early, keeping your systems running smoothly.
Conclusion
To effectively monitor Kubernetes event metrics, start by deploying the Datadog Agent, enabling event collection, and building dashboards and alerts that turn raw data into actionable insights. Using consistent tagging, focusing on warning-level events, and connecting event patterns with incident workflows can help your team address potential issues before they escalate.
Kubernetes only retains event data for one hour by default, but Datadog extends this to 13 months. This extended retention provides valuable historical context for analyzing recurring problems and conducting postmortems. With this foundation, your team can take advantage of advanced monitoring tools to improve your overall strategy.
Datadog also offers tools like Watchdog for detecting anomalies, Workflow Automation for initiating remediation processes, and Cloud Cost Management to align resource usage with expenses. These features work together to streamline your Kubernetes monitoring and management efforts.
FAQs
Which RBAC permissions does Datadog need to read Kubernetes events?
To allow the Datadog Agent to read Kubernetes events, you’ll need to grant it specific Role-Based Access Control (RBAC) permissions. This means the ClusterRole must include access to the events resource within the core API group, allowing the get, list, and watch actions.
Additionally, for leader election functionality, the Agent requires permissions to get and update the datadogtoken or datadog-leader-election ConfigMaps. These permissions enable the Agent to manage and maintain its state effectively.
How can I stop duplicate Kubernetes events from being ingested in Datadog?
To avoid duplicate Kubernetes events, activate the leader election feature in your Datadog Agent. This ensures that only one Agent is responsible for collecting events at any given time.
Additionally, fine-tune the Kubernetes integration by enabling filtering_enabled and specifying filtered_event_types to exclude certain types of events. For even less noise, set unbundle_events to false, which stops the creation of separate events for grouped objects.
What’s the best way to turn Kubernetes Warning events into alertable metrics?
Datadog's Event Monitor makes it easy to transform Kubernetes warning events into actionable alerts. Here’s how you can set it up:
- Navigate to Monitors in your Datadog dashboard and select New Monitor.
- Choose Event as your monitor type.
- Use the Event Explorer syntax to craft a search query that isolates Kubernetes warning events.
- Configure the monitor to track event counts over a specific time frame, then set thresholds that will trigger alerts when exceeded.
- Fine-tune your notifications by applying grouping strategies - either simple or multi-alert - to ensure you focus on the most critical events in your system.
This approach helps you stay on top of issues by turning warnings into clear, actionable insights.