How to Integrate Datadog with Cloud-Native Tools
How to connect Datadog to AWS, Azure, GCP, and Kubernetes; configure metrics, logs, dashboards, alerts, and automation.
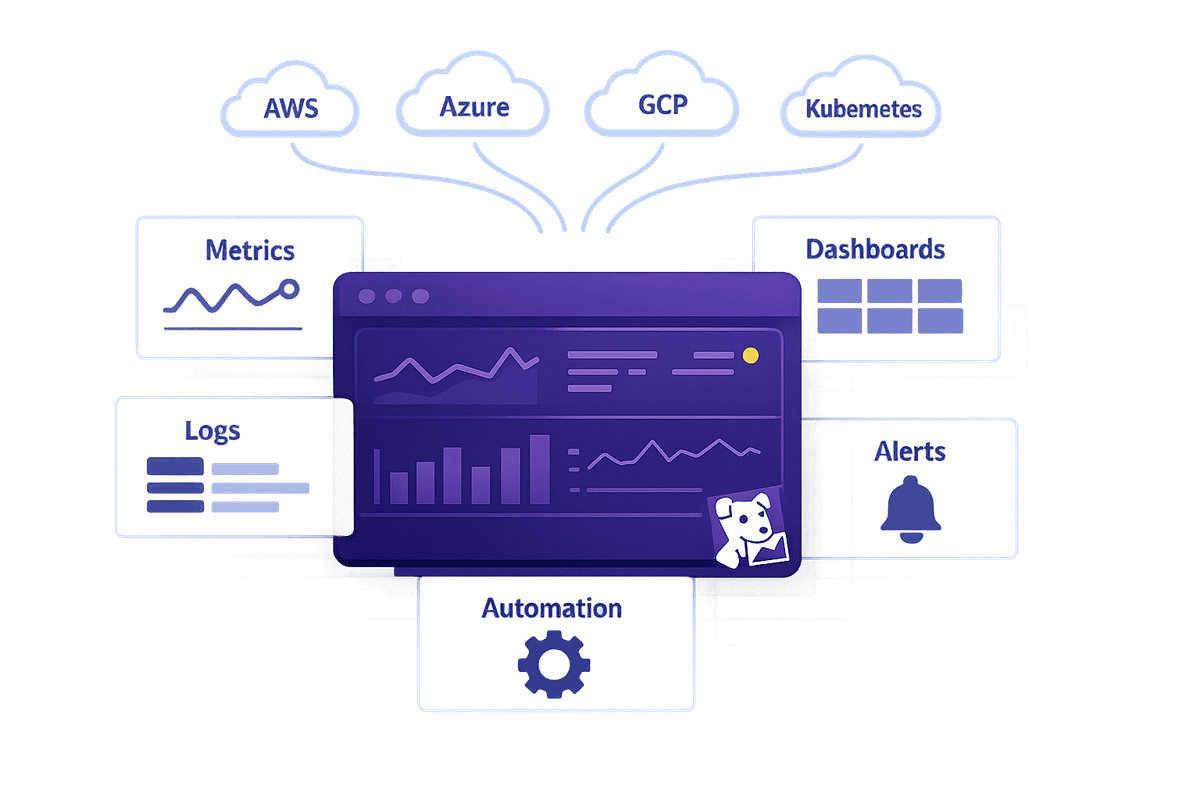
If you're managing cloud platforms like AWS, Azure, Google Cloud, or Kubernetes, integrating Datadog can simplify monitoring by consolidating metrics, logs, and events into one platform. This reduces response times by up to 30% and improves resource efficiency by 25%. Here's how you can connect Datadog to these tools:
- AWS: Use CloudFormation or Terraform to set up IAM roles for collecting metrics and logs.
- Azure: Leverage the Quickstart setup with Azure Resource Manager templates for streamlined log forwarding.
- Google Cloud: Create a service account with roles like Monitoring Viewer, and enable required APIs for project monitoring.
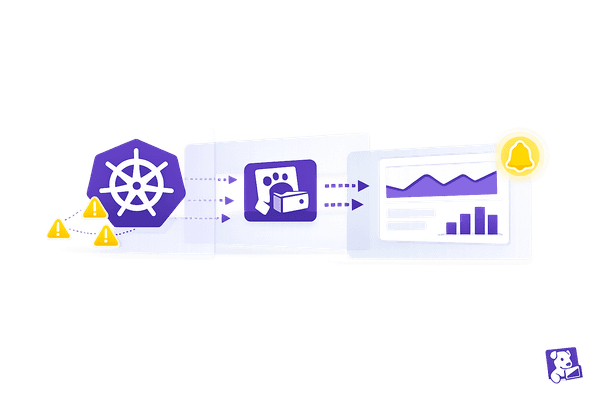
- Kubernetes: Deploy the Datadog Agent using Helm or YAML manifests for cluster-wide visibility.
Once integrated, configure data collection, set up dashboards, and automate workflows to monitor and respond to incidents effectively. This approach is ideal for small teams aiming to optimize operations without adding complexity.
Google Cloud Monitoring with Datadog: Comprehensive Guide for Google Cloud Integration with Datadog
sbb-itb-bc9f286
Prerequisites and Supported Cloud-Native Tools
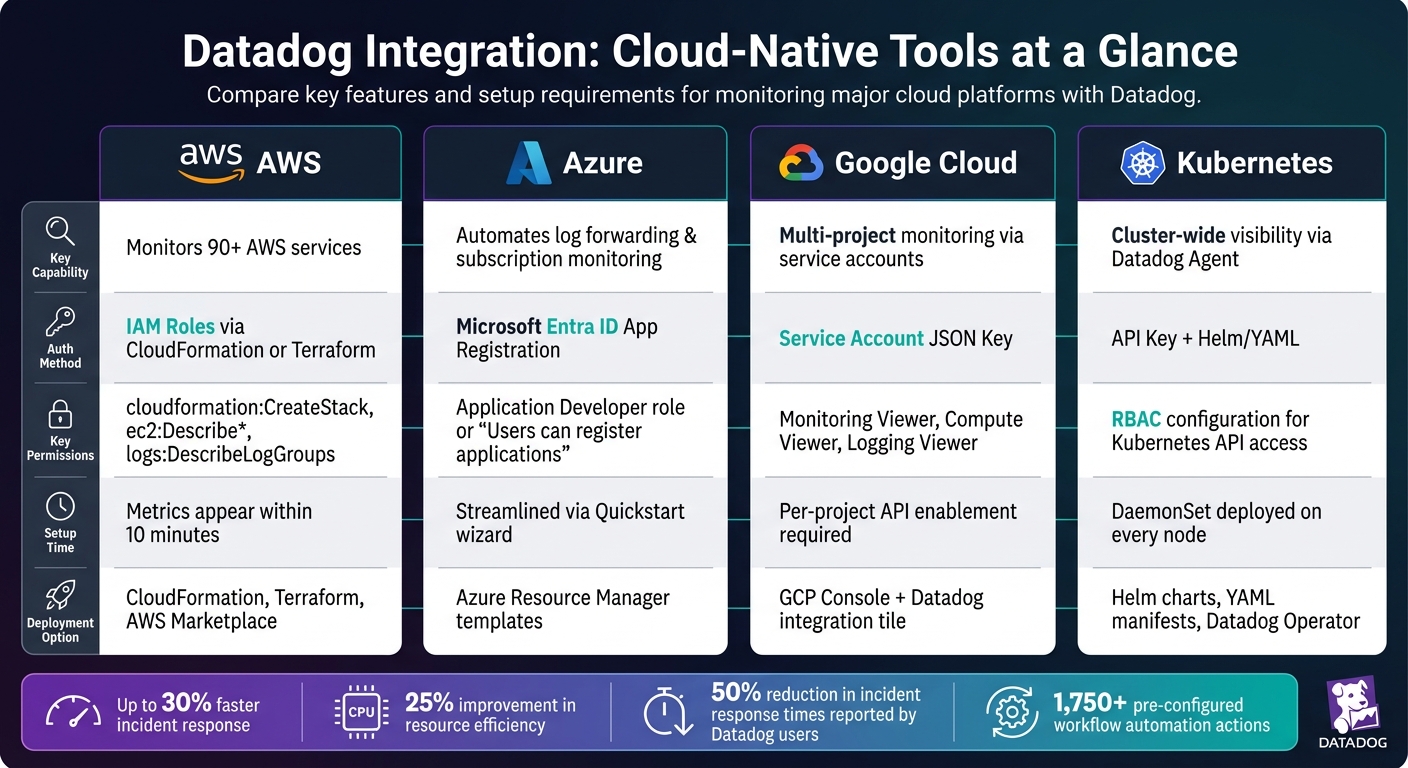
Datadog Integration Guide: AWS vs Azure vs GCP vs Kubernetes
Before connecting Datadog to your cloud environment, make sure you have the necessary accounts, permissions, and tools in place. Skipping these steps often leads to integration problems. Below, you’ll find the specific requirements for each platform.
Account and Permission Requirements
Having the right permissions and account configurations is critical for smooth cloud integration. Start with an active Datadog account that has admin access - this is essential for generating and managing API keys, which are required for all integrations. The permissions you’ll need depend on the cloud platform you’re using.
For AWS, Datadog requires permissions like cloudformation:CreateStack, ec2:Describe*, and logs:DescribeLogGroups to collect metrics and logs. On Azure, your Microsoft Entra ID user must be able to create app registrations. This can be achieved with the Application Developer role or by enabling the Users can register applications setting. For Google Cloud, you’ll need to create a service account and assign it IAM roles such as Monitoring Viewer and Compute Viewer.
"To integrate Datadog with Azure, your Microsoft Entra ID user needs the permission to create an app registration." - Datadog Azure Integration Documentation
Getting these permissions right from the start can save you from unnecessary troubleshooting. If you’re unsure about your access, consult your cloud administrator before proceeding.
Supported Cloud-Native Tools
Datadog integrates seamlessly with four major platforms commonly used by SMBs:
| Platform | Key Capability |
|---|---|
| Amazon Web Services (AWS) | Gathers metrics, logs, and events from over 90 AWS services |
| Microsoft Azure | Automates log forwarding and monitors subscriptions |
| Google Cloud Platform (GCP) | Enables multi-project monitoring using service accounts |
| Kubernetes | Offers detailed cluster-level visibility via the Datadog Agent |
Tool-Specific Setup Requirements
Each platform has a straightforward setup process, provided you have the correct permissions.
For AWS, use the CloudFormation template provided by Datadog to automatically create the necessary IAM roles. Metrics should start appearing within 10 minutes. On Azure, the Quickstart setup in the Datadog integration tile simplifies the process by leveraging Azure Resource Manager templates for log forwarding. For Google Cloud, you’ll need to enable specific APIs, such as the Cloud Monitoring API and Compute Engine API, for each project you wish to monitor.
"The Google Cloud integration requires enabling the Cloud Monitoring API for each project you want to monitor." - Datadog Google Cloud Integration Documentation
For Kubernetes, deploy the Datadog Agent to your cluster using Helm charts or YAML manifests. Ensure that RBAC is properly configured so the Agent can interact with the Kubernetes API. If you’re managing multiple clusters or want easier lifecycle management, consider using the Datadog Operator.
How to Connect Datadog with Cloud-Native Tools
To get started, you'll need to authenticate each tool, configure the necessary settings, and verify that data is flowing correctly. The process generally follows three steps: authenticate, configure, and verify.
Integrating Datadog with AWS
The quickest way to connect Datadog to AWS is by using CloudFormation. Datadog offers a CloudFormation template that automatically sets up the necessary IAM roles, eliminating the need to create policies manually. If your team prefers Terraform, Datadog provides an AWS integration module for a Terraform-based configuration. For those using AWS Control Tower, you can deploy Datadog via the AWS Marketplace to manage multiple accounts seamlessly.
"Integrating Datadog with AWS provides unparalleled visibility into your cloud infrastructure, enabling teams to respond to incidents faster." - Datadog Team
If you'd rather handle permissions manually, you can create an IAM role in your AWS account, attach policies for services like CloudWatch, EC2, and RDS, and then input the role ARN into the Datadog AWS integration tile for precise control over permissions.
The next step is to integrate with Microsoft Azure, which follows a similarly streamlined process.
Integrating Datadog with Azure
For Azure, the Quickstart setup in the Datadog integration tile is the best place to begin. This approach uses Azure Resource Manager templates to configure log forwarding automatically, cutting down on manual work.
Before starting, ensure your Microsoft Entra ID user has permissions to create app registrations. Once that's confirmed, the Quickstart wizard will guide you through linking your Azure subscription, enabling Azure Monitor metrics collection, and setting up diagnostic log forwarding to Datadog.
Integrating Datadog with Google Cloud
For Google Cloud, the integration process relies on service account credentials for simplicity. Start by going to the Google Cloud Console and navigating to IAM & Admin > Service Accounts. Create a new service account and assign it roles like Monitoring Viewer and Logging Viewer, then generate a JSON key for the account.
Next, in Datadog, open the Google Cloud integration tile and upload the JSON key file. From there, select the projects you want to monitor and decide which metrics and logs to collect. Make sure the Cloud Monitoring API and Cloud Logging API are enabled for each project, as the integration won't work without them.
Integrating Datadog with Kubernetes
For Kubernetes, deploy the Datadog Agent using Helm, a Kubernetes package manager. You'll need your API key and site details to proceed. Use the following command:
helm install datadog-agent datadog/datadog \
  --set datadog.apiKey=<YOUR_API_KEY> \
  --set datadog.site=<YOUR_DATADOG_SITE>
The Agent is deployed as a DaemonSet, which ensures a pod runs on every node in your cluster. This setup allows for comprehensive data collection, including metrics, logs, and traces. To enable log collection, set datadog.logs.enabled=true in your Helm values file. Once deployed, you can use Datadog's Kubernetes Explorer to get a live view of your cluster, including pods, deployments, and other resources. This tool is especially helpful for spotting and addressing issues quickly.
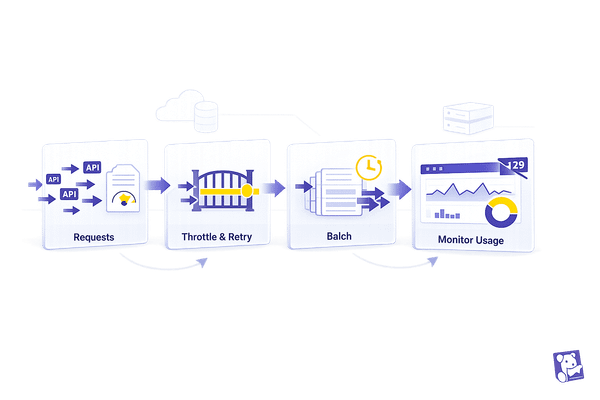
Configuring Data Collection and Routing in Datadog
Once you've integrated Datadog, the next step is configuring it to gather and route the right data. This setup is key to making Datadog a central hub for cloud monitoring, especially for SMBs. By fine-tuning these configurations, you ensure accurate data collection and smooth routing.
Setting Up Metrics Collection
Datadog simplifies metrics collection by automatically pulling data from infrastructure, applications, and custom sources. For AWS, over 90 services start sending metrics once IAM is properly configured. In Google Cloud, the Datadog Agent detects and gathers metrics from newly discovered services. Additionally, the Cluster Agent collects cluster-wide metrics and provides external metrics tailored for HPA-based autoscaling. This allows teams to scale using real application performance data instead of relying solely on Kubernetes' default metrics.
Log Forwarding and Management
To collect logs, enable log collection by setting logs_enabled: true in the datadog.yaml file. Then, define your log sources, such as host file tails, container stdout/stderr, or application logs. For AWS users, the Datadog Forwarder Lambda function automatically gathers logs from services like S3, CloudWatch, and EventBridge, forwarding them to Datadog.
Once the logs are in, you can use log pipelines to parse, filter, and enrich the data before indexing. This ensures your logs remain clean, organized, and easy to search from the start. You can then link these logs to metrics and events for actionable insights.
Event Monitoring and Correlation
Events from all integrated platforms appear in Datadog's Event Stream, where they can be filtered and correlated. With AWS EventBridge or the Datadog API, you can create custom routing rules for events. This approach connects infrastructure events directly to your metrics and logs, offering a comprehensive view of your environment. It reinforces Datadog's ability to deliver unified monitoring across platforms, tailored for SMB needs.
"Datadog provides a seamless integration with AWS, allowing users to monitor their cloud infrastructure effectively." - Datadog Documentation
Setting Up Dashboards, Alerts, and Workflow Automation
Once your data is flowing into Datadog, the next step is making sense of it all. Dashboards, alerts, and workflow automation are key tools to help you monitor and act on your data effectively.
Building and Validating Dashboards
Datadog's drag-and-drop dashboard builder makes it easy to create custom views tailored to your needs. If you're unsure where to start, you can clone one of Datadog’s pre-built dashboards. These are available for major integrations like AWS, Azure, Google Cloud, and Kubernetes, and can be customized immediately to provide quick insights into your environment.
"Creating a good dashboard is about bringing the answers to these questions to the surface." - Datadog Documentation
To make dashboards more dynamic, group related metrics and use template variables for filtering. After setting things up, validate your data flow by comparing the displayed metrics with raw values in the Metrics Explorer. This step ensures the data you're seeing is accurate.
Once your dashboards are set, the next priority is setting up alerts to proactively address potential issues.
Configuring Alerts for Key Metrics
Datadog uses monitors to create alerts. These monitors evaluate a metric against a predefined threshold at a set frequency - by default, every minute - which is ideal for most small and medium-sized businesses.
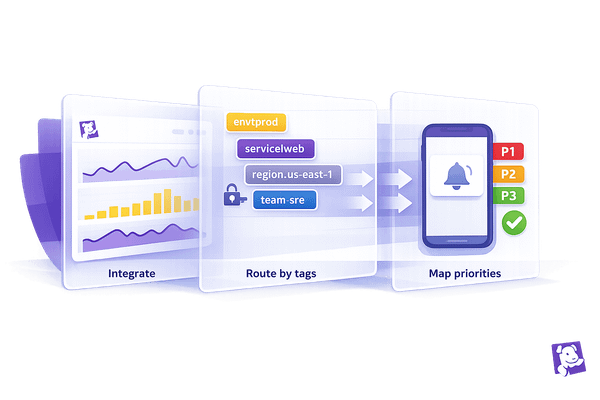
To avoid being overwhelmed by unnecessary alerts, take advantage of notification rules. These rules allow you to route alerts based on tags. For instance, you could direct alerts tagged team:backend and env:prod to the on-call engineer, while routing less urgent alerts to a Slack channel for later review. Datadog supports up to 1,000 notification rules per organization, providing plenty of flexibility as your infrastructure scales. Before activating alerts, use the evaluation preview feature to test and ensure they trigger appropriately under real-world conditions.
When an alert is triggered, automated workflows can help streamline your response.
Automating Workflows Across Platforms
With Datadog's Workflow Automation, you can create automated response processes that kick in as soon as a monitor fires. Datadog offers over 1,750 pre-configured actions and more than 150 customizable blueprints, allowing you to integrate tools like Jira and Slack without needing to write custom scripts.
"With Workflow Automation, you can automate end-to-end processes in response to Datadog alerts and security signals." - Datadog Documentation
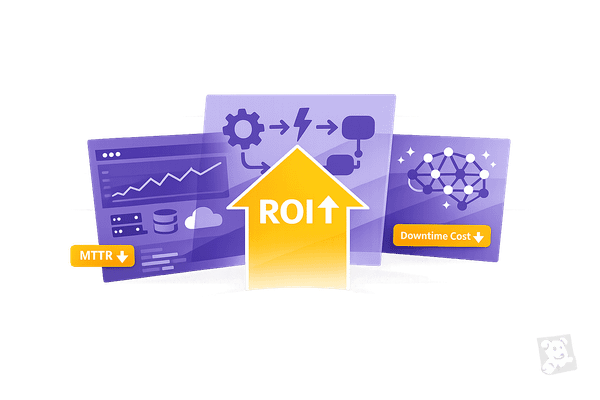
For example, you can set up a workflow where, if CPU usage on a production service exceeds your defined limit, Datadog automatically creates a Jira ticket, sends a Slack message to the appropriate channel, and tags the incident with the affected service. Automating these steps can cut response times by up to 30%, letting your team focus on resolving the issue instead of managing notifications.
Conclusion: Getting the Most Out of Datadog for SMBs
Connecting Datadog to your cloud platforms - whether it's AWS, Azure, Google Cloud, or Kubernetes - gives your team a unified view of your infrastructure. This setup is particularly well-suited for small teams looking to simplify and automate their monitoring processes.
Businesses using Datadog's solutions have reported cutting incident response times by as much as 50%, thanks to enhanced visibility and efficient alerting systems. To get started, link Datadog to your existing cloud services. From there, build dashboards, set up alerts, and automate workflows to make incident management smoother.
It's also important to regularly review your metrics and alert settings. As your infrastructure grows, too many alerts or cluttered dashboards can become distracting. Simplify your configurations to stay focused on the most critical issues.
As your company scales, keeping your setup efficient is key. By centralizing data sources and automating tasks, Datadog helps small and medium businesses work smarter. For more tips and expert advice tailored to SMBs managing cloud infrastructure growth, check out Scaling with Datadog for SMBs.
FAQs
What’s the fastest way to verify Datadog is receiving data after setup?
To confirm that Datadog is receiving data, log in to your dashboard and navigate to the Infrastructure section. From there, check the Hosts tab to see if your systems are listed. Metrics typically show up within 5–15 minutes. If you don’t see any data, double-check that the Agent service is running and verify your firewall settings. For custom integrations, run the agent status command to review active checks and ensure proper connectivity.
Which permissions do I need to integrate Datadog with AWS, Azure, GCP, or Kubernetes?
To connect Datadog with AWS, Azure, GCP, or Kubernetes, you'll need to ensure the right permissions are in place:
- AWS: Set up an IAM role with SecurityAudit and API permissions. If you're using CloudFormation, make sure it has access to IAM, Lambda, S3, and logs.
- Azure: Use the Application Developer role or app registration permissions. For subscription monitoring, you'll need either the Owner or Contributor role along with User Access Admin permissions.
- GCP: Assign the Datadog Admin role, or create custom roles that include api_keys_write and user_app_keys permissions.
- Kubernetes: Modify cluster-specific settings to enable features like the Admission Controller.
Each platform has its own setup requirements, so double-check permissions to ensure smooth integration.
How can I reduce alert noise while still catching critical incidents?
To cut down on unnecessary alert noise while still catching critical incidents, take advantage of Datadog’s advanced monitoring features. You can extend evaluation windows and set recovery thresholds to filter out alerts caused by short-lived issues. Use composite monitors to group related alerts together and anomaly detection to spot irregular behavior patterns. Additionally, configure alert dependencies to silence downstream alerts during primary failures, and implement tag-based routing to ensure the right team gets notified promptly.