Datadog-PagerDuty Integration: Best Practices
Setup and optimize Datadog–PagerDuty integration: secure keys, map priorities, route alerts via tags, test flows, and reduce alert fatigue.
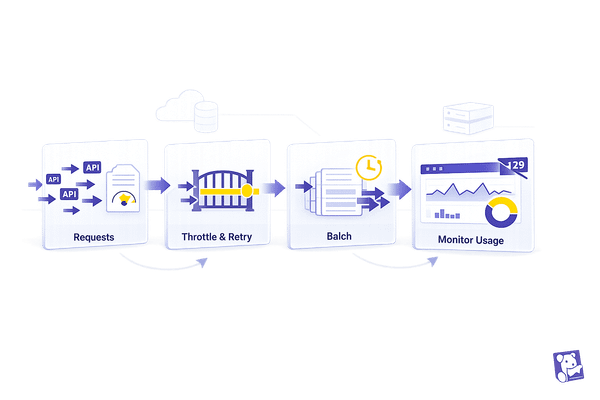
When Datadog and PagerDuty work together, they create a powerful system for managing incidents. Datadog monitors your infrastructure, while PagerDuty ensures alerts reach the right people at the right time. This guide walks you through setting up and optimizing their integration to reduce downtime, route alerts effectively, and improve response times.
Key Takeaways:
- Automated Incident Management: Datadog triggers alerts based on thresholds, and PagerDuty routes them to the right responders.
- Who Should Use This: Scaling with Datadog for SMBs with limited IT resources, juggling multiple roles, or dealing with slow response times.
- Setup Essentials:
- Admin access in both platforms.
- PagerDuty integration key and Datadog API/Application keys.
- Configure monitors in Datadog to trigger PagerDuty incidents.
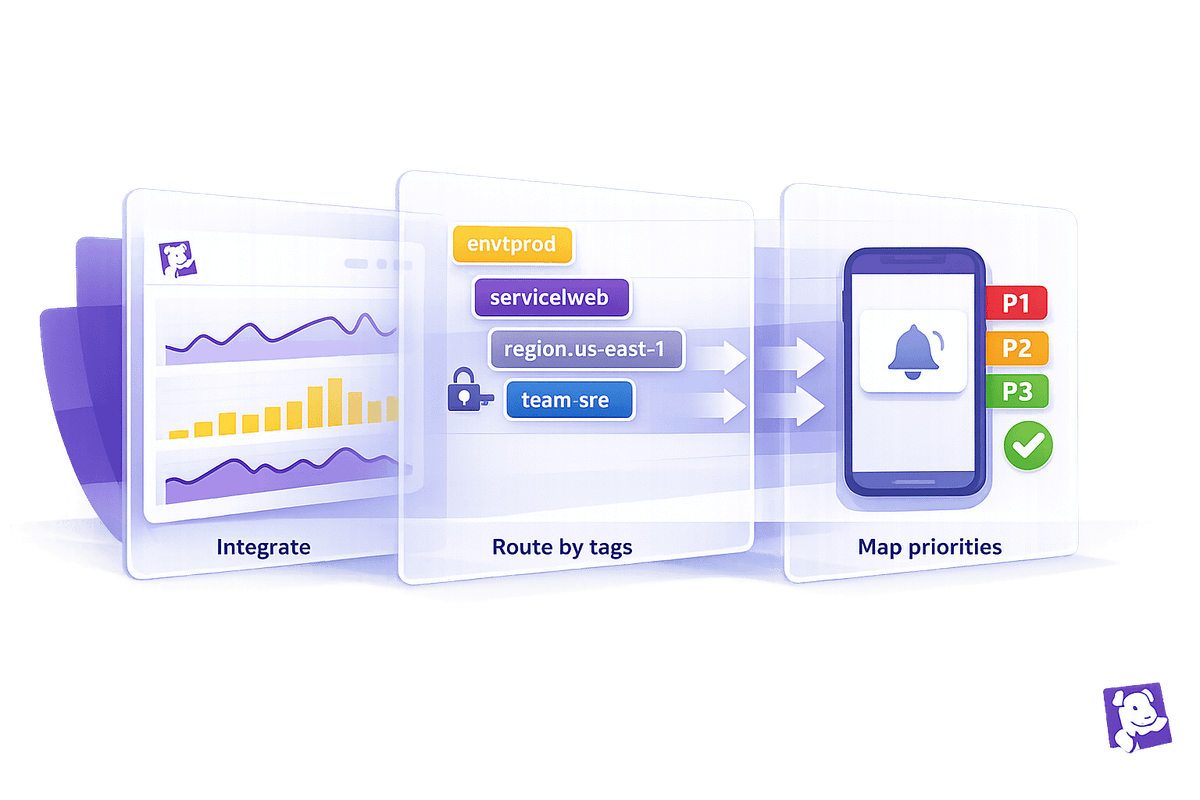
- Optimize Alerts:
- Use tags (
team,service,env) for precise routing. - Create clear naming conventions for alerts.
- Map Datadog monitor priorities to PagerDuty incident urgencies.
- Use tags (
Benefits:
- Faster issue resolution.
- Reduced alert fatigue.
- Clear audit trails for compliance (SOC 2, ISO 27001).
By following this guide, you’ll streamline incident management and ensure your team is ready to act when it matters most.
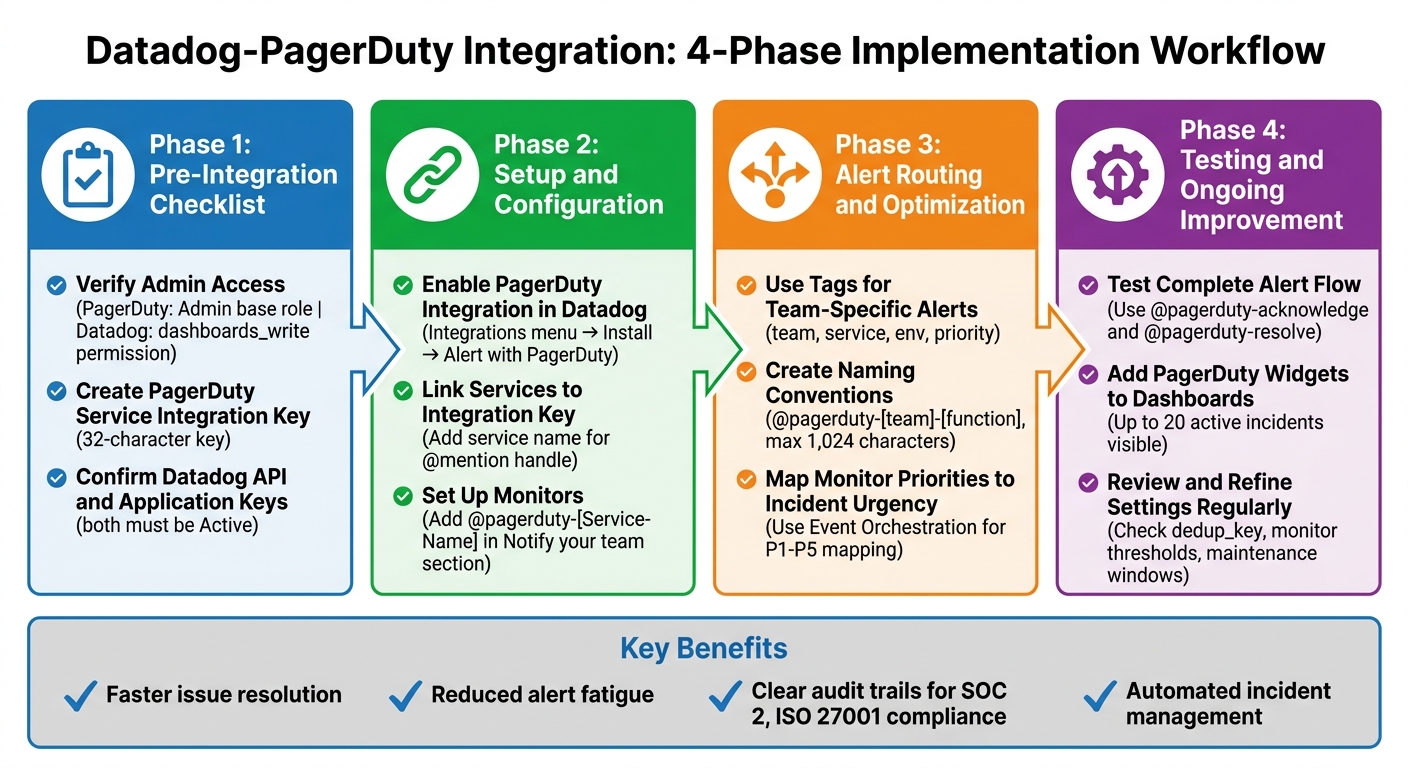
Datadog-PagerDuty Integration Setup Workflow: 4-Step Implementation Guide
New Apps for PagerDuty’s Datadog Integration
sbb-itb-bc9f286
Pre-Integration Checklist
Before integrating Datadog and PagerDuty, make sure everything is set up correctly. Follow these steps to prepare your environment and avoid any hiccups during the process.
Verify Administrative Access
First, check your permission levels on both platforms. In PagerDuty, you'll need an Admin base role to authorize the account connection. If you don’t have this role, contact your Account Owner for assistance, as this step won’t work without it.
For tasks like managing services and adding integrations in PagerDuty, you’ll need at least a Manager role. Higher roles, such as Admin, Global Admin, or Account Owner, also work. On the Datadog side, if you plan to include PagerDuty widgets on dashboards, make sure you have the dashboards_write permission.
| Platform | Required Role/Permission | Purpose |
|---|---|---|
| PagerDuty | Admin (Base Role) | Account authorization and linking |
| PagerDuty | Manager, Admin, or Account Owner | Managing services and adding integrations |
| Datadog | dashboards_write |
Adding PagerDuty widgets to dashboards |
Once you've confirmed the necessary roles, you can move on to generating the integration key.
Create PagerDuty Service Integration Key
To route Datadog events to PagerDuty, you’ll need a 32-character integration key. Here’s how to generate it:
- In PagerDuty, go to Services → Service Directory.
- Select your service, click the Integrations tab, and choose Add an integration.
- Select Datadog to generate the key .
If you’re using Event Orchestration for global routing, navigate to AIOps → Event Orchestration, select your orchestration, and copy the integration key from the Integrations tab. For existing integrations, click the expansion icon (∨) next to the Datadog integration to view the key.
Key rotation is crucial for security. If a key is ever compromised, go to the service’s Integrations tab, click Edit Integration, and select Generate a new integration key. This will immediately replace the old key, breaking current integrations until the new key is updated in Datadog.
This integration key ensures that Datadog alerts are properly routed to PagerDuty.
Confirm Datadog API and Application Keys
Datadog requires two key types to enable the integration: API keys and Application keys.
- API keys are unique to your organization and allow the Datadog Agent and integrations to submit data.
- Application keys are tied to the user who created them and provide access to Datadog's programmatic resources.
To check these keys, go to Datadog's Organization Settings and confirm they’re marked as Active. The Application Key must be linked to an Admin-level user to authorize third-party integrations like PagerDuty.
Keep these keys safe by storing them in a secure password manager. Remember, both platforms only show the full key once at creation.
Setup and Configuration Checklist
Now that you've got your permissions squared away and your keys ready, it's time to connect Datadog and PagerDuty. This setup happens entirely in Datadog and can be completed in just a few minutes.
Enable PagerDuty Integration in Datadog
First, open Datadog and head to the Integrations menu. Search for "PagerDuty", click Install, and then go to the Configuration tab. From there, select Alert with PagerDuty. This will redirect you to a PagerDuty authorization screen where you can log in using your credentials or SSO.
Once authorized, a bidirectional sync is established between Datadog and PagerDuty. This means that when a Datadog metric returns to normal, the related PagerDuty incident will automatically resolve - no manual steps required.
The final step here is to link your PagerDuty services within Datadog to complete the integration.
Link Services to PagerDuty Integration Key
After authorization, you'll see a configuration table in Datadog with two important fields: Service / Rule Table Name and Integration Key / Routing Key. The service name you input here will become your @mention handle. For instance, if you enter "database-alerts", you'll be able to use @pagerduty-database-alerts in your monitors.
Next, paste the 32-character integration key you generated earlier in PagerDuty's service integrations tab. If you're managing alerts for multiple teams, click Add Row to set up additional PagerDuty services. Be sure to use clear, descriptive names so everyone on your team knows which service to mention when configuring monitors.
For extra functionality, you can also add the Schedule URL and API Token to improve visibility into the PagerDuty schedules.
Once all services are linked, you're ready to configure your monitors to trigger alerts in PagerDuty.
Set Up Monitors for PagerDuty Alerts
When creating or modifying a monitor in Datadog, scroll down to the Notify your team section. Here, add @pagerduty-[Service-Name], making sure to use the exact service name you configured earlier.
Important: Datadog's monitor priorities don’t automatically map to PagerDuty’s incident priorities. As Demitri Morgan from PagerDuty explains:
"I recommend using an event orchestration ruleset to set the incident priority based on the priority set in the event by the Datadog monitor".
To ensure proper priority mapping, configure PagerDuty's Event Orchestration rules to read the alert_priority field from Datadog's payload and assign the appropriate urgency level.
Each monitor will send detailed event data to PagerDuty, including visual metrics or SLI details, giving your team immediate context to act quickly.
Alert Routing and Optimization Checklist
Routing alerts effectively is key to reducing downtime and avoiding alert fatigue. Misrouted alerts can lead to missed critical issues or unnecessary noise in the wrong team's queue.
Use Tags for Team-Specific Alerts
Tags like team, service, env, and priority are essential for automating alert routing. Before setting up any alert, make sure every monitor includes these tags. This allows you to create tag-based notification rules that automatically send alerts to the right team. For instance, a monitor tagged team:payment-processing and env:prod will trigger the @pagerduty-payments handle.
Avoid using a generic @pagerduty handle. Doing so routes alerts to the first available service in your integration, which is rarely the intended target. Instead, specify the exact service name (e.g., @pagerduty-database-alerts) to ensure alerts reach the correct team. Additionally, include the PagerDuty handle in your monitor's recovery message so incidents resolve automatically when the issue is fixed.
Create Naming Conventions for Alerts
Consistent naming helps teams quickly understand and address incidents. Adopt a standard format for service handles, such as @pagerduty-[team]-[function]. Examples might include @pagerduty-backend-api or @pagerduty-frontend-checkout.
Keep notification messages concise - 1,024 characters or fewer - since Datadog truncates longer messages when sending to PagerDuty. Focus on the essentials: what broke, where it broke, and its immediate impact. Use your tagging schema to clearly indicate ownership and avoid "orphaned" alerts that lack a responsible team.
Once naming conventions are in place, ensure monitor priorities are aligned with incident urgency.
Map Monitor Priorities to Incident Urgency
Datadog's monitor priorities (P1–P5) don’t automatically align with PagerDuty’s incident urgencies. Instead, they appear in the alert_priority field of the incident’s custom details.
To fix this, use PagerDuty Event Orchestration to read the alert_priority field and assign the appropriate incident priority. As Demitri Morgan from PagerDuty advises:
"I recommend using an event orchestration ruleset to set the incident priority based on the priority set in the event by the Datadog monitor".
If you're using Terraform, keep priority mappings synchronized to avoid manual updates. This ensures, for example, that a P1 alert in Datadog always triggers a high-urgency incident in PagerDuty.
For on-call teams, limit high-priority pages to two or fewer per shift and set acknowledgment windows to 5–15 minutes. Focus alerts on symptom-based monitors, such as those detecting latency spikes or 5xx errors, instead of low-level metrics like CPU usage, which often generate noise without actionable insights.
Testing and Ongoing Improvement
Once your integration is set up and routing rules are in place, the next step is to test everything and keep an eye on how it performs over time.
Test Complete Alert Flow
Start by manually triggering a test incident in Datadog. Go to Events > Stream and submit an event update using @pagerduty-[Service-Name]. This will create a new incident in PagerDuty. After that, use @pagerduty-acknowledge or @pagerduty-resolve to update the incident status and confirm that the changes are reflected. If a Datadog metric goes back to its normal range, PagerDuty will automatically receive a resolve event to close the incident.
To enhance visibility, integrate dashboard widgets that allow you to monitor incidents effectively.
Add PagerDuty Widgets to Dashboards
You can add PagerDuty widgets to your Datadog dashboards for real-time monitoring. First, install the PagerDuty UI integration. Then, go to Add Widgets > UI Extensions to include widgets. The Incidents by PagerDuty widget allows you to view and manage up to 20 active incidents directly from Datadog. Meanwhile, the Status Dashboards by PagerDuty widget provides insights into the health of PagerDuty Business Services, which is available on Business, Digital Operations, or Enterprise plans. Keep in mind that the user setting up these widgets must have the dashboards_write permission.
Once testing and dashboard integration are complete, focus on refining your settings to maintain peak alert performance.
Review and Refine Settings Regularly
It’s important to review your integration settings regularly to avoid alert fatigue and ensure alerts are routed correctly. If incidents are being sent to the wrong team, use PagerDuty Event Orchestration to inspect the Datadog event payload and adjust routing based on specific tags. Pay attention to the balance between high-urgency and low-urgency incidents. Too many low-urgency alerts might suggest that your monitor thresholds need to be tightened.
To manage notifications more effectively, ensure consistent use of the dedup_key across monitors. This helps group related alerts and prevents excessive notifications. Monitor metrics like incident duration, outlier context, and urgency levels to identify "noisy" services that might need better alert suppression. Additionally, regularly update PagerDuty maintenance windows to suppress alerts during planned downtimes.
Ashwin Jiwane from PagerDuty emphasizes the importance of testing and visibility:
"Any system will ultimately fail. Having visibility into your systems and consistently testing your systems is an imperative to limit the impact a failure will have on your customers".
Wrapping It Up
The steps outlined above highlight how integrating Datadog with PagerDuty can transform incident response for SMBs, making it faster, more efficient, and easier to manage.
Why This Integration Works
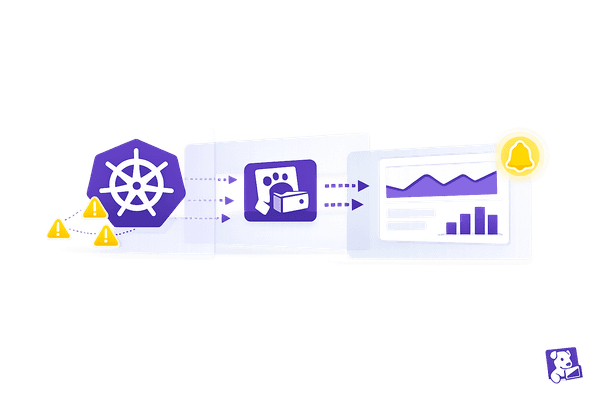
The Datadog–PagerDuty integration ensures that the right person gets notified at the right time. When a monitor triggers in Datadog, it creates an incident in PagerDuty with all the necessary details. As metrics stabilize, incidents are automatically resolved, reducing manual follow-up.
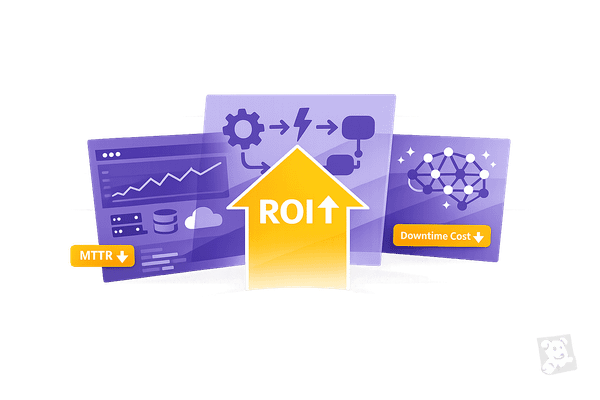
For small teams, this setup eliminates outdated processes like paging spreadsheets and scattered communication. Instead, it provides automated routing, clear audit trails, and urgency-based notifications. This is a game-changer during audits like SOC 2 or ISO 27001, where you need to show exactly when an issue was detected, who responded, and how it was resolved.
By simplifying incident workflows, this integration helps SMBs focus on what matters most: resolving issues quickly and keeping systems reliable.
Handy Checklist for SMBs
- Before You Begin: Confirm admin access, set up the PagerDuty integration key, and ensure Datadog API and application keys are active.
- During Configuration: Enable the PagerDuty integration in Datadog, link services to the correct integration key, and set up monitors with severity-based alerts. Use consistent tags like
service,team, andenvironmentfor precise routing. - Post-Launch: Test alert flows using
@pagerduty-[Service-Name], add relevant widgets to dashboards, review settings periodically, and rotate keys for security.
This integration is designed to make incident management seamless and efficient, especially for SMBs with limited resources.
FAQs
Why aren’t my Datadog incidents resolving automatically in PagerDuty?
Datadog incidents don’t automatically resolve in PagerDuty because the integration isn’t built to handle auto-resolution by default. To make this happen, you’ll need to set up custom rules using PagerDuty’s event orchestration features or its API. Without these configurations, incidents will stay open since the standard integration is primarily designed to send alert notifications, not to manage the entire incident lifecycle.
How do I route alerts to the correct PagerDuty service without using a generic handle?
To ensure alerts reach the right teams, set up dedicated PagerDuty services for each alert type or system. In Datadog, you can add these services by entering their specific names and integration keys from PagerDuty. This setup helps direct alerts to the appropriate team or incident category, rather than using generic catch-all notifications. You can configure this in Datadog's Integrations section by linking each PagerDuty service to its corresponding key.
How can I map Datadog monitor priority (P1–P5) to PagerDuty incident urgency?
You can align Datadog monitor priorities (P1–P5) with PagerDuty incident urgency by setting up event orchestration rulesets. These rulesets help ensure that incidents in PagerDuty match the urgency level of the corresponding Datadog monitor, making it easier to classify and address incidents appropriately.