Container Storage Metrics in Datadog
Monitor container storage metrics effectively with real-time insights on disk usage, I/O performance, and more to prevent downtime and manage costs.
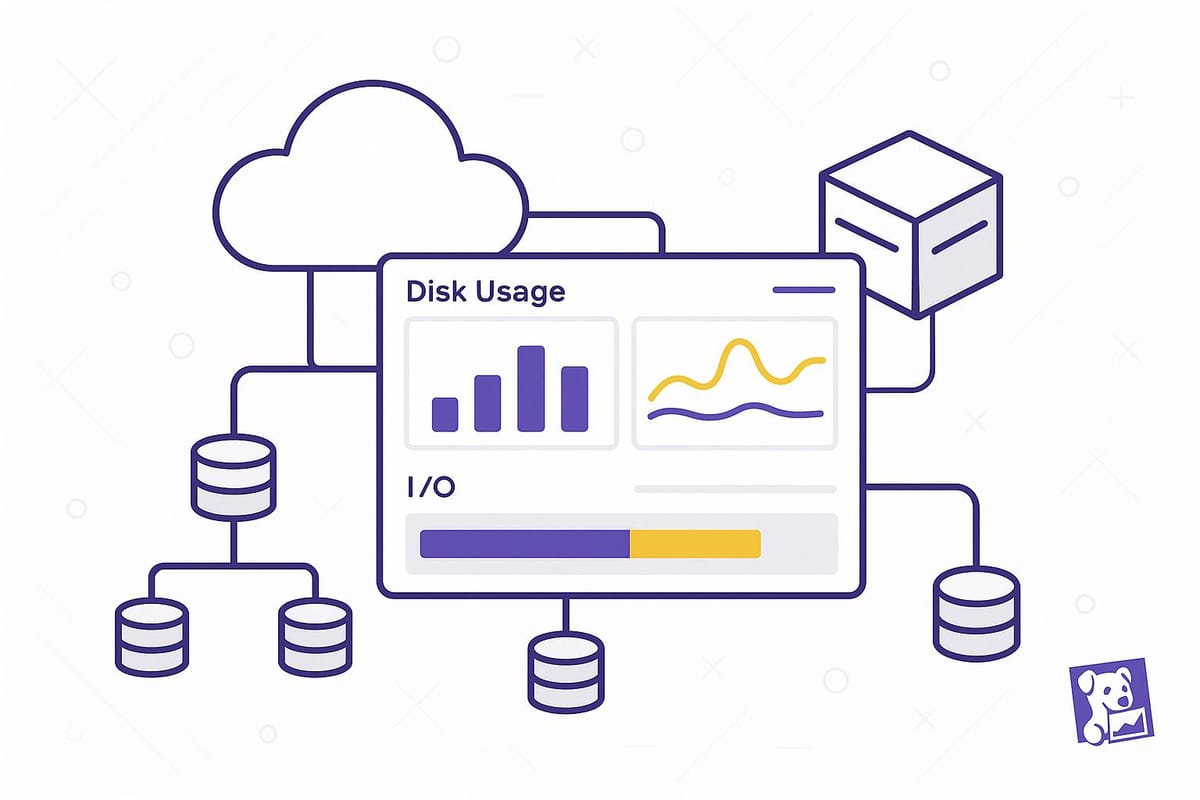
Monitoring container storage is essential to prevent downtime, manage costs, and ensure smooth operations. Datadog simplifies this by offering real-time insights into key metrics like disk usage, I/O performance, inode usage, and volume mount status - all within a single dashboard.
Key Takeaways:
- Disk Usage: Tracks used and available space to avoid crashes and disruptions.
- Disk I/O Performance: Monitors read/write speeds to maintain application responsiveness.
- Inode Usage: Prevents issues caused by running out of file metadata storage.
- Volume Mount Status: Alerts on storage access failures to ensure data availability.
Datadog integrates seamlessly with Docker and Kubernetes, making it easy to set up monitoring, create dashboards, and set alerts. For SMBs, it’s a powerful tool to manage growth and control costs while keeping containerized environments reliable and efficient.
Overview of Docker Metrics Collected by the Datadog Agent
Key Container Storage Metrics to Monitor
Monitoring the right metrics is crucial for SMBs to avoid downtime and performance hiccups. Datadog offers insights into several key metrics, giving teams real-time visibility into the health, performance, and security of containerized environments. These metrics enable teams to spot and address issues across every layer of their clusters, forming the backbone of effective container storage monitoring.
Disk Usage: Used and Available Space
Keeping an eye on disk usage is a fundamental part of container storage management. This metric tracks how much storage each container uses and how much remains available on the host system - something especially critical for setups with limited hardware.
Datadog presents disk usage in both gigabytes and percentages, helping identify containers nearing capacity. It monitors temporary storage, shared volumes, and the host filesystem.
When containers max out their allocated disk space, things can go south quickly: applications crash, logs stop recording, and database transactions fail. By tracking available space, teams can receive alerts before hitting critical thresholds, avoiding these disruptions.
Containers that handle file uploads, generate logs, or process large datasets deserve extra attention. These workloads can eat up disk space fast, particularly during peak activity or when processing large batches of data. Staying on top of disk usage is key to keeping container performance steady.
Disk I/O: Read/Write Performance
Disk I/O performance is another metric that SMBs need to monitor closely. Slow read/write speeds can drag down application responsiveness, impacting the overall user experience. This metric reflects how efficiently storage is being accessed. Datadog tracks read and write speeds, throughput rates, and I/O wait times across all containers and volumes.
When disk I/O slows down, it often points to hardware bottlenecks, misconfigured storage, or resource competition among containers. For instance, a container performing a database backup might temporarily spike I/O activity, while a web server container should maintain more consistent patterns.
By tracking throughput metrics, teams can pinpoint which containers are creating the most storage activity. Datadog flags unusual activity and helps allocate resources proactively, ensuring smooth application performance even when IT staff resources are stretched thin.
Filesystem Inodes Usage
Inodes, which store file metadata on Linux systems, are a lesser-known but critical metric. Running out of inodes can cause chaos, even when disk space is still available. When inode limits are hit, applications can crash, the operating system may restart, and scheduled tasks might fail. This often happens when containers generate a large number of small files, such as cache files, temporary data, or logs.
Datadog tracks inode usage, including the total number, those in use, those free, and the percentage in use. As ssbarnea highlighted:
"Monitoring inodes is useless if you do not track the percent free of them. Their number is irrelevant because you can have a one gigabyte ram disk or a huge 10 TB disk and they have a very different number of inodes. Still, percent free is something that we can use to show a meaningful graph and trigger an alert."
- ssbarnea
For SMBs, inode monitoring is especially critical for containers that handle user uploads, generate temporary files, or produce a high volume of small data files. Setting alerts when inode usage hits 80% gives teams time to clean up unnecessary files before hitting a critical point.
Volume Mount Status
Monitoring volume mount status is essential to ensure containers can access the storage they depend on. When mounted volumes fail or face connectivity issues, containers lose access to persistent data, configuration files, or shared storage.
Datadog keeps tabs on the health and status of mounted volumes, whether they’re network-attached, cloud-based, or local persistent volumes. This is particularly important in environments where network connectivity impacts storage availability.
Mount status alerts notify teams when storage becomes inaccessible. Common culprits include network timeouts, authentication errors, or storage service outages. Early warnings allow teams to implement failover solutions or restore connectivity before applications are disrupted.
For containers that share storage across multiple nodes, monitoring volume mounts can also reveal when specific nodes lose access to shared resources. This insight helps ensure high availability and prevents data inconsistencies in distributed systems.
Datadog goes a step further by correlating volume mount status with other data - metrics, logs, traces, network insights, and security signals. This unified perspective helps teams determine whether storage issues stem from infrastructure, application bugs, or external dependencies.
Setting Up Container Storage Monitoring in Datadog
To get started with container storage monitoring in Datadog, you’ll need to deploy the Datadog Agent and enable key integrations. This setup allows you to monitor disk usage, I/O, inodes, and volume mount status effectively.
Connecting Datadog with Docker and Kubernetes
Once your containers are connected, enable critical integrations for a complete monitoring experience. The Datadog Agent acts as the link between your containers and Datadog's platform. This lightweight service gathers resource metrics and events from both Docker and Kubernetes environments. In Kubernetes, deploy the Agent as a DaemonSet on every node to ensure full coverage. If your cluster uses role-based access control (RBAC), make sure to deploy the Agent's RBAC manifest first to grant the necessary permissions.
The Agent uses Autodiscovery to connect to containerized services via configuration templates. For Kubernetes, you can use pod annotations to attach configuration parameters directly to containers. For instance, when monitoring Redis, you can add annotations to a ReplicationController managing Redis replicas. These annotations specify the check name (e.g., redisdb) and the required configuration, ensuring consistent monitoring across all Redis containers. Metrics can then be viewed by image name for better organization.
Additionally, the Datadog Agent comes with a built-in DogStatsD server, which allows you to collect custom metrics. This feature is particularly useful for tracking storage metrics specific to your applications that standard system monitoring might not capture.
Turning On Required Integrations
To monitor container storage effectively, enable specific integrations. The Docker integration is crucial for gathering metrics on container performance and storage resource usage. In Kubernetes environments, the Kubernetes integration provides detailed insights into cluster performance and resource allocation, working seamlessly alongside the Docker integration.
If you’re using Azure Storage, enabling the Azure integration can provide metrics for Azure Blob, Table, Queue, and File storage. Activating these integrations is simple: go to the Integrations section in Datadog’s web interface, search for the integration you need, and follow the configuration steps. Once the integration is set up, data will start populating your dashboard within minutes.
Customizing Metric Collection
To manage costs and focus on what matters, configure Datadog to collect only the metrics you need. Each custom metric is defined by a unique combination of its name and associated tag values, including the host tag. This level of detail allows you to fine-tune your monitoring to capture the most relevant data.
Organize containers with tags based on application, environment, or function to create streamlined dashboards and alerts. Metrics can be collected through various methods, such as Prometheus/OpenMetrics endpoints, logs, traces, custom checks, or direct submissions to the Agent. For containers involved in critical storage operations - like databases or file processing services - you might want to track additional custom metrics. Examples include backup completion rates, data processing volumes, or specific storage usage patterns. This approach ensures you gather meaningful insights while keeping your monitoring costs under control.
With this setup in place, you’ll be ready to build effective dashboards and alerts tailored to your needs.
Creating Dashboards and Alerts for Storage Metrics
Turn raw data into meaningful insights with dashboards and alerts that work for you. Datadog's tools for visualization and alerting make it easier to track trends, catch potential issues early, and ensure your storage systems are running smoothly across your containerized environment. Let’s explore how to create user-friendly dashboards and set up alerts that keep your storage metrics under control.
Building Dashboards for Storage Metrics
Datadog provides dashboards that offer both high-level overviews and detailed breakdowns of your storage metrics. With pre-built dashboards, you can quickly access a unified, searchable view of your data - no need to spend time crafting custom queries from scratch. These dashboards are a great starting point, and you can tweak them to better suit your specific needs.
Setting Alerts for Critical Thresholds
Datadog’s Recommended Monitors are ready-to-use alerts crafted from industry expertise, designed to be proactive and actionable. For Kubernetes monitoring, for instance, Datadog includes a Recommended Monitor that keeps an eye on disk space usage per node. This monitor is set to trigger a warning when usage surpasses 85% and an alert at 88%, with options to adjust the thresholds to fit your application’s requirements.
Best Practices for SMBs Using Datadog for Container Storage Monitoring
For small and medium-sized businesses, container storage monitoring can feel like walking a tightrope. You need clear visibility into your systems without overspending, and your tools must grow alongside your business. Here’s how SMBs can make the most of Datadog while keeping costs under control.
Monitoring for Growth
Growth is inevitable - plan for it by establishing baseline storage metrics. Track how your storage behaves during busy times, seasonal changes, or when onboarding new customers. This data will help you make informed decisions about scaling your infrastructure.
Set up predictive alerts to give your team a head start. Instead of waiting until disk usage hits 90%, configure warnings at 75% or 85%. This proactive approach can help you avoid last-minute scrambles to fix critical issues.
Regularly review your dashboards - monthly is a good rule of thumb. Look for trends like gradual increases in I/O operations, steady storage consumption growth, or changes in filesystem inode usage. These patterns can signal when it’s time to upgrade your infrastructure or fine-tune your applications.
Tailor your monitoring profiles to match your growth stages. Managing 10 containers is a completely different ballgame compared to handling 100 or 1,000. Adjust your Datadog setup to focus on the metrics that matter most for where your business is right now.
Once you’ve set up a growth-focused monitoring strategy, it’s time to fine-tune your operations to keep costs in check.
Reducing Costs with Efficient Monitoring
As your usage grows, keeping costs under control becomes a priority. Datadog’s pricing structure is straightforward but can add up quickly if not managed carefully. For example:
- Infrastructure Monitoring: $15 per host per month (annual plan)
- APM: $31 per host per month
- Log Management: $0.10 per GB ingested
To avoid unnecessary expenses, focus on collecting only the data you truly need. Regularly audit your custom metrics and remove those that aren’t actively used. Consolidating redundant metrics and reducing high-cardinality tags can also help trim costs.
Log management, one of the biggest expenses, deserves special attention. Use retention filters to discard logs from development or testing environments, apply exclusion filters for verbose logs, and implement sampling for repetitive logs. For older logs, consider moving them to cheaper storage solutions.
Here are some specific cost-saving measures:
| Measure | Action | Savings |
|---|---|---|
| Log Management | Use Flex Logs for high-volume data | Savings vary based on usage volume |
| Data Transfer | Switch to PrivateLink over NAT Gateways | Up to 80% savings on transfer costs |
| Container Monitoring | Pre-pay for containers ($1/container/month) | Cheaper than on-demand rates |
Additionally, take advantage of committed use discounts for services with predictable usage. For dynamic workloads, explore consumption-based options like Container Monitoring or Serverless Monitoring. Automate off-hour shutdowns for non-production workloads and consolidate tasks onto fewer instances to reduce the number of monitored hosts. For Kubernetes setups, tweak pod density to maximize node usage and rely on autoscalers to adjust resources in real time.
Using Insights from Scaling with Datadog for SMBs
Once you’ve nailed the basics of growth and cost management, learning from expert insights can help you refine your approach. Effective container storage monitoring is key to running scalable operations. The Scaling with Datadog for SMBs blog shares strategies tailored for SMBs, emphasizing the importance of starting small and scaling gradually.
Focus your monitoring efforts on metrics that impact your business the most. For instance, prioritize storage metrics like disk space and I/O performance, which directly affect customer experience. As your team grows in expertise and your budget allows, expand into areas like APM, log management, and synthetic monitoring.
Look to other SMBs for inspiration. Many start with basic infrastructure monitoring and gradually layer on additional tools as their needs evolve. Datadog’s bucket- and prefix-level metrics, for example, can provide detailed insights into usage patterns, performance bottlenecks, and cost-saving opportunities.
Conclusion
Keeping a close eye on container storage metrics is essential for maintaining smooth operations and supporting business growth. By tracking these metrics consistently, you can spot potential issues early, preventing disruptions for your customers and making smarter decisions about scaling your infrastructure.
The core metrics - disk usage, I/O performance, filesystem inodes, and volume mount status - are the pillars of effective container monitoring. Monitoring disk usage helps you avoid those dreaded "out of space" errors, while keeping tabs on I/O performance ensures your storage can handle the workload. Inode monitoring can catch subtle filesystem problems before they escalate, and checking volume mount status ensures containers always have access to the data they need.
Datadog simplifies this process by bringing all these metrics into a single, unified platform. With its seamless integration with Docker and Kubernetes, you can start monitoring quickly and efficiently, enabling faster detection and resolution of potential issues.
Key Takeaways
Start with the basics. Focus on critical metrics like disk usage and I/O performance first, as they have the most immediate impact on your applications. Once you've built a solid foundation, add inode monitoring and volume status tracking for a more complete picture of your storage health.
Be proactive, not reactive. Setting alerts - for example, at 75% disk usage - gives your team enough time to address problems without scrambling. This approach saves both time and money in the long run.
Design dashboards with purpose. Create dashboards that highlight the metrics your team uses most often. A clear, well-organized dashboard makes it easier to spot trends and share insights with stakeholders.
Regularly review and refine your setup. As your business grows, your monitoring needs will evolve. Regularly assess your metrics to ensure your system remains efficient and cost-effective.
The resources, like Scaling with Datadog for SMBs, emphasize that effective monitoring is about balance. Instead of trying to track every possible metric, focus on what matters most for your business's current size and growth stage.
FAQs
How does Datadog help identify and prevent container storage issues before they cause downtime?
Datadog offers real-time visibility into the health, performance, and security of container storage, enabling teams to identify and resolve potential problems early. By keeping a close eye on critical metrics like storage usage, I/O performance, and error rates, it helps you catch unusual patterns before they turn into bigger issues.
On top of that, Datadog provides customizable alerts and downtime scheduling, making it easier to handle maintenance or scaling tasks without causing unnecessary interruptions. This forward-thinking approach minimizes the chances of storage-related downtime, ensuring your applications stay reliable and perform seamlessly.
How can I set up container storage monitoring in Datadog for my Kubernetes environment?
To keep an eye on container storage in a Kubernetes environment using Datadog, you’ll need to start by installing and setting up the Datadog Agent on your Kubernetes cluster. Don’t forget to enable the Cluster Agent - it’s a key component for efficiently gathering monitoring data across the entire cluster.
Once that’s in place, configure the Cluster Agent to collect storage-related metrics such as persistent volume and storage class details. This will give you a clear view of the performance and overall health of your container storage. If you need step-by-step guidance, Datadog’s documentation is a great resource to consult.
How can small and medium-sized businesses control costs while monitoring container storage with Datadog?
Small and medium-sized businesses can manage their Datadog costs by fine-tuning their monitoring setup. One effective approach is to filter out unnecessary logs and concentrate on tracking only the most important metrics, which helps cut down on data ingestion. Adjusting retention settings is another smart move - store data only for the duration it’s actually needed. For short-term or temporary workloads, opting for consumption-based pricing can also make a big difference.
Another way to save money is by aggregating metrics to reduce the level of detail where it’s not essential. Additionally, instead of running monitoring tasks around the clock, schedule them during critical periods to get the insights you need without unnecessary expenses. These steps allow you to get the most out of Datadog’s tools without overspending.

